Motadata Docs
- AIOps
- Getting Started
- Flow Analysis
- Dashboards
- Monitors
- What is a Monitor?
- Monitor Settings
- Monitor Rediscovery
- Topology Scanner
- SNMP Device Catalog
- Process Monitoring
- Service Monitoring
- File and Directory Monitoring
- Configure the Monitoring Time-period
- Custom Monitoring Fields
- Configuring a Monitor Maintenance Window
- How to edit Monitor properties?
- How to Delete a Monitor?
- Integrations
- Agent-Based Monitoring System
- Log Management
- Plugin Management
- Topology
- ServiceOps
- Technician User Guide
- Introduction
- Motadata Dashboard
- Request Management
- Overview
- Request List View
- Creating a Request
- Creating a Service Request
- Request Details Page
- Updating a Request
- Merging and Splitting Requests
- Marking Requests as Spam
- Assigning and Claiming a Request
- Archiving a Request
- Printing a Request
- Status and Assignment Transition
- Resolving and Closing a Request
- Work Conversations
- Tasks
- Adding Relations
- Adding Work Log
- Audit Trail
- Sending Email Notifications
- Integration
- Asking for Approval
- Asking for Feedback
- Adding Watchers
- Executing Scenarios
- Problem Management
- Change Management
- Release Management
- Overview
- Use Case
- Release List View
- Creating a Release
- Release Details Page
- Assigning and Claiming a Release
- Updating a Release
- Release Workflow
- Planning a Release
- Collaboration
- Asking for Approval
- Tasks
- Adding Relations
- Adding Work Log
- Audit Trail
- Sending Email Notifications
- Closing a Release
- Reopening a Release
- Archiving a Release
- Restoring Release
- Asset Management
- Contract Management
- Purchase Management
- Patch Management
- Package Management
- Project Management
- Knowledge Management
- Reports
- Approval Management
- Task Management
- Admin Section
- Overview
- Automation
- Users
- Organization
- Support Channels
- Request Management
- Service Catalog
- Problem Management
- Change Management
- Release Management
- Asset Management
- Overview
- Asset Types
- Asset Custom Fields
- Asset Status
- Asset Custom Rules
- Asset Groups
- SNMP Custom Properties
- Software Categories
- Software Types
- Relationship Types
- Asset Discovery
- Software Rules
- RDP Configurations
- Product Types
- Manufacturer Catalog
- Product Catalog
- Product Custom Fields
- Vendor Catalog
- Vendor Custom Fields
- Barcode
- IP Range Location
- Asset Movement
- Manage Baselines
- Variance Detection
- Wake On LAN
- Asset Configuration
- Contract Management
- Purchase Management
- Patch Management
- Project Management
- Knowledge Management
- User Survey
- Support User Guide
- Integration Docs
- Installation and Upgrade Document
- Introduction
- Prerequisite Guide
- Server Installation Guide
- Plugin Server Installation Guide
- High Availability
- Upgrade Guide
- Patch Installation Guide
- File Server Installation Guide
- DMZ Server Installation Guide
- Agent Installation Guide
- Remote Desktop Installation Guide
- Motadata ServiceOps WebRTC Installation Guide
- Poller Service Installation Guide
- Technician User Guide
Preset Dashboards
You can take a glance at these graphical representations of flow datasets to gain meaningful insights into your network. By default, this screen displays the information for all the devices sending their flow to Motadata AIOps.Actions available on the preset dashboards
-
Select the Event Source Select the source(s) for which you want to display the flow data on the dashboard.
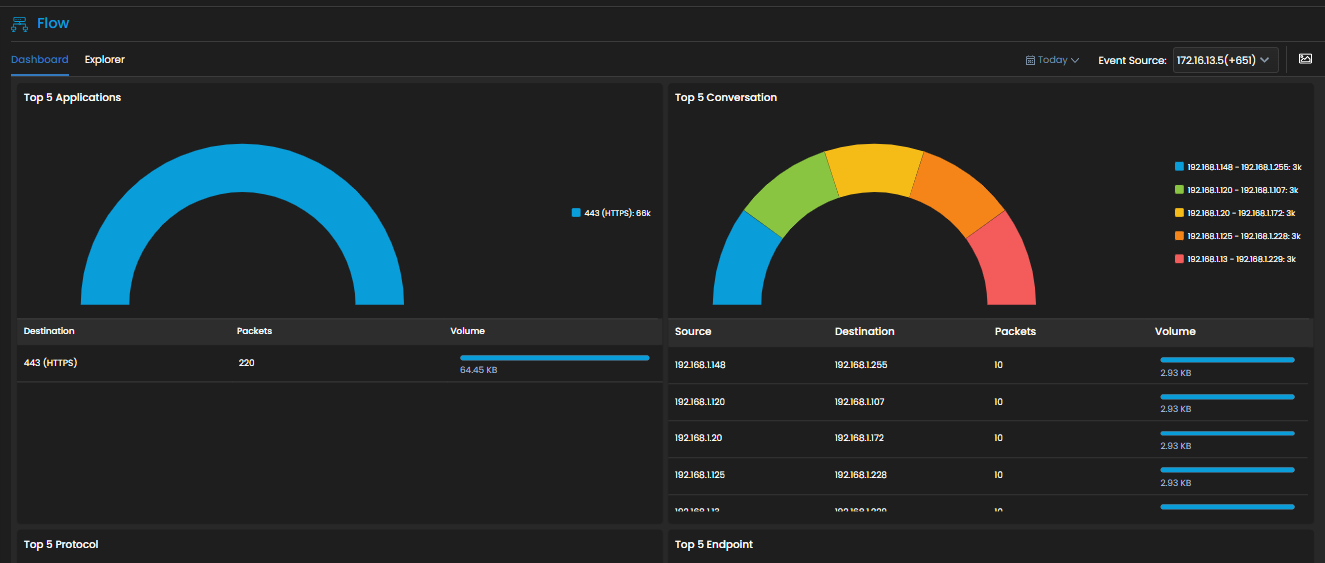
Click on the Event Source drop-down at the top-right of the screen above the dashboard. The list of all the devices for which flow data is being sent to Motadata AIOps can be seen in the dropdown. Select the devices for which you want to display the data on the dashboards as per your requirement from the drop-down.
- Take a screenshot of the dashboard Select
 to take a screenshot of the dashboard.
 - Change the time period of the flow data Select
 to change the time period for which flow data is shown on the dashboard