How to analyze the flow data?
Motadata enables analysis of the network flow through Flow Explorer. It is a fast and large-scale network flow processing tool that enables the visual representations of flow datasets effortlessly through a Sankey diagram.
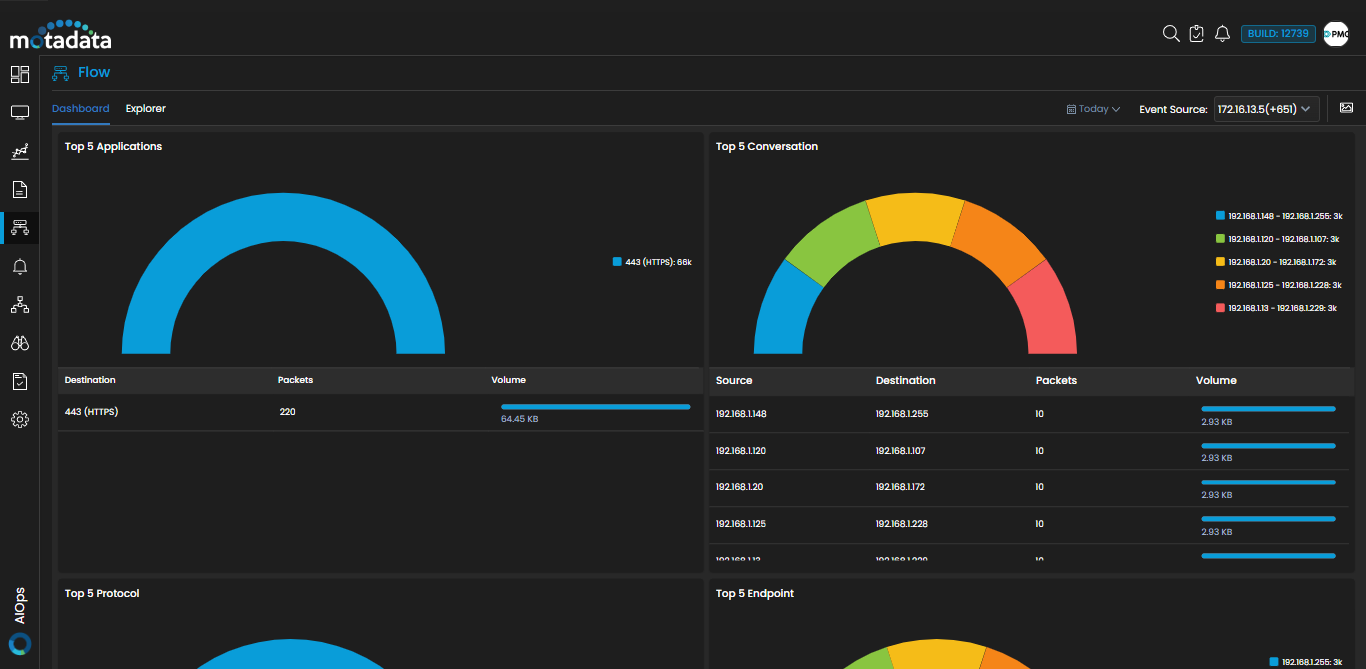
Go to the Menu, Select Flow Explorer  . The Flow Dashboard screen is now displayed.
The flow analysis in Motadata AIOps could be done in one of the following ways:
- Preset Dashboards: Multiple inbuilt dashboards are available on the flow analytics screen. These represent important data sets such as Top 5 Conversation and Top 5 Protocols in graphical form.
- Flow Explorer: This tool can help you visualize the flow for all the devices sending their flow data to Motadata AIOps.