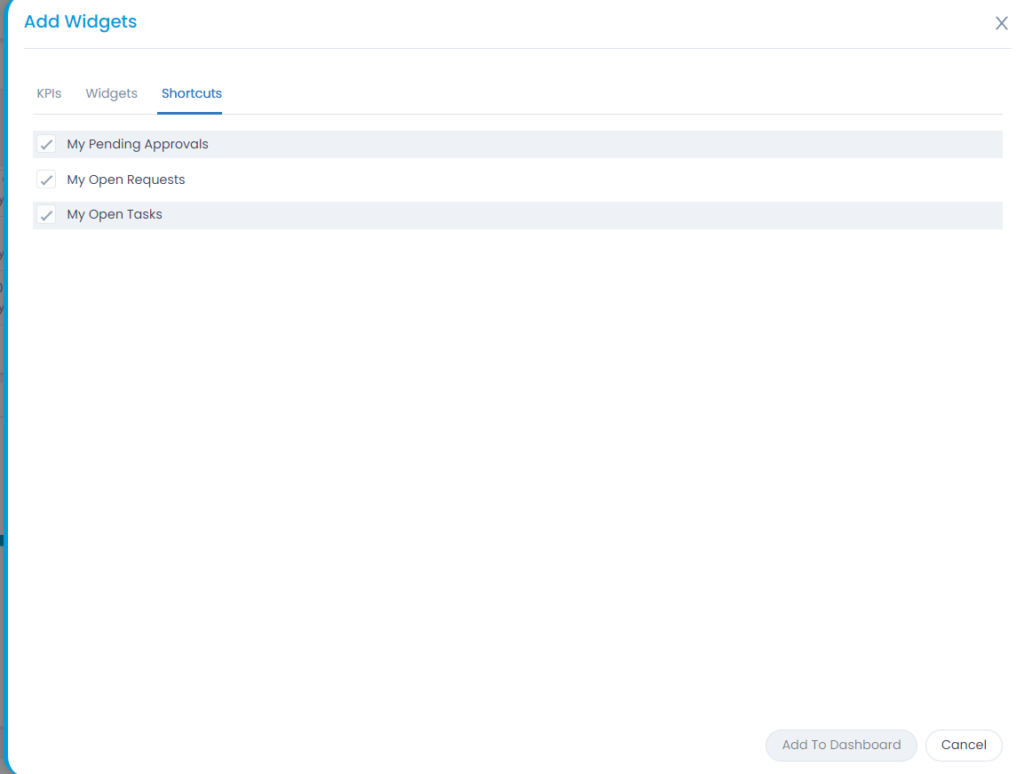
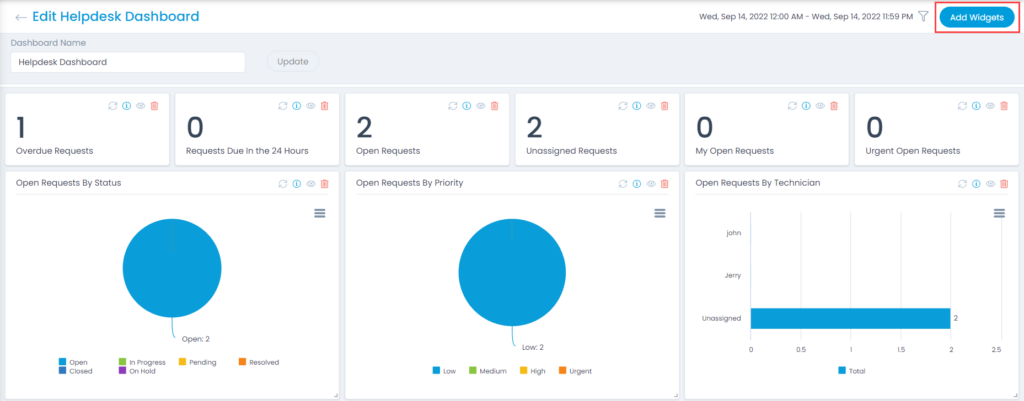
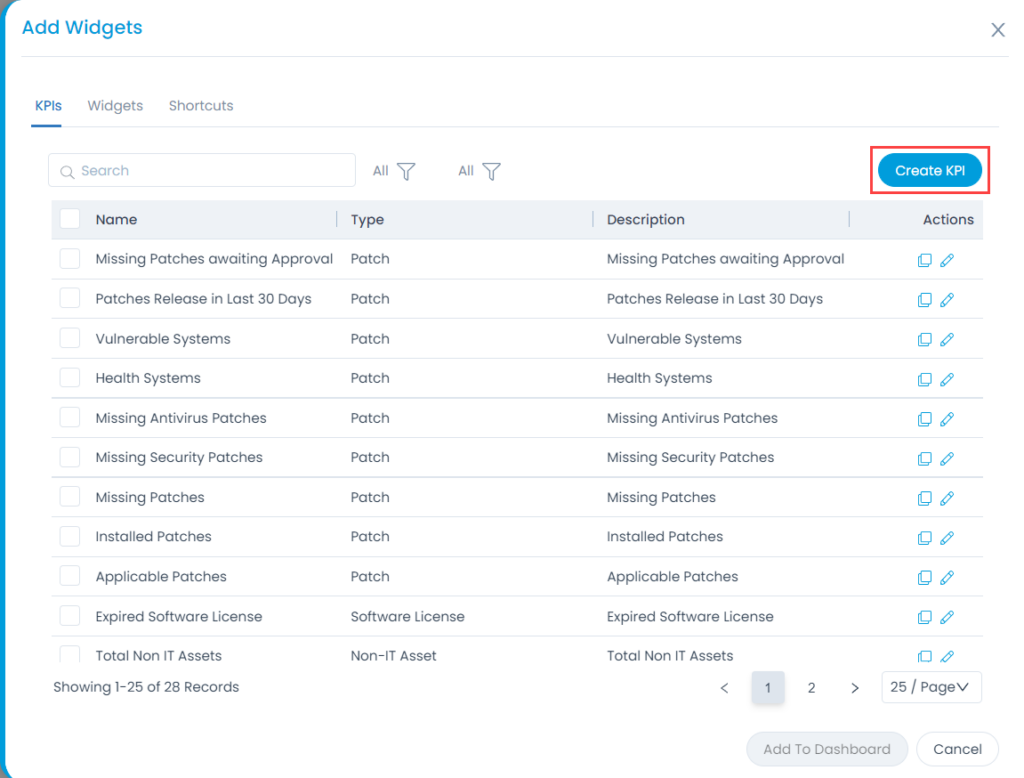
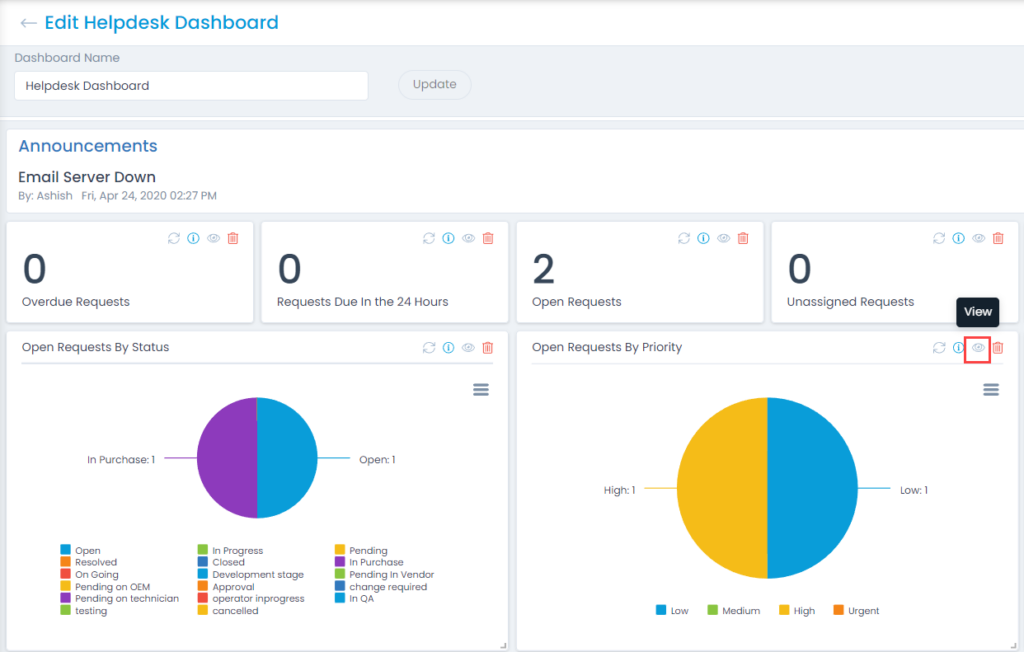
Motadata Docs

Managing Widgets

A Dashboard is like an empty canvas, and widgets are data blocks showing specific data. Multiple widgets together give contextual meaning to a Dashboard. There are n number of permutations that can be achieved using different kinds of widgets all showing different data.

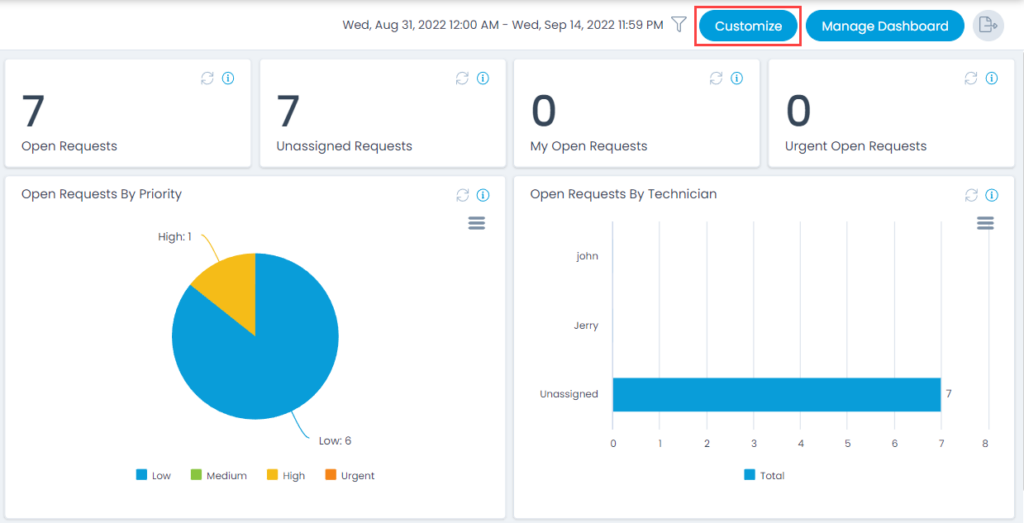
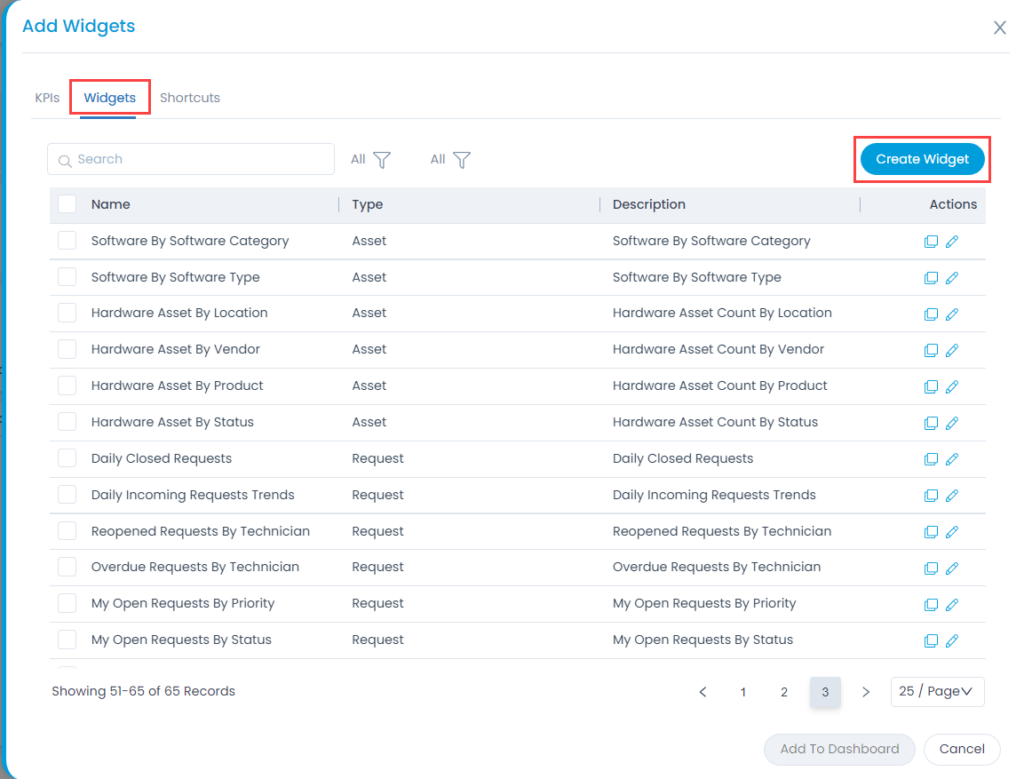
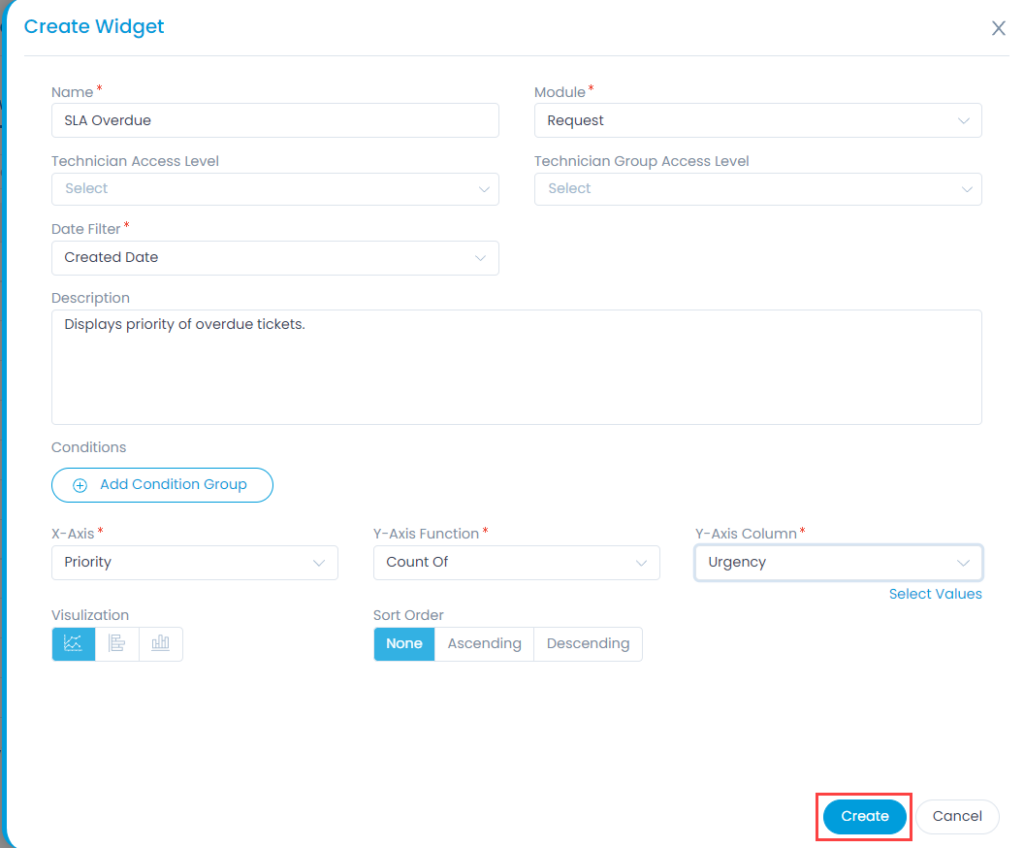
We currently have three kinds of widgets:

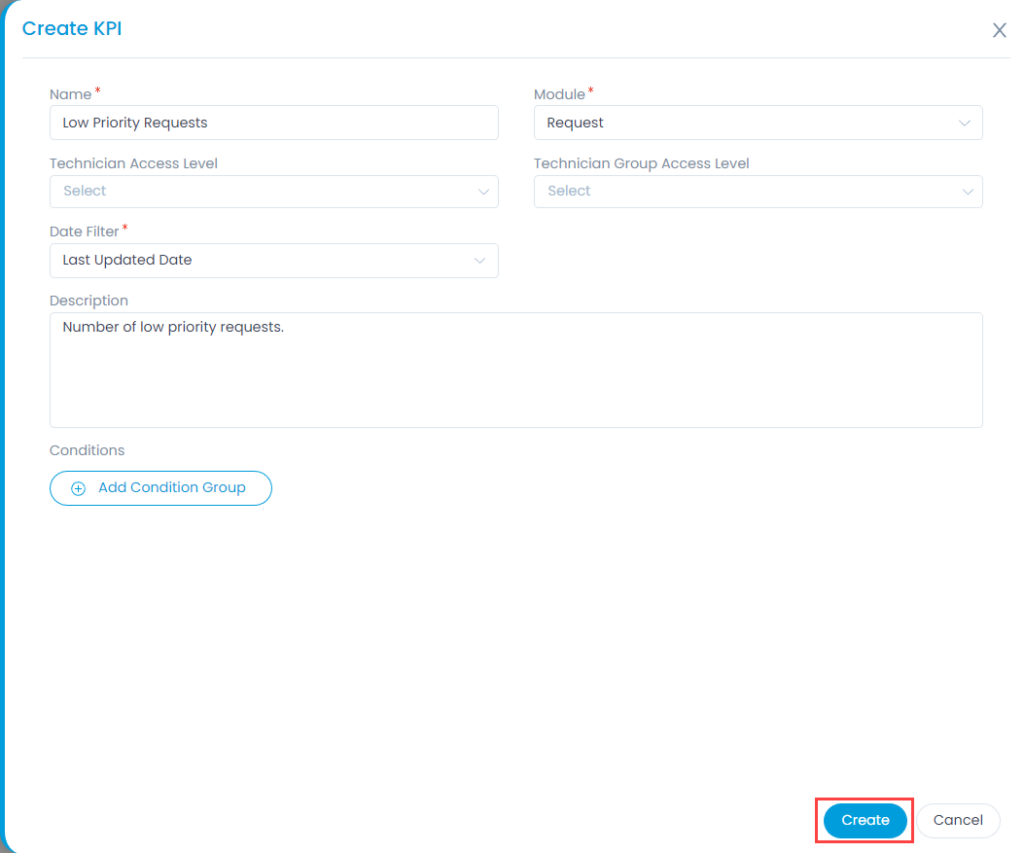
  • KPI: The abbreviation stands for Key Performance Indicator which is a counter of occurrences satisfying a preset condition. For example, there could be a KPI that shows the number of Request tickets having reopen count greater than 0.
KPI
KPI
  • Widget: A widget shows data points graphically across X and Y coordinates or as proportions. For example, count of Problem tickets can be shown across priorities using a Bar Chart.
Widget
Widget
  • Shortcut: It is a predefined box that shows specific system data. For example, there is a Shortcut box called My Open Request that shows recent open Requests assigned to you.
Shortcuts
Shortcuts

A user can perform the following operations with widgets:

  • View widgets, along with their parameters.
  • Create custom widgets (not possible with Shortcuts).
  • Edit existing widgets (not possible with Shortcuts).
  • Create duplicate of a widget (not possible with Shortcuts).
  • Delete a custom widget (not possible with Shortcuts and predefined widgets).

Creating a Custom widget

Here, you can create n number of custom widgets (only KPIs and Widgets) apart from the predefined ones.

Accessing the widgets panel

  • Go to the Dashboard page.
  • Click on the Customize button and the Edit Helpdesk Dashboard page appears.
  • Click the  Add widgets button on the top-right corner of the page. Add Widgets popup appears.
Customize Button
Customize Button
Add Widgets
Add Widgets

Creating a KPI

  • In the Add Widgets popup, select the KPIs tab, and click on Create KPI.
Create KPI
Create KPI
  • A dialog box opens. Enter the following details:
KPI Parameters
KPI Parameters
Parameter Description
Name Name of the KPI.
Module Name of the module of which the KPI belongs (either Request, Service Catalog, Problem, Change, Release, Asset (Hardware, Software, and Non IT), Patch, Software License, and Project).
Technician Access Level Select the Technicians to whom you want give access to the KPI.
Technician Group Access Level Select the technician group to whom you want to give access to the KPI.
Date Filter Select the date filter based on which the data should be displayed. It allows you to filter data using time. The options are:

  • Created Date: This option is valid for all modules. A Dashboard has a time filter using which the KPI displays only those data points whose create date falls within the selected time period. For example: If the time period is selected as Last 7 days, the KPI will display only those assets whose create date falls within the selected time period.
  • Resolved Date: This option is valid for all modules. Instead of the Create date, the system uses the resolved date for filtering the data.
  • Closed Date: The closed date of a ticket or item is considered to check whether it falls within a specified period.
  • Last Updated Date: The Last updated date of a ticket or item is considered to check whether it falls within a specified period.
Description Description of the KPI.
Conditions A KPI is a counter that shows the number of times a condition(s) is satisfied. A condition is created using parameters. For example: Priority Equals to Low for a Request module will show the count of Requests with Priority Low for a specific time period.

Once done, click on Create to add the KPI under the KPI tab.

Creating a Widget

  • In the Add Widgets popup, select the Widgets tab.
Create Widget
Create Widget
  • Click on Create Widget on the top-right corner.
  • A dialog box opens. Enter the following details:
Widget Parameters
Widget Parameters
Parameter Description
Name Enter name of the widget.
Module Select the module based on which the data should be displayed.
Technician Access Level Select the technician name to whom you want to give the access of the widget.
Technician Group Access Level Select the technician group to whom you want to give the access of the widget.
Date Filter Select the date filter based on which the data should be displayed. It allows you to filter data using time. The options are:

  • Created Date: This option is valid for all modules. A Dashboard has a time filter using which the widget displays only those data points whose create date falls within the selected time period. For example, a Widget that shows the number of Assets added in a time period will consider the create date of each Asset.
  • Resolved Date: This option is valid for all modules. Instead of Create date, the system uses the resolved date for filtering the data.
  • Closed Date: The closed date of a ticket or item is considered to check whether it falls within a specified period.
  • Last Updated Date: The Last updated date of a ticket or item is considered to check whether it falls within a specified period.
Description Enter the details of the widget.
Conditions A widget graphically shows the count or average of data points categorically as a chart. Here, you can decide what data to use, using a condition(s) (filters). A condition is created using parameters. For example; SLA Violation Equals to True for Request module will show tickets that have violated the SLA resolution time for a specific time period. Filters can be made using multiple conditions all connected by logical operators: AND and OR. Conditions can be grouped together as well.
Charting Options Here, you can decide how to represent the filtered data.

  • The filter data will have parameters. You can choose any one to show on the X-axis. In the above diagram, the Priority parameter is selected to be represented on the X-axis.
  • The Y- axis holds functions. Here, the Count function to count Request tickets across priorities is used. The value Low for the parameter Priority is disabled.
  • Select the Visualization (Chart type). The options are: Bar Chart, Line Chart, and Column Chart.
  • Select the Sort Order from:
    Ascending: X-axis will be sorted (based on count) in ascending order.
    Descending: X-axis will be sorted (based on count) in descending order.

When done, click on Create to add the Widget.

Filtering Widget

Filters: The Time Filter is available for all Widgets. These include: Today, Last 7 Days, Last 15 Days, Last 30 Days, This Week, This Month, or also Custom.

Filter using Time Filter

Auto Refresh Interval

Auto Refresh: You can auto refresh the complete Dashboard at specific intervals. It includes the time frames from 5 minutes to 30 minutes. On selecting the desired time interval, the dashboard would get refreshed automatically by default.

Auto Refresh Filter
Auto Refresh Filter

Viewing Widget

Note: Only the Super Admin user can edit the predefined widgets (barring Shortcuts).

The user can view the definition of a KPI and Widget. But only an owner of a widget (KPI or Widget) can edit its definition.

  • Open a Dashboard.
  • You can view the definition of a KPI and Widget using the View Icon (eye).
View Widget
View Widget

Deleting Widget

Note: The predefined widgets cannot be deleted.

Owner of a custom widget (KPI or Widget) can delete it using the Delete Icon.

Delete Widget
Delete Widget

Other Options for Widget

You can view the particular widget in Full Screen as well as download the Widget in .png and .jpeg format. If you wish to view it in the form of a document you can export the widget to PDF, CSV, and XLS format as shown below:

Other Options for Widget