How to start a live tail?
Overview
The live tail feature enables you to access all your log events in real-time from any source in your infrastructure that is sending the logs to Motadata.
Live tail can be used to check if a new deployment in your environment went smoothly.
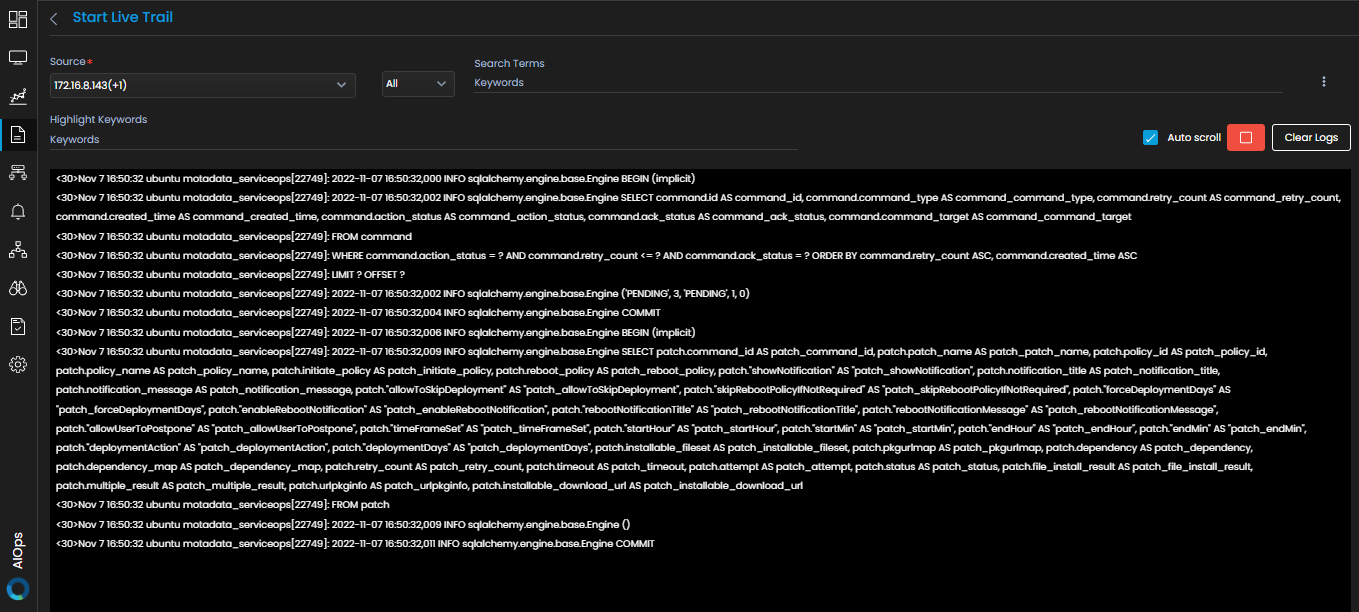
Use this feature to see a real-time feed of log events associated with a source. Live tail shows the real time log events in white text visible very clearly over black background making the logs very easy to read.
Navigation
Go to Menu, Select Log Explorer ![]() .After that, Select Start Live Tail
.After that, Select Start Live Tail ![]() . The screen to view the live tail is now displayed.
. The screen to view the live tail is now displayed.
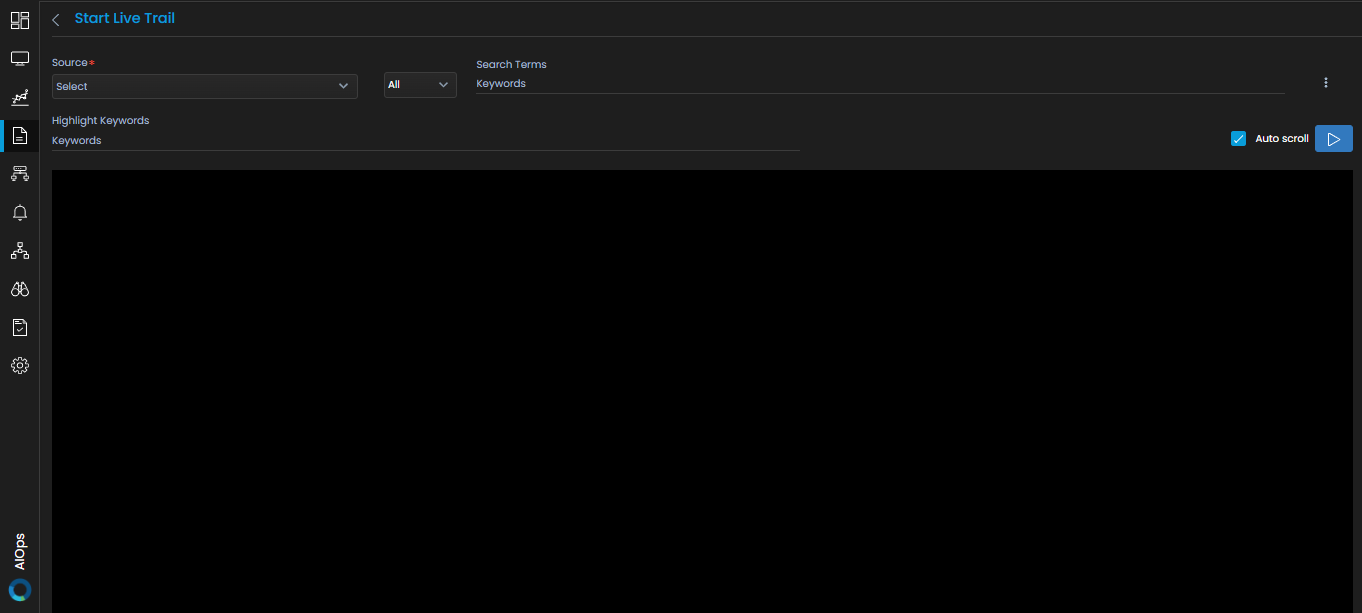
Enter the following details on the Live Tail screen:
| Source | Select the source of the log for which you want to view the live tail. | |
| Search Terms | Enter the keyword(s) that you wish to search for from the live tail. Once you have entered a search term, the live tail will only display the log events that have the keyword(s) you specified | |
| Highlight keywords | Enter the keyword(s) you wish to highlight from the live tail. The keyword(s) will be highlighted as shown in the diagram below. |
Options On The Live Tail Screen
| Auto Scroll | Select the check-box to enable auto scrolling of the live tail of log events. |
| Start streaming/Stop streaming |
|
| Clear Logs | Select this button to clear all the logs that have been generated on the screen via live tail. |
| More Actions | Select the
|