How to view and analyze the logs?
Overview
Once you have configured the logging source, the logs are then available in the log explorer for you to view and analyze. Log explorer acts as a comprehensive tool to analyze the logs and troubleshoot the issues, assess them quickly enabling you to fix the issues in your infrastructure.
Navigation
Go to Menu, Select Log Explorer ![]() . The Log explorer is now displayed.
. The Log explorer is now displayed.
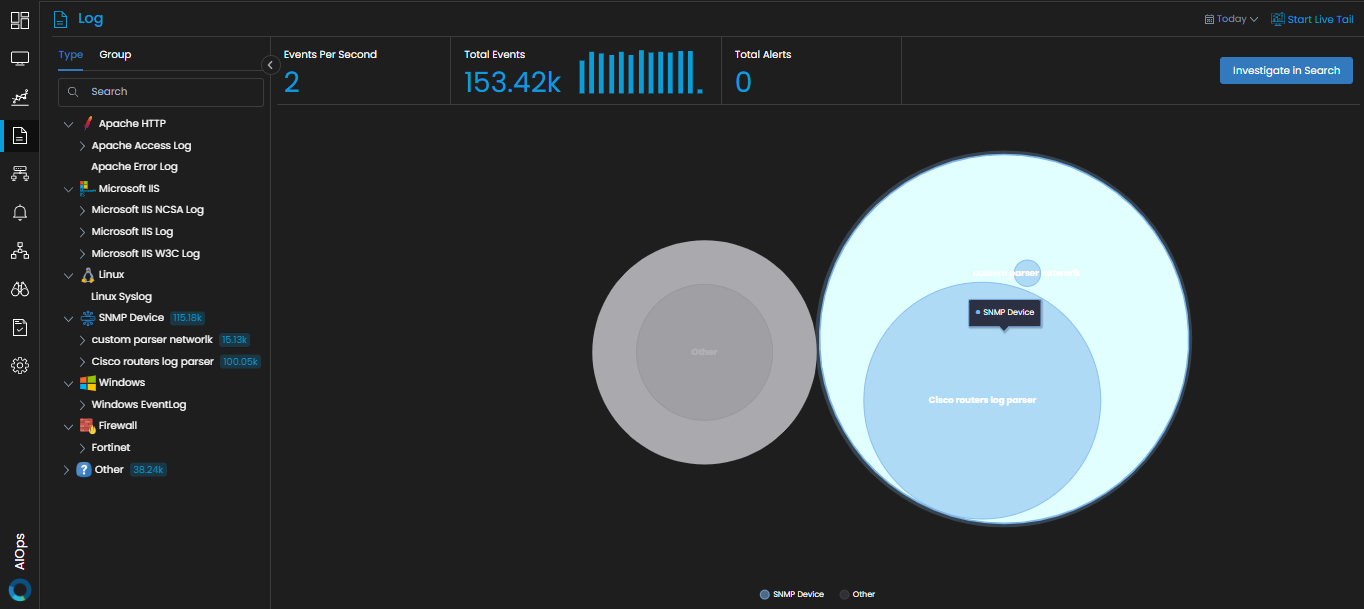
Intelligent categorization of logs
Log explorer classifies the logs in your infrastructure intelligently so that you can easily locate the logs you need.
This classification is done based on the Type and the Group of the logs in your infrastructure.
- TypeThe logs are classified based on the type of source of the logs, i.e., Platform, application, or the device from which the log is generated. For example, some of the categories are as follows: Linux, Windows, and Firewall.
- GroupThe logs are classified based on the category of logs they belong to. For example, some of the categories are as follows: Linux Syslog, Microsoft IIS Log, and Windows EventLog.
This categorization of logs is available in the log explorer on a panel beside the Main menu. You can click on any category under Type or Group based on your requirement to reveal the sub-category that might be present under it until you find the log source at the lowest level. You can select this log source to reveal the log details on the Log Search screen.