Motadata Docs

Monitor Settings

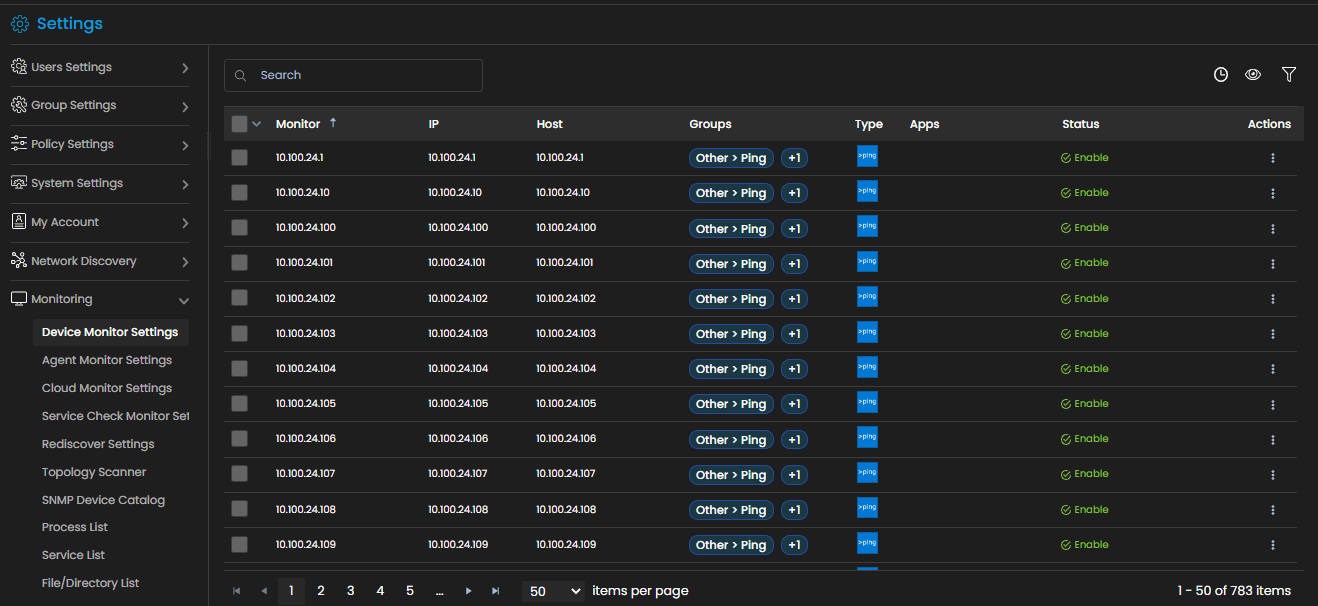
The Monitor settings in Motadata allows you to configure and manage the monitors, agents, processes and services that are discovered in the system. This page also allows configuring schedulers for rediscovery at a customized time, and configuring schedulers for a topology scan. The different settings for monitors that are available in Motadata are explained in this section in detail.

Go to the Main Menu, Select Settings . After that, go to Monitoring . The menu of monitoring settings is now displayed.

Device Monitor Settings

The list of all the Monitors in the infrastructure can be viewed under Device Monitor Settings. The monitors can be configured and managed from this interface.

Go to the Main Menu, Select Settings . After that, go to Monitoring . Select Device Monitor Settings. The list of all the monitors that are discovered in the system is now displayed.

The Device Monitor Settings interface displays the following details:

Monitor The name of the monitor.
IP The IP address of the monitor.
Host The hostname of the monitor, if available. The IP address is displayed in case the hostname is not present.
Groups The group under which the monitor is categorized.
Type The type of device based on the protocol of the corresponding credential profile.
Apps The application detected in a monitor after discovery.
Status The status of the monitor on the following basis.

  • Enable : The Monitor is switched ON for monitoring.
  • Disable : The Monitor is switched OFF for monitoring.
  • Maintenance : The Monitor is under Maintenance and it will not be monitored.
Actions Selecting displays permissible actions for the monitor.

  • Disable /Enable : This button is used to turn OFF/ON a monitor.
  • ON/OFF Maintenance : This button is used to switch the monitor maintenance status to ON/OFF.
  • Schedule Maintenance : This button is used to schedule the maintenance activity of a particular monitor in advance.
  • Metric Settings : This button is used to configure the metric polling configuration for each monitor.
  • Edit : This button is used to edit the Monitor details.
  • Delete : This button is used to delete a particular monitor from the Motadata system.

You can also use the bulk update option to make changes to multiple monitors at once.

Agent Monitor Settings

The list of all the agents in a network can be viewed under Agent Monitor Settings.The configuration and health status of the agents can be viewed from this interface.

Go to Menu, Select Settings . After that, go to Monitoring . Select Agent Monitor Settings. The list of all the agent monitors in the system is now displayed.

The Agent Monitor Settings interface displays the following details:

Monitor The name of the agent.
IP The IP address of the agent.
Health
Groups The group under which the monitor is categorized.
Type The type of device based on the protocol in the credential profile of the device.
State
Duration
Status The status of the monitor on the following basis.

  • Enable : The Monitor is switched ON for monitoring.
  • Disable : The Monitor is switched OFF for monitoring.
  • Maintenance : The Monitor is under Maintenance and it will not be monitored.
Version
Configuration
Actions Selectingdisplays permissible actions for the monitor

  • Export Agent Configuration

Cloud Monitor Settings

The list of all the monitors discovered from a cloud network can be viewed under Cloud Monitor Settings. The monitors can be configured and managed from this interface.

Go to Menu, Select Settings . After that, go to Monitoring . Select Cloud Monitor Settings. The list of all the monitors that belong to cloud network is now displayed.

The monitor settings interface displays the following details:

Monitor The name of the monitor.
Resource/Region
Account ID
Groups The group under which the monitor is categorized.
Type The type of device based on the protocol of the corresponding credential profile.
Status The status of the monitor on the following basis.

  • Enable : The Monitor is switched ON for monitoring.
  • Disable : The Monitor is switched OFF for monitoring.
  • Maintenance : The Monitor is under Maintenance and it will not be monitored.
Actions Selecting displays permissible actions for the monitor.

  • Disable /Enable : This button is used to turn OFF/ON a monitor.
  • ON/OFF Maintenance : This button is used to switch the monitor maintenance status to ON/OFF.
  • Schedule Maintenance : This button is used to schedule the maintenance activity of a particular monitor in advance.
  • Metric Settings : This button is used to configure the metric polling configuration for each monitor.
  • Edit : This button is used to edit the Monitor details.
  • Delete : This button is used to delete a particular monitor from the Motadata system.

You can also use the bulk update option to make changes to multiple monitors at once.

Service Check Monitor Settings

The list of all the service check monitors can be viewed under Service Check Monitor Settings. The monitors can be configured and managed from this interface.

Go to the Main Menu, Select Settings . After that, go to Monitoring . Select Service Check Monitor Settings. The list of all the service check monitors present in the system is now displayed.

The Service Check Interface interface displays the following details:

Monitor The name of the monitor.
Agent The name of the agent.
Type The type of device based on the protocol of the corresponding credential profile.
Groups The group under which the monitor is categorized.
Target The specific target for which you created the service check.
Status The status of the monitor on the following basis.

  • Enable : The Monitor is switched ON for monitoring.
  • Disable : The Monitor is switched OFF for monitoring.
  • Maintenance : The Monitor is under Maintenance and it will not be monitored.
Actions Selecting displays permissible actions for the monitor.

  • Disable /Enable : This button is used to turn OFF/ON a monitor.
  • ON/OFF Maintenance : This button is used to switch the monitor maintenance status to ON/OFF.
  • Schedule Maintenance : This button is used to schedule the maintenance activity of a particular monitor in advance.
  • Metric Settings : This button is used to configure the metric polling configuration for each monitor.
  • Edit : This button is used to edit the Monitor details.
  • Delete : This button is used to delete a particular monitor from the Motadata system.

You can also use the bulk update option to make changes to multiple monitors at once.