Motadata Docs

What is a Dashboard?

The modern IT infrastructure is complex and generates massive sets of data from multiple sources present in the infrastructure. Imagine all of this data at one place and unorganized. Would you be able to use this data effectively?

Would you rather have this data organized and presented you in a way that is not only easy on your eyes, visually stimulating but also presented effectively such that you are able to make efficient business decisions?

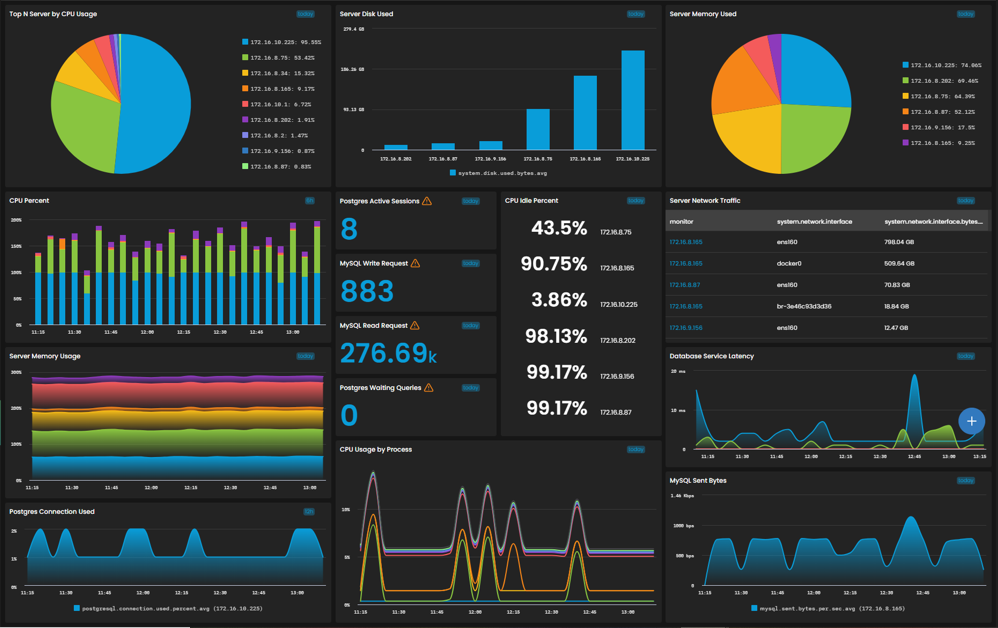
Look at the picture below. Even though the data here is presented in an organized manner, you are not able to make sense of the collected data and make business decisions simply based on raw data, whether organized or unorganized.

The data collected from the multiple sources in infrastructure needs to be presented in a manner that’s meaningful, and easy to understand such that it enables efficient decision making while enabling you to learn the state of your system and applications faster and allowing quick troubleshooting.

Now, let’s look at a couple of more images.

This image depicts a dashboard showing server details on widgets effective for visually tracking, analyzing, and displaying key performance metrics that enables you to learn the health status of your infrastructure in just a single glance.

The dashboard in Motadata consists of multiple widgets that can be selected, configured, and positioned on the go to best meet your requirement. The widgets display the data in the form of various graphs such as a pie chart, bar diagram, or sometimes even as a simple list, and so much more. Additional information can also be obtained by hovering the mouse cursor over the diagrams on the widget.

Motadata allows you to create customized dashboards and at the same time also provides multiple pre-configured dashboards to visualize the metrics that are most useful to the users. You can select a monitor from any of the widgets on the dashboard to view details related to that monitor.

Using Motadata dashboards you can:

  • Get insights about your infrastructure health with easy-on-the-eye graphical visualizations.
  • View and contextualize data at specified times with the zoom-in functionality available in graphs.
  • View historical metric data on dashboards by changing the time interval for data as per your requirement.
  • Move the widgets on the dashboards by simple drag and drop of the widgets.
  • Resize the widgets easily as per your requirement using your mouse.
  • Take snapshots of all the widgets in your dashboard to determine the state of your infrastructure at any particular instant.
  • View every widget present on the dashboard on a full screen.
  • Share widgets with multiple people over e-mail all at once.
  • Clone the whole dashboard or clone a widget under the same dashboard.
  • Hover over certain elements on the widgets to view more details regarding that particular widget.

On this Page