Metric Plugins
Overview
Motadata provides a set of in-built metric plugins to read certain parameters from monitors and define them as metrics in Motadata. These plugins facilitate Motadata to understand how certain metrics are defined. This mapping of metrics is achieved through these in-built metric plugins and then the values of these metrics are later on retrieved while polling data from monitors.
You can also create new metric plugins to define metrics in Motadata that are not defined by the standard in-built plugins. This would generally include devices like UPS, Printer, NAS and metrics like Power Consumption, Fan RPM, and Temperature.
You can create new plugins and manage the existing ones through a Metric plugin management screen. You can view and manage the plugins on this screen.
Go to Menu, Select Settings ![]() . After that, Go to Plugin Library
. After that, Go to Plugin Library ![]() . Select Metric. The Metric plugin screen is displayed.
. Select Metric. The Metric plugin screen is displayed.
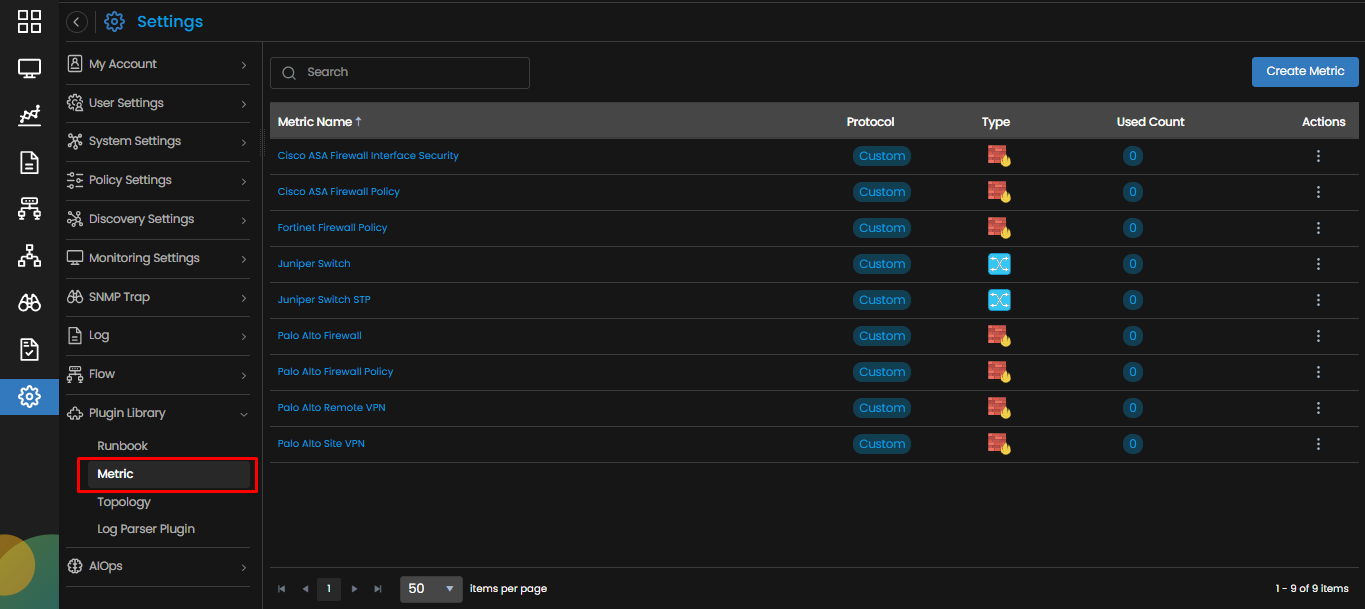
The following fields are then displayed on the screen:
| Metric Name | The name given to identify a metric plugin. |
| Protocol | Indicates the communication protocol the plugin is using. |
| Type | Indicates the monitor type on which the metric plugin will run. |
| Used Count | indicates the number of monitors using the plugin. |
| Actions | Selecting the icon displays permissible actions for each Topology plugin. The following actions are available for each plugin:
|