Log Search
Navigation
Go to Menu, Select Log Explorer ![]() . After that, select
. After that, select ![]() . The screen to search and view the log details is now displayed.
. The screen to search and view the log details is now displayed.
Go to Menu, Select Log Explorer ![]() . After that, select
. After that, select ![]() . The screen to search and view the log details is now displayed.
. The screen to search and view the log details is now displayed.
The log search feature enables you to narrow down to the exact log event that you wish to view and analyze. You can set a pre-filter condition to filter out the log data to the values you desire to view. Select ![]() to set the filter condition as per your requirement.
to set the filter condition as per your requirement.
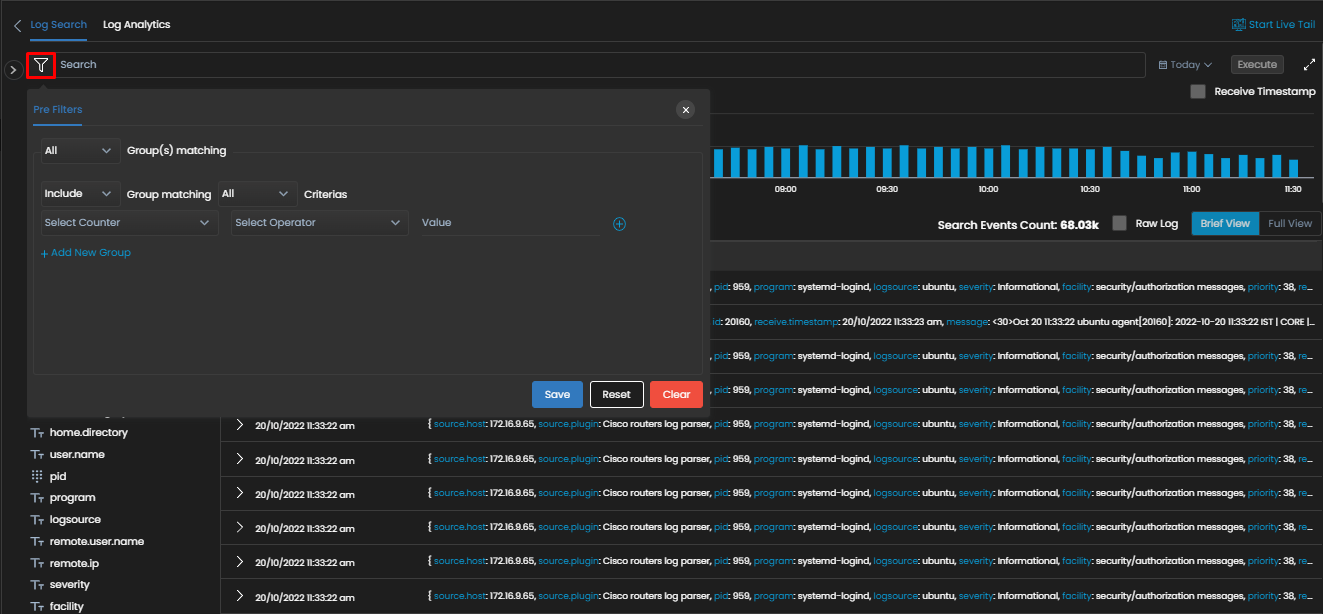
For example, you can set a filter condition to view all the logs from a particular source host for a specific time period by providing appropriate filter conditions. You can then view and analyze the log events you have searched.

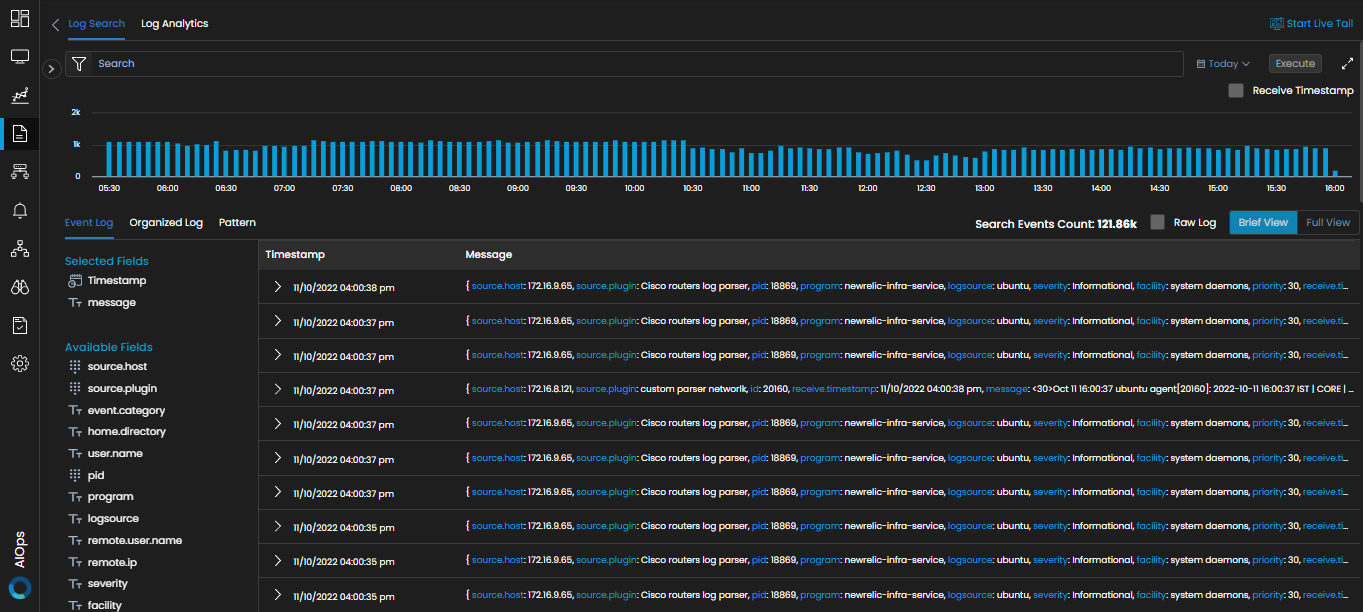
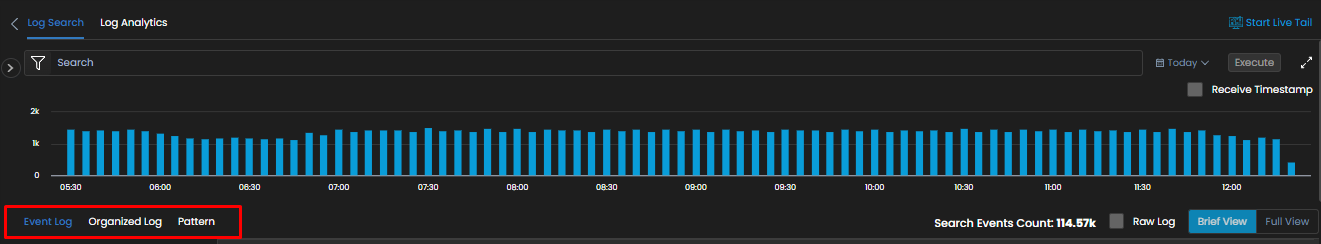
The bar graph at the top of the Log Search screen represents the count of log events received at various times during the day. You can move the cursor over each instance of time in the bar graph to get more details about the log event.
To understand other elements of the log search, navigate to the list of tabs present below the bar graph. Select Event Log to start with.
This tab enables you to view the details of the live log events in your infrastructure.
The timestamp of the log events and the message associated with the event are displayed on this tab by default. You can add more fields from the list of available fields to view the details of that field for each log event. Suppose you want to view the log message along with the host generating these messages, you can simply add the source.host field from the list of Available Fields to the list of Selected Fields.
Go to the list of Available Fields. Hover the mouse cursor over the field that you want to add in the Event Log. Select ![]() present beside the field. This would move the field from the list of Available Fields to the list of Selected Fields.
present beside the field. This would move the field from the list of Available Fields to the list of Selected Fields.
Select the Raw Log checkbox to show the unparsed version of logs in the Message column as received in Motadata AIOps.
This tab shows all the parsed data from logs in an organized manner. For each log event, the details of all the available fields are shown in a tabular manner. This view helps us to skim through the log event data and gather the relevant information easily with just a single view.
Other key elements available on the log search screen are as follows: