OBSERVEOPS
Hybrid Infrastructure Monitoring
From servers to services, from cloud to containers, assuring visibility, performance, and continuity across your hybrid ecosystem.
Motadata ObserveOps Hybrid Infrastructure Monitoring provides unified visibility across physical, virtual, and cloud-native environments. Monitor servers, applications, databases, storage, and containers — all from a single intelligent platform. Powered by AI-driven analytics, automation, and correlation, ObserveOps transforms complex infrastructure into a single, performance-assured ecosystem.
Core Features
Built for Scale, Visibility, and Performance
Hybrid infrastructure monitoring that unifies compute, storage, cloud, and services into one intelligent view — giving you complete control over performance, capacity, and continuity.
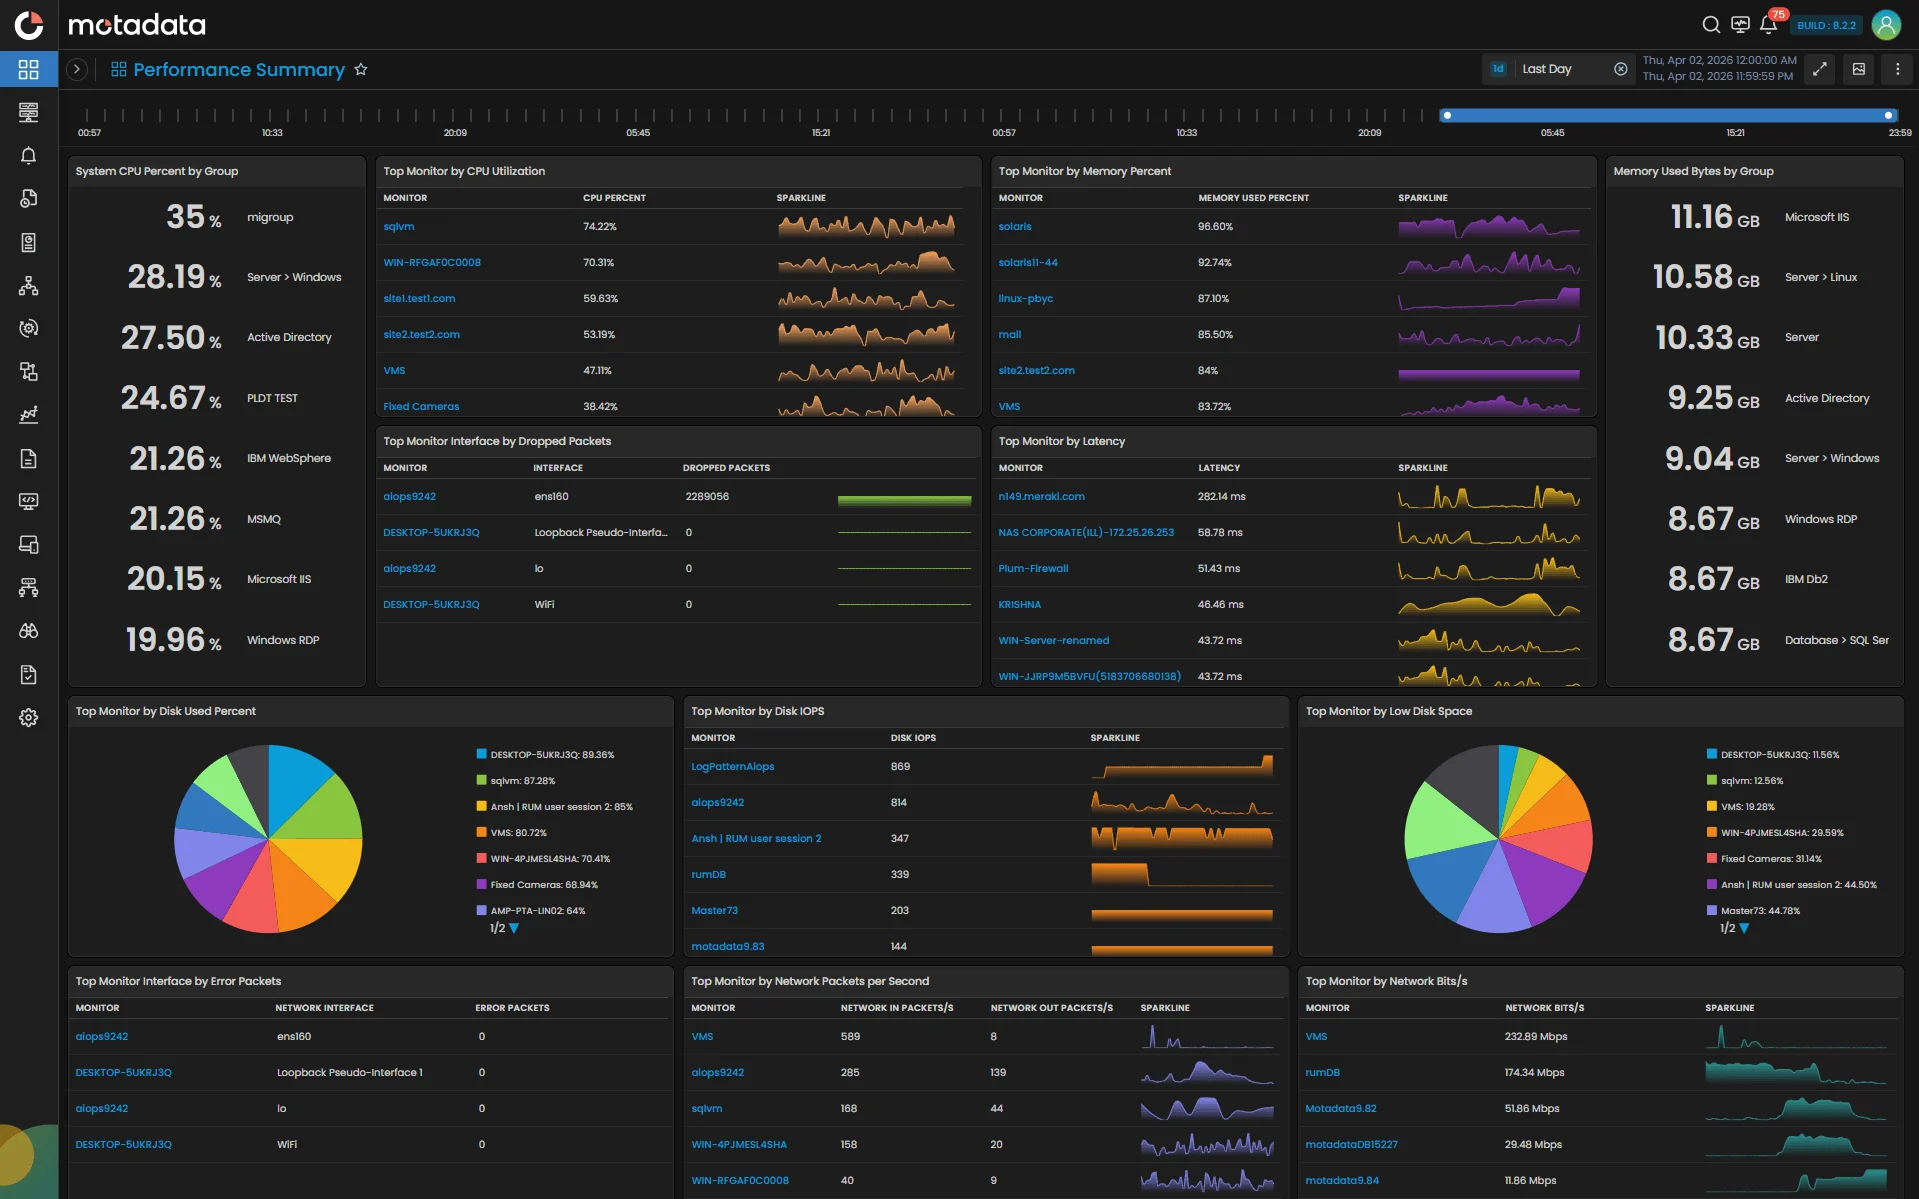
Full-Stack Infrastructure Visibility
Monitor servers, virtualization, containers, cloud, and storage from a single platform with complete operational clarity.
Hybrid & Multi-Cloud Readiness
Seamlessly observe on-premises, private cloud, and public cloud environments across AWS, Azure, GCP, and beyond.
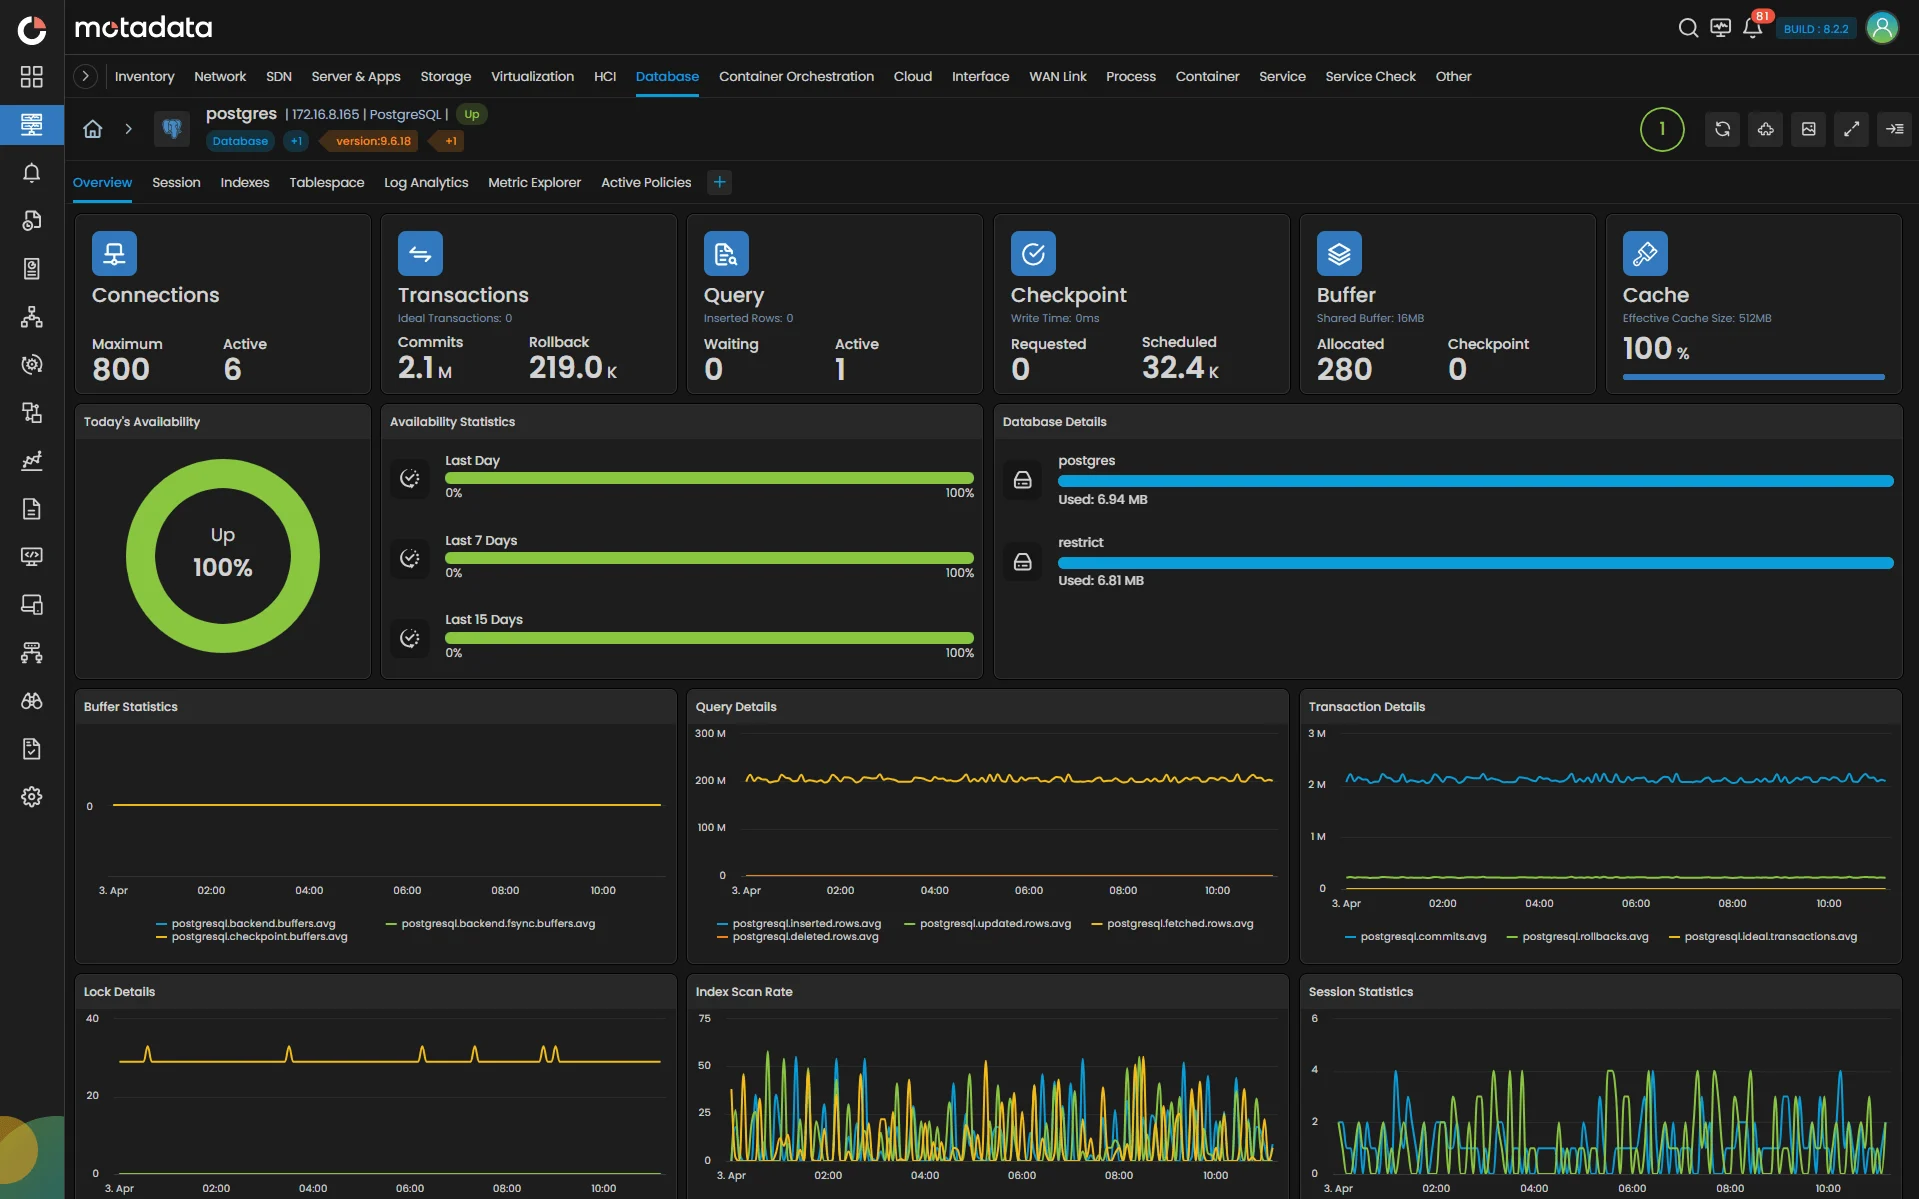
Application & Service Awareness
Track application performance, database health, and critical service availability in the context of underlying infrastructure.
Capacity & Resource Intelligence
Analyze utilization trends and forecast capacity to prevent bottlenecks and optimize infrastructure investments.
AI-Driven Performance Insights
Detect anomalies, identify degradation patterns, and anticipate issues with intelligent baselines and predictive analytics.
Unified Monitoring & Automation
Correlate metrics across systems and automate responses to reduce manual effort and accelerate incident resolution.
Every System. Every Workload. Complete Infrastructure Clarity.
Capabilities
Infrastructure Monitoring Capabilities
Complete Hybrid Infrastructure Intelligence
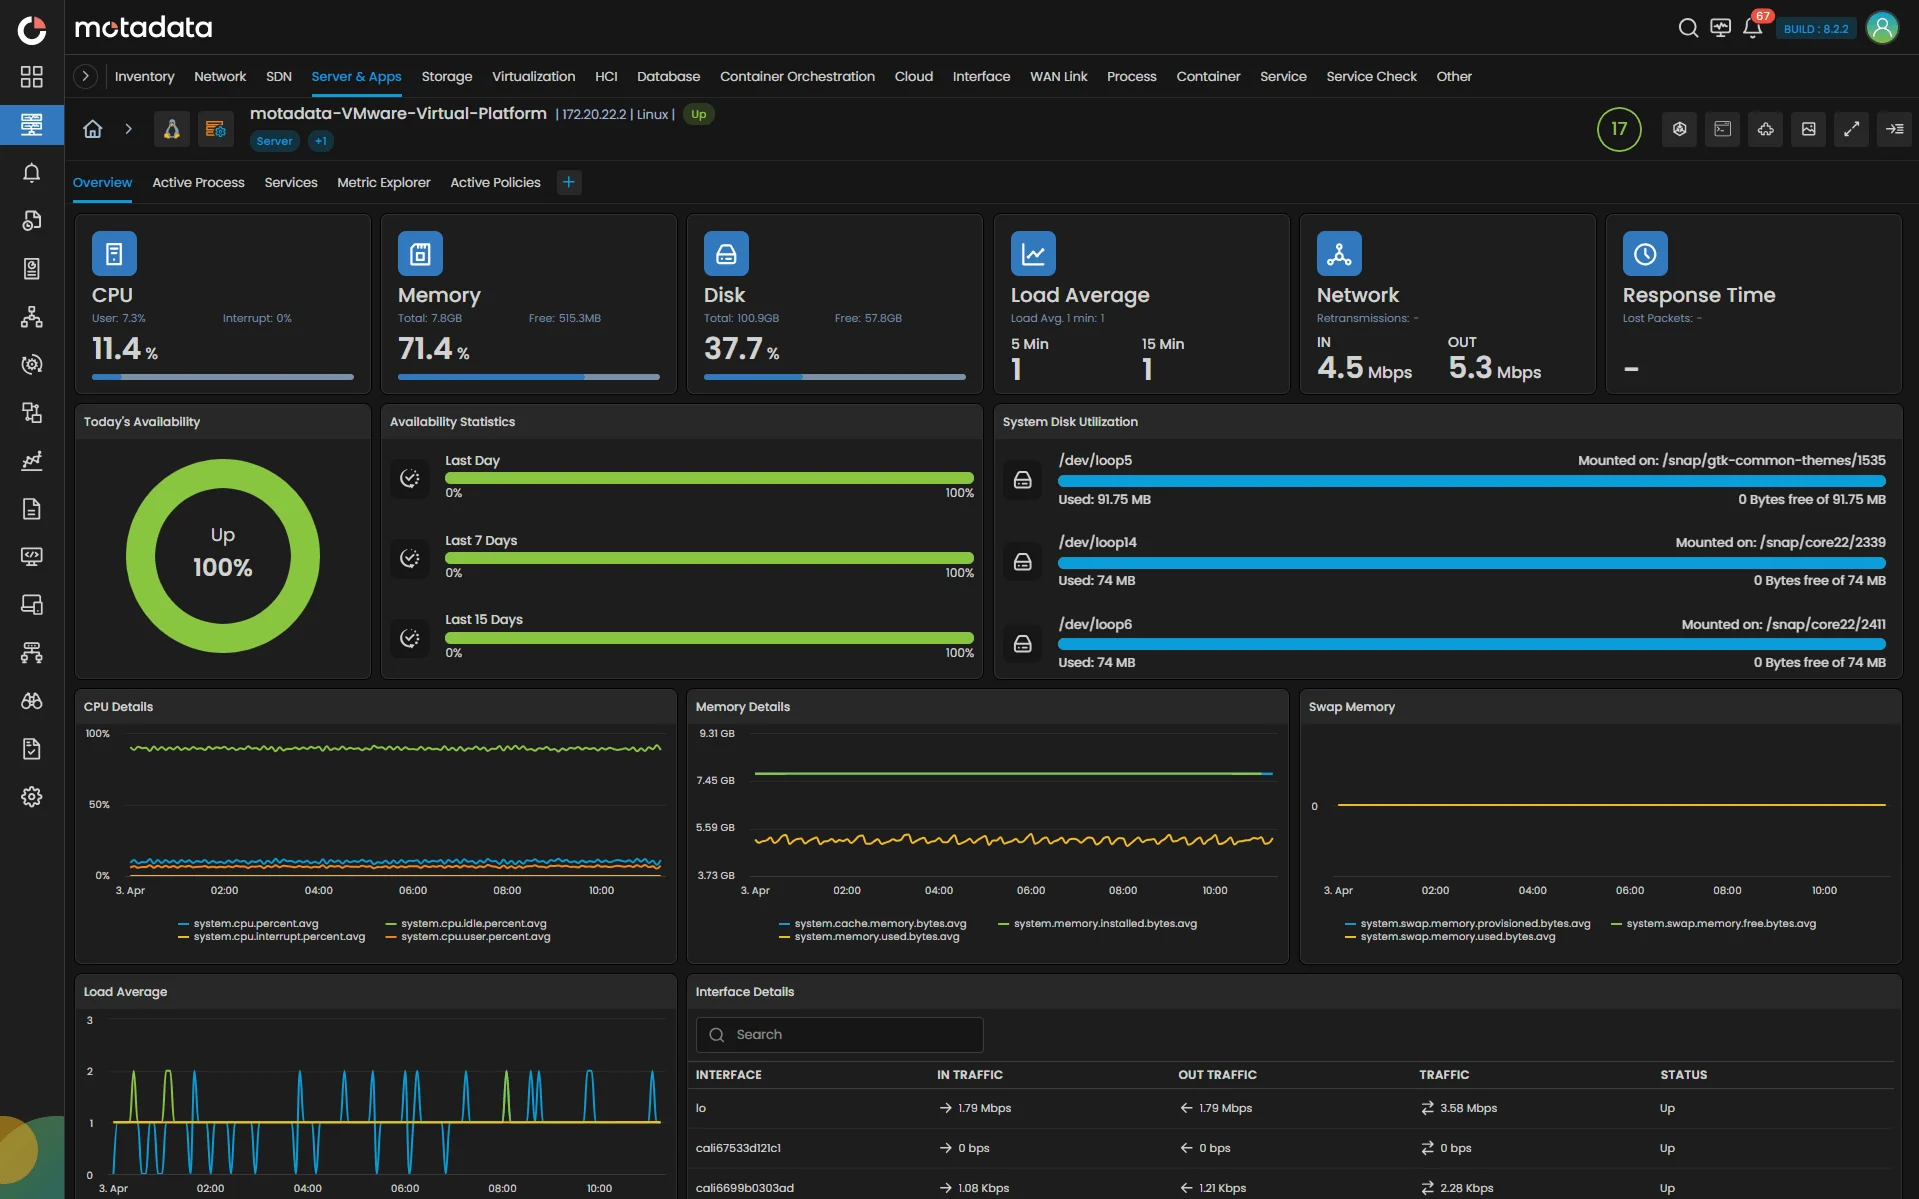
Monitor physical servers, virtualized and hyper-converged systems with unified health, utilization, and performance intelligence.
Key Highlights
Cross-OS Coverage: Real-time tracking of CPU, memory, processes, and services across Windows, Linux, and Unix.
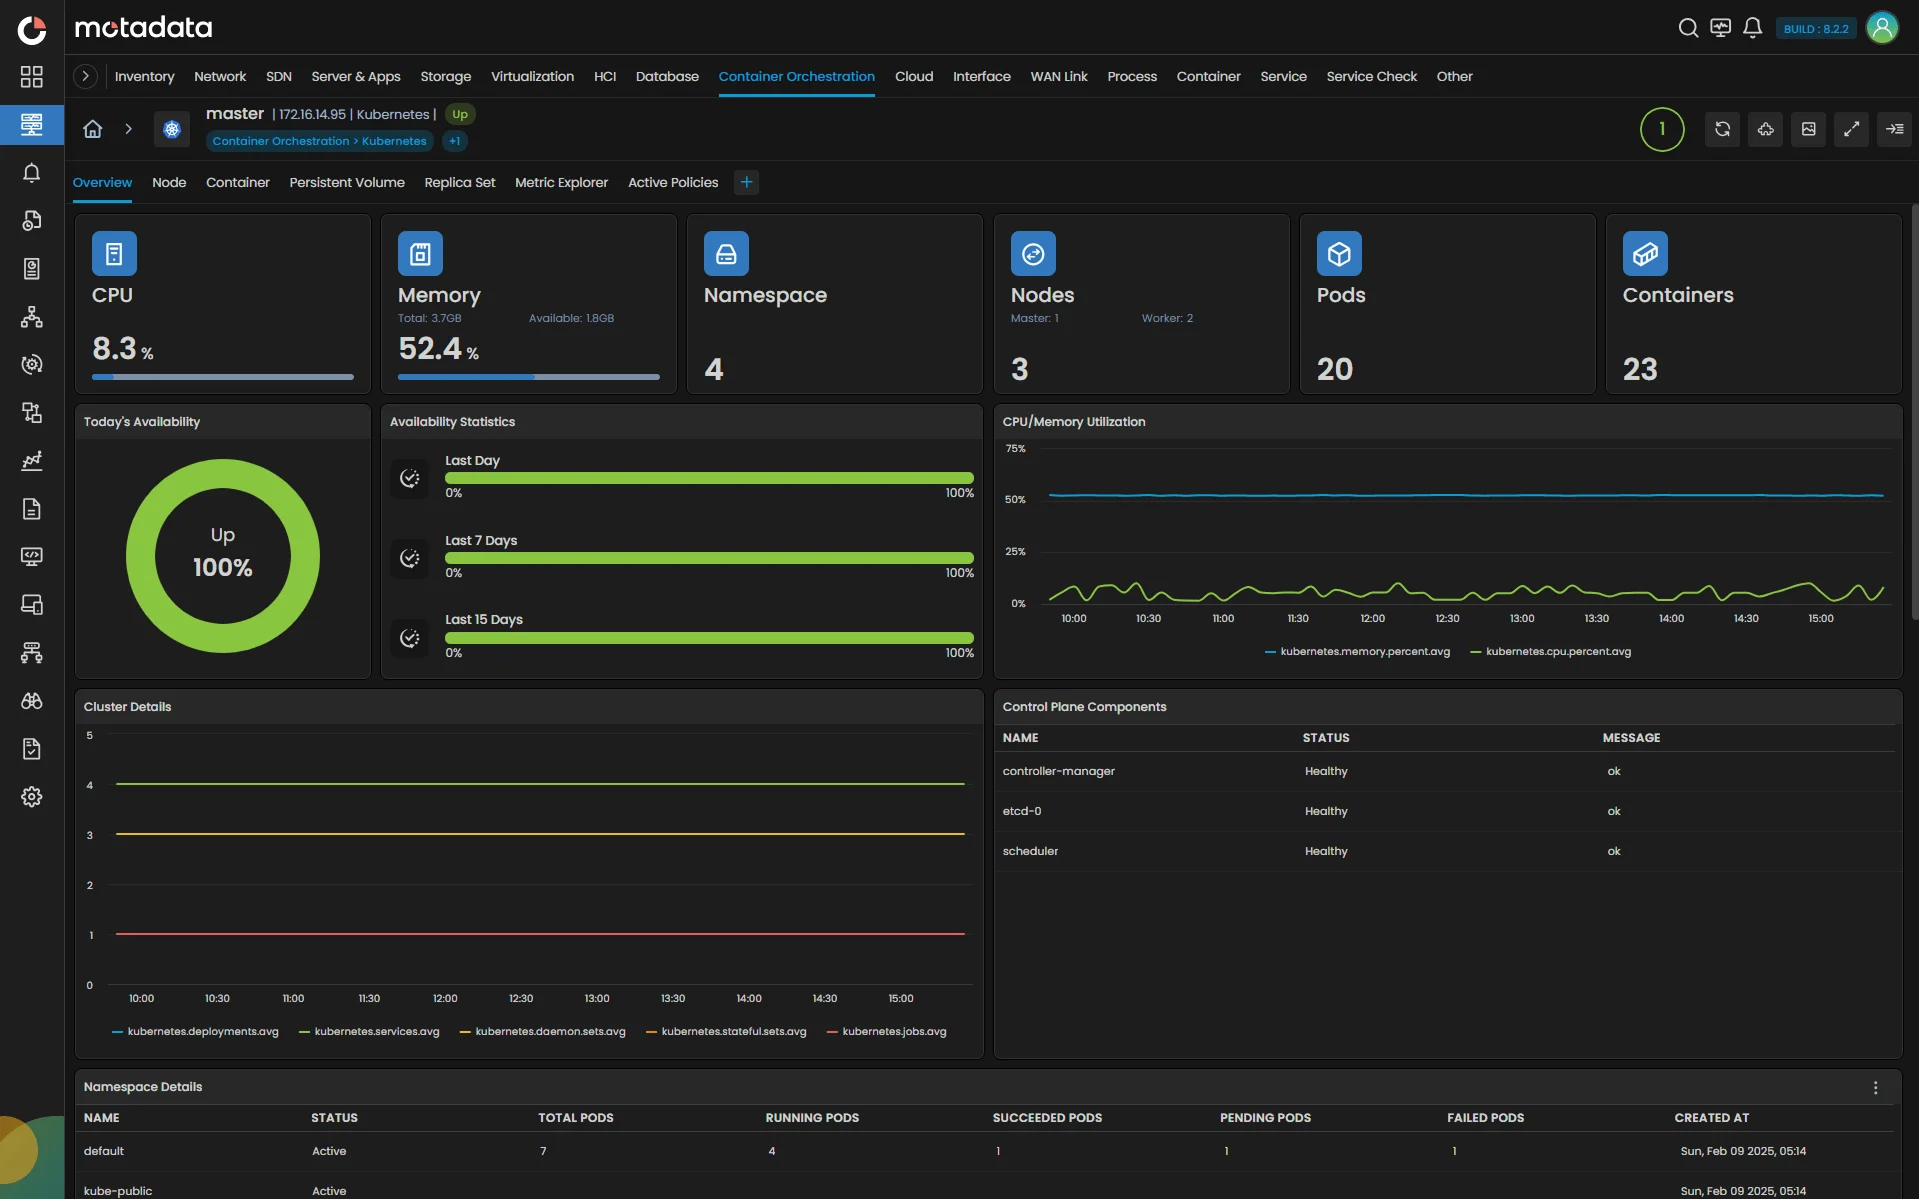
Virtualization Support: Native coverage for VMware, Hyper-V, Citrix, and HCI stacks like Nutanix.
Unified Monitoring Templates: Per-technology templates, customizable for organizational standards.
Discovery and SLA Dashboards: Auto-discovery, dependency correlation, and SLA-linked performance dashboards.
Every Core Counted. Every System Accounted.
Metrics & Differentiation
0%
Faster root-cause correlation with unified telemetry and AI-driven context
0%
increase in resource utilization efficiency through capacity forecasting
0%
Cost Savings From platform consolidation
0%
uptime reliability maintained across hybrid and multi-cloud workloads
Why Motadata
Why Motadata Leads
From Infrastructure to Intelligence — Motadata Powers Unified Performance.
Motastore at the Core
Unified telemetry ingestion for metrics, logs, and traces at scale.
AI-Native Correlation
Predictive intelligence that connects infrastructure, apps, and cloud.
Technology-Agnostic Coverage
From mainframes to Kubernetes, everything observed, nothing missed.
Runbook-Integrated Automation
Remediate, recover, and optimize without manual effort.
Template-Driven Scalability
1,000+ pre-built monitors and custom templates per technology.
Enterprise Ready
Unified Visibility for a Hybrid, High-Velocity Enterprise
One platform to understand every system, every workload, and every environment — delivering clarity that scales, intelligence that adapts, and performance that endures.
Full-Stack Insight Across Hybrid & Multi-Cloud Environments
Enterprises run workloads be it datacenters, private cloud, public cloud, containers, Kubernetes, and converged systems. Motadata delivers unified insight across all of them, eliminating visibility gaps that create operational risk. IT Directors and SRE Leaders gain a single, authoritative view of every layer, regardless of where or how it runs.
Enterprises run workloads be it datacenters, private cloud, public cloud, containers, Kubernetes, and converged systems. Motadata delivers unified insight across all of them, eliminating visibility gaps that create operational risk. IT Directors and SRE Leaders gain a single, authoritative view of every layer, regardless of where or how it runs.
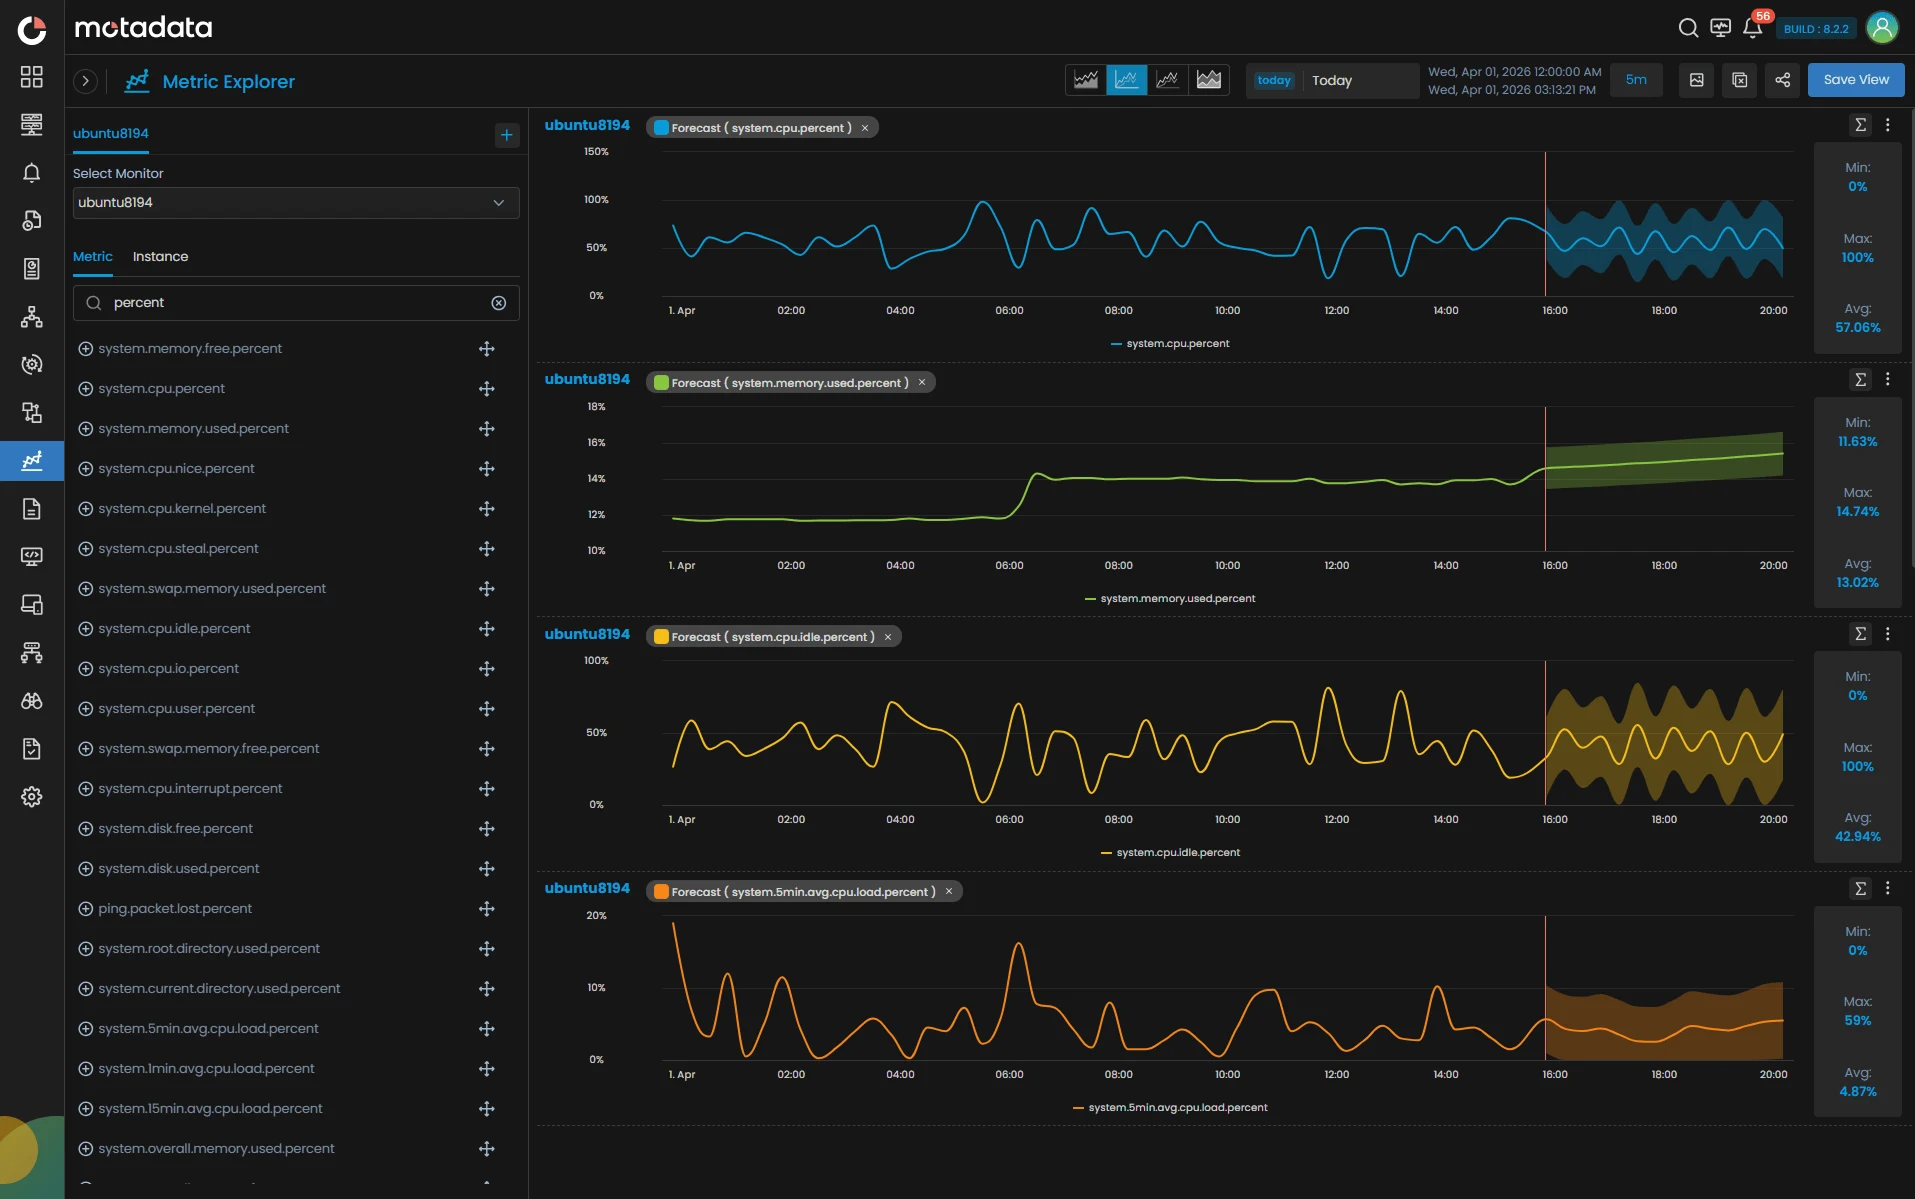
Predictive Intelligence for Capacity & Performance Planning
Modern infrastructure must anticipate demand, not react to it. Motadata’s AI-based forecasting highlights capacity saturation, resource drift, and performance risks long before users notice them. CIOs gain strategic foresight, enabling proactive investment planning and prevention of service degradation.
Modern infrastructure must anticipate demand, not react to it. Motadata’s AI-based forecasting highlights capacity saturation, resource drift, and performance risks long before users notice them. CIOs gain strategic foresight, enabling proactive investment planning and prevention of service degradation.
Vendor-Neutral Coverage for Complex Enterprise Ecosystems
Large organizations rely on a diverse mix of technologies — legacy servers, virtualized environments, HCI, SAN/NAS storage, multiple clouds, and container orchestration. Motadata supports them all with vendor-agnostic depth: Dell EMC, HPE, Hitachi, Huawei, NetApp, VMware, Nutanix, Hyper-V, Kubernetes and more. This gives enterprises freedom to evolve their architecture without losing observability continuity.
Large organizations rely on a diverse mix of technologies — legacy servers, virtualized environments, HCI, SAN/NAS storage, multiple clouds, and container orchestration. Motadata supports them all with vendor-agnostic depth: Dell EMC, HPE, Hitachi, Huawei, NetApp, VMware, Nutanix, Hyper-V, Kubernetes and more. This gives enterprises freedom to evolve their architecture without losing observability continuity.
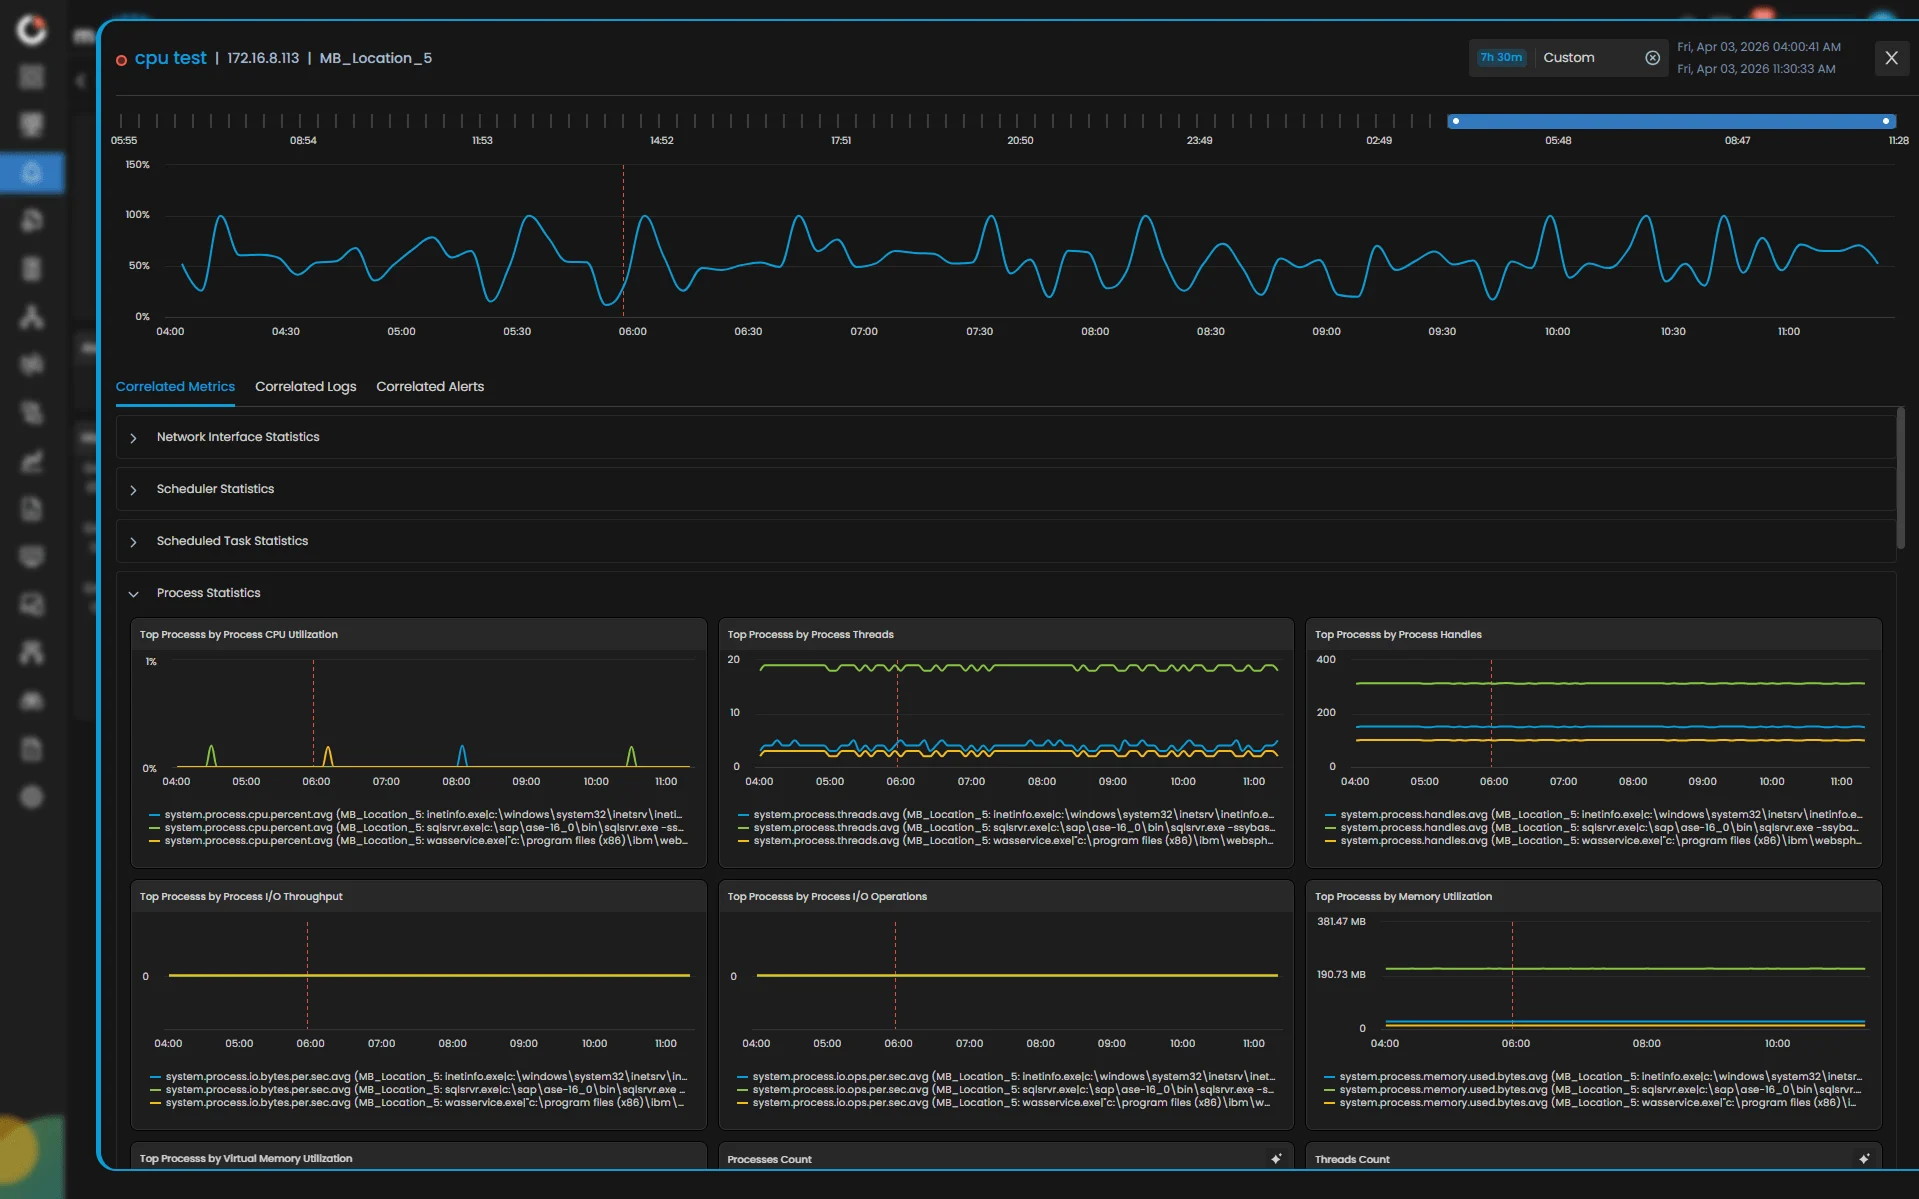
Automation & Correlation for High-Efficiency Operations
Hybrid environments generate noise without context. Motadata applies correlation across metrics, logs, traces, storage, cloud and compute, then uses runbook automation to resolve recurring issues autonomously. NOC teams reduce toil, incidents resolve faster, and operations scale without scaling effort.
Hybrid environments generate noise without context. Motadata applies correlation across metrics, logs, traces, storage, cloud and compute, then uses runbook automation to resolve recurring issues autonomously. NOC teams reduce toil, incidents resolve faster, and operations scale without scaling effort.
Industry Solutions
Industry-Proven Infrastructure Solutions
Tailored for Your Infrastructure Challenges
BFSI
Guarantee real-time visibility across trading, core banking, and digital payments — ensuring compliance, security, and always-on service.
Telecom
Monitor multi-gigabit networks, correlate NetFlow data with subscriber QoE, and prevent outages before they scale.
Healthcare
Safeguard critical patient systems and comply with HIPAA through secure, low-latency observability.
Government & Public Sector
Achieve transparency, security, and control with on-premise observability supporting strict data sovereignty.
Manufacturing
Integrate IT and OT data to prevent production downtime and improve predictive maintenance accuracy.
Retail & eCommerce
Deliver frictionless digital experiences, monitor transactions in real time, and optimize site reliability at global scale.
ObserveOps Platform
Continue Your ObserveOps Journey
Unify every signal. Correlate every insight. Perform without compromise.
Network Observability
Unite flows, packets, and paths into real-time clarity with intelligent alerting at scale.
Network Configuration & Compliance Management
Automated config backups, compliance checks, and drift detection across your network.
Hybrid Infrastructure Monitoring
Monitor on-premise, cloud, and hybrid environments with unified visibility, AI-driven alerts, and real-time insights.
Log Monitoring
Cut through endless logs to reveal root cause with search, correlation, and analytics.
Application Performance Monitoring
Trace every transaction from frontend to backend with distributed tracing and service mapping.
Real User Monitoring
Capture every click and page load with web vitals, experience scores, and session replay.
FAQ
Frequently Asked Questions
Find answers to common questions about Infrastructure Monitoring and our capabilities.
Hybrid Infrastructure Monitoring is the practice of tracking the health, performance, and availability of IT resources spread across on-premises data centers, private clouds, and public cloud environments — all from a single unified platform. It gives IT teams complete visibility into servers, VMs, containers, storage, and network devices regardless of where they are hosted.
From Server to Cloud — Start Observing What Drives Business.
Gain full-stack visibility, predictive analytics, and automation across hybrid IT with Motadata ObserveOps. Monitor. Correlate. Optimize — all from one intelligent platform.
ObserveOps Hybrid Infrastructure Monitoring — Where Reliability Meets Intelligence.