Motadata Docs

Gantt Chart

What is Gantt chart?

A Gantt chart is a bar chart which provides a visual view of tasks scheduled over time. A Gantt chart is used for planning projects of all volumes, and it is a useful way of showing the work which is scheduled to be done on a specific decided day. It can also help you to view the start and end dates of a project in one simple chart.

On a Gantt chart you can easily view:

  • Start date of project
  • Project tasks
  • Person working on task
  • Tasks start and finish time
  • Tasks grouped, overlapped, and linked
  • End date of project

Uses of Gantt Chart

The Gantt chart is used to view the following details:

  1. Various associated tasks.
  2. Beginning or ending of each activity.
  3. Duration of each activity.
  4. Completion statistics.
  5. Start and end date of the whole project with week-wise distribution.
Gantt View
Gantt View

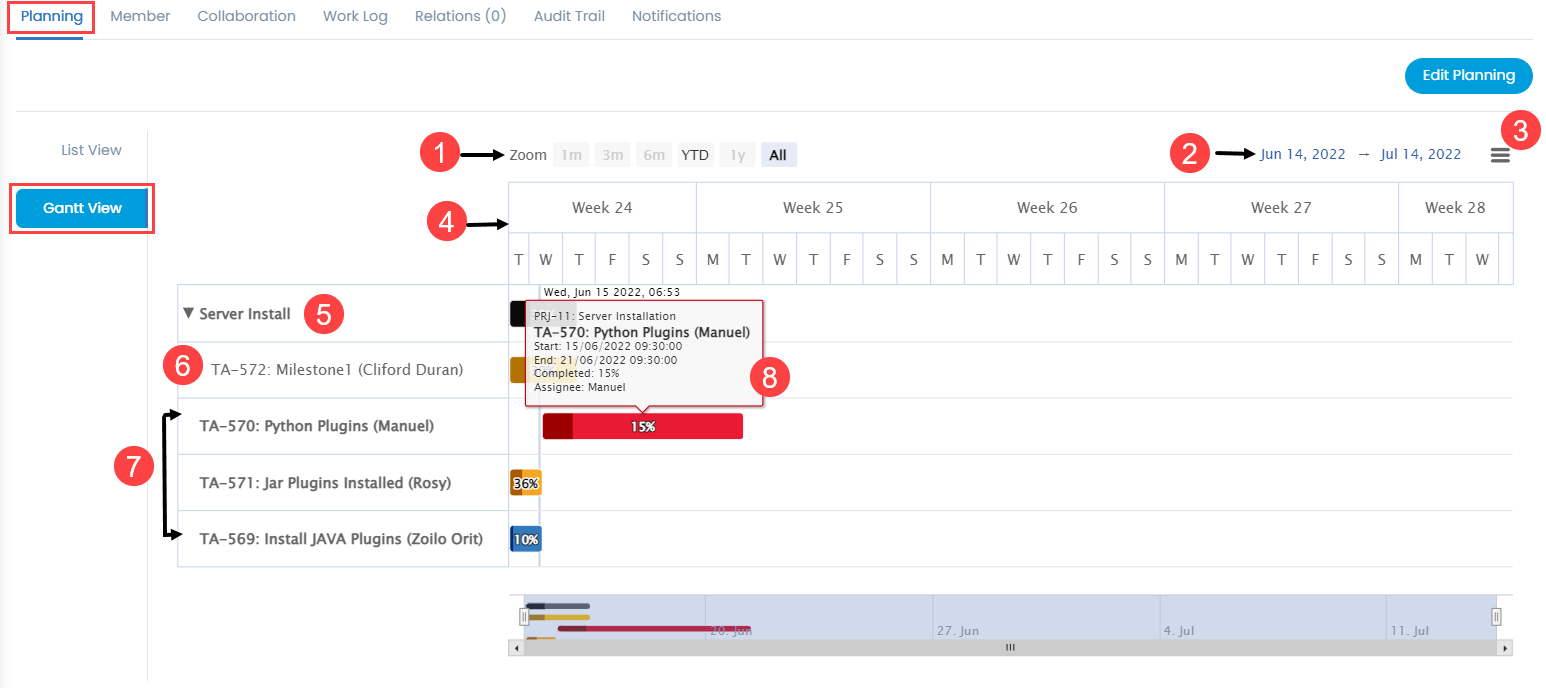
The Gantt View tab displays the project details in the form of a Gantt chart. It displays the details for a month by default.

The bars on the Gantt chart are displayed as per the color selected for that task. To set the color, refer the link Planning a Project. Also, Completed(%) is highlighted on the task bar.

The details and features available on the chart are:

  1. Zoom: You can zoom to view the details of 1 month, 3 months, 6 months, Year to Date (YTD), 1 year, and All.
  2. Date Range: Select the date range based on which the details should be displayed. By default, 1 month duration is selected.
  3. Chart Context Menu: Click on the menu icon to use any of the below options:
    • View in full screen
    • Print chart
    • Download PNG image
    • Download JPEG image
    • Download PDF document
    • Download SVG vector image
    • Download CSV
    • Download XLS
    • View data table
  4. Week-wise details: Displays the project details week-wise.
  5. Summary Task: Displays the Summary task in black color along with its completion percentage.
  6. Milestone: Displays the milestone along with its completion percentage.
  7. Tasks: Displays the tasks along with their completion details
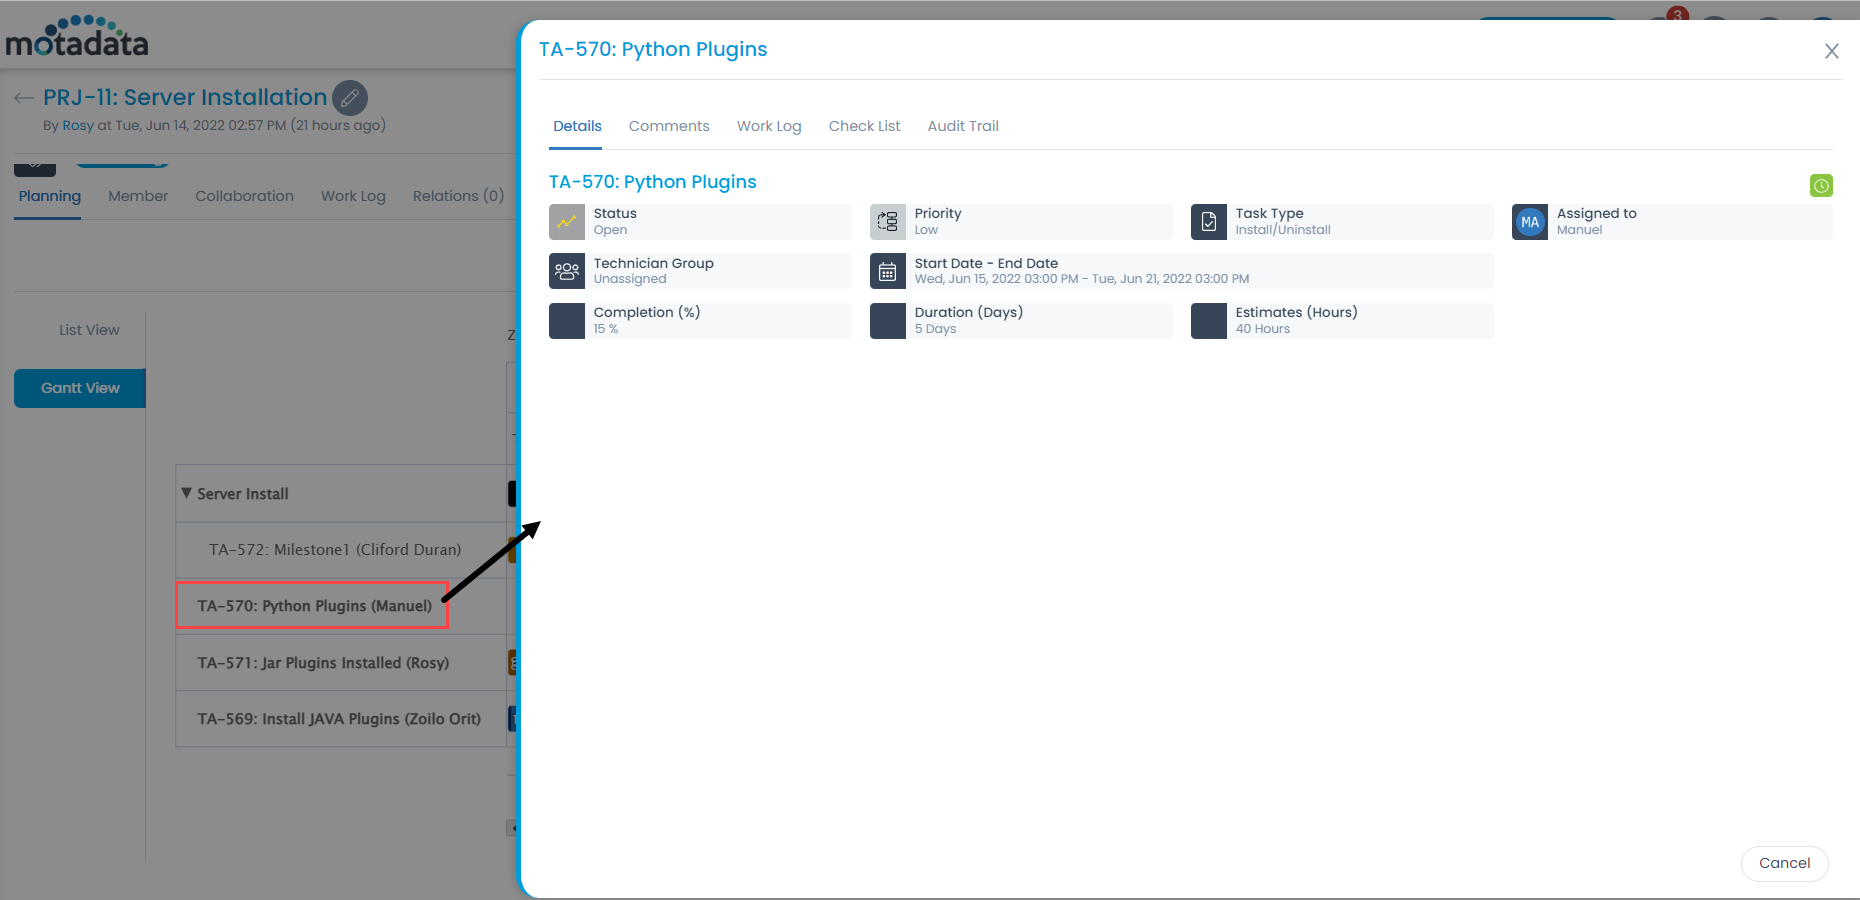
  8. Details: Displays the details on hovering the mouse over the bar. The details are: Project ID, Task ID, Start and End Date, Completed %, and Assignee. If clicked on the bar, a popup appears displaying the additional details about the task or milestone as shown below. For more details, refer to the section Update Task.
Details Page
Details Page