Flow Explorer
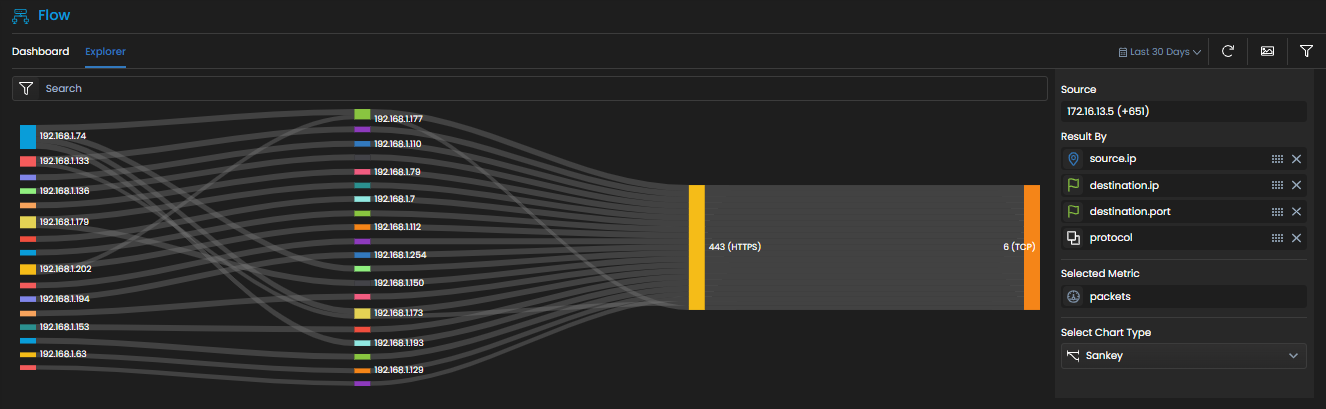
Flow explorer is a tool that enables you to graphically visualize the flow data for all the devices sending flow to Motadata AIOps server. Flow explorer provides consistent visibility into your network allowing you to judge essential infrastructural requirements, make business-driven decisions, and ensure efficient and cost-effective operations based on the network flow data presented to you.
Navigation
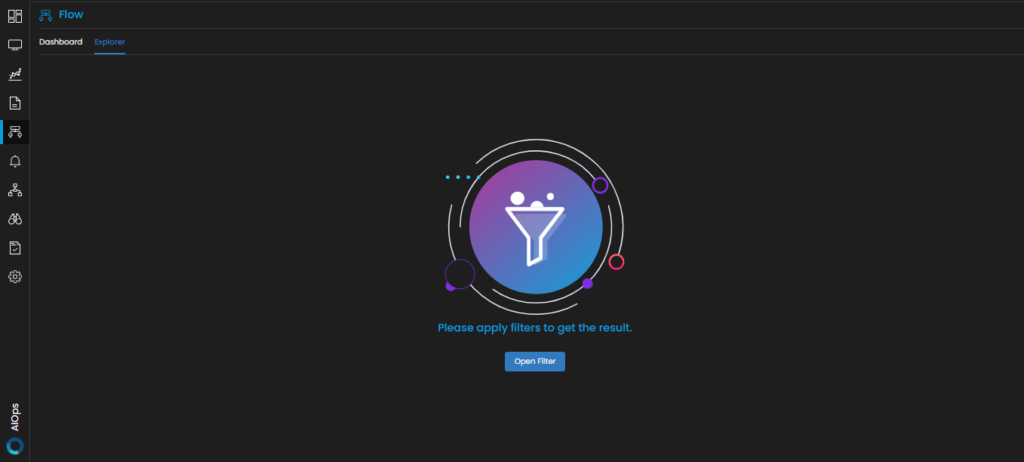
Go to Menu, Select Flow Explorer ![]() . After that, Select Explorer. The Flow Explorer tool is now displayed.
. After that, Select Explorer. The Flow Explorer tool is now displayed.