All Features
Network Observability
Network Performance Monitoring
Network performance monitoring is the continuous measurement of latency, packet loss, jitter, throughput and device health across a network so teams can find and fix degradation before users notice it. Motadata ObserveOps puts all of it in one console, from a router's CPU load to a WAN link's jitter, and alerts you when any metric drifts from its normal range.
What Is Network Performance Monitoring?
Network performance monitoring tells you how well your network is working, not just whether it is up. A link can be up and still drop packets. A router can answer every ping and still be pinned at full CPU.
Monitoring is the measuring part. Network performance management is the wider practice of acting on those measurements: tuning routes, adding capacity and fixing configuration. ObserveOps supports both, from the first metric collected to the alert, the ticket and the report.
Which Network Performance Metrics Should You Track?
Start with the metrics below. Together they cover whether a device is reachable, how fast traffic moves and where it gets lost. For a deeper look at each one, read our guide to network performance metrics.
Metric | What It Tells You | How ObserveOps Collects It |
Availability | Whether a device or interface is up, down or unreachable. | Ping checks and SNMP interface status |
Response time | How long a device takes to answer, as round-trip time. | Ping (minimum, maximum and average) |
Latency | The delay between two points, in each direction. | IP SLA WAN link probes on supported devices |
Jitter | How much that delay varies, which matters most for voice and video. | IP SLA ICMP Jitter probe |
Packet loss | The share of packets that never arrive. | Ping and IP SLA |
Throughput | How much data an interface actually moves. | SNMP interface counters |
Utilization | How full each link is, inbound and outbound, against its speed. | SNMP interface counters |
CPU and memory | Whether a device has the headroom to forward traffic. | SNMP |
Errors and discards | Packets an interface rejected or dropped, often from a bad cable, duplex mismatch or full buffer. | SNMP interface counters |
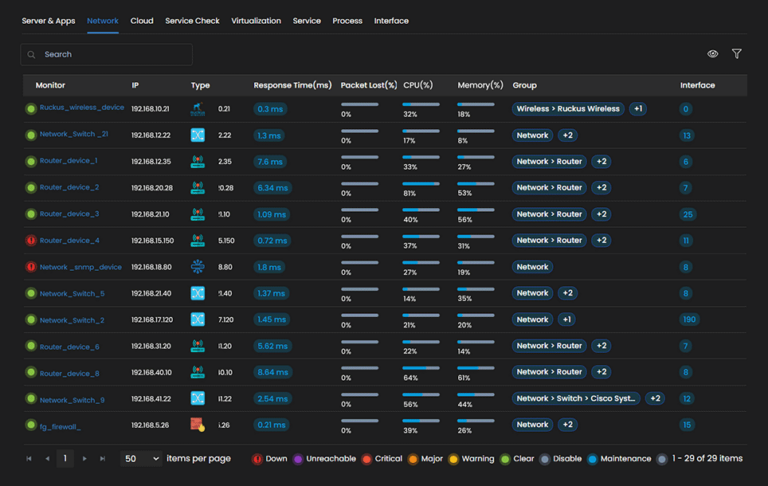
If you can only watch a few, start with availability, packet loss, latency and utilization. Those four catch most problems users feel. The device grid below shows several of them side by side for each monitored device.
How Motadata ObserveOps Monitors Network Performance
ObserveOps runs network performance monitoring inside its network observability platform. Metrics, flows, traps and logs from each device arrive in one place, where baselines, alerts and automation take over.
Collect Metrics Over SNMP, Ping and IP SLA
ObserveOps finds devices through two profiles. A credential profile holds the login details. A discovery profile sets which IP ranges, subnets or CIDR blocks get scanned.
You then confirm each device as a monitor and set its polling interval. Polling runs over SNMP v1, v2c or v3, and ping checks add reachability, response time and packet loss. See how polling works in SNMP monitoring.
For WAN links, ObserveOps works with Cisco IP SLA on the source router. You add a WAN link from that router's monitor and pick one of three probes:
ICMP Echo: Measures end-to-end response time to the destination.
ICMP Jitter: Measures jitter, packet loss, round-trip time and latency in both directions.
ICMP Path Echo: Measures response time at each hop along the path, plus the end-to-end time.
Each link carries the name of its ISP, so two circuits leaving the same router stay easy to tell apart. You can add links one at a time or in bulk.
Baseline Every Metric and Forecast Capacity
Fixed thresholds miss slow problems and fire on normal busy periods. ObserveOps adds three kinds of AI and ML policy on top of them:
Baseline alerts: Build a normal range for each metric from the past 15 days and alert when a value leaves it.
Anomaly policies: Check metric, log and flow data every 15 minutes for patterns that break the usual trend.
Forecast policies: Predict the next few hours of a metric from at least 24 hours of history and alert when the actual value strays from the forecast.
The Dependency Mapper records which devices sit upstream of others. So when a core router fails, you see one root cause in place of dozens of unrelated alerts. Learn more about network anomaly detection.
Alert, Automate and Open Tickets
Each alert can go to email, SMS, Microsoft Teams or Slack. It can also open a ticket in Jira or ServiceNow, or go to another system as a syslog message or SNMP trap.
Device health alerts do not rely on polling alone. ObserveOps receives SNMP traps on UDP port 1620 for v1 and v2c, and on UDP port 1630 for v3, along with syslog messages from your devices. So a failed fan or a flapping interface raises an alert as soon as the device reports it.
Through the ServiceOps integration, an alert can open an incident in Motadata ServiceOps by itself. You can also attach a runbook to a policy, so a known fix runs the moment the alert fires.
When a performance drop follows a configuration change, network configuration management keeps backed-up versions you can compare and restore.
Monitor Performance at Interface and Path Level
Device-level numbers tell you which router is struggling. ObserveOps interface and path views tell you exactly where.
Interfaces: Track utilization, errors and discards on every port and link. See network interface monitoring.
Paths: NetRoute maps each hop between two points, tracks latency and packet loss per hop and flags route changes. See network path visibility.
Traffic: When a link is full, flow data shows which users and applications filled it. See network traffic analysis.
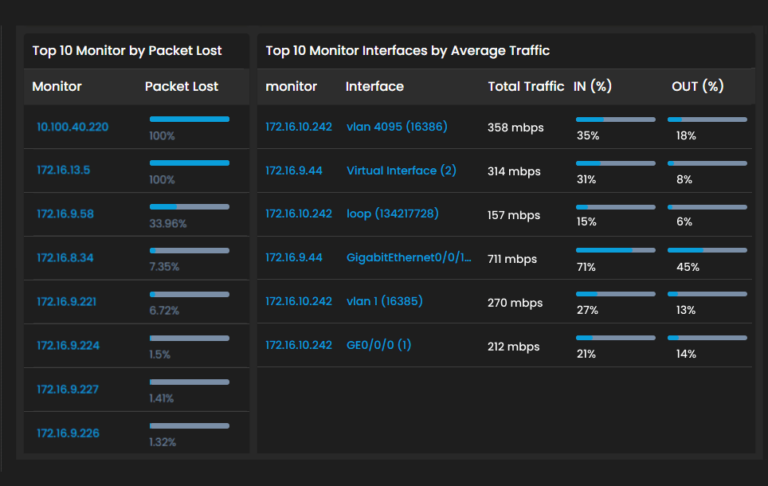
The widgets below rank the top monitors by packet loss and the top interfaces by traffic.
Report and Share Network Performance
ObserveOps ships ready-made dashboards for the common views. For anything beyond them, build your own widgets for device health, top interfaces by traffic or top devices by CPU, and share each dashboard with the team that needs it.
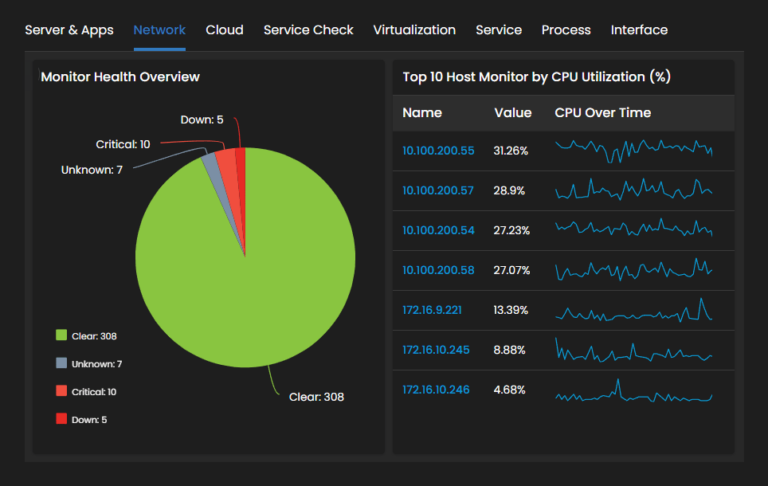
Reports cover the same data over longer periods. Use the built-in reports or create your own, schedule them to email the right people, and export them as PDF, XLSX or HTML for capacity reviews and audits. The dashboard below pairs monitor health with the top hosts by CPU use.
Keep Every Link Performing with Motadata ObserveOps
Motadata ObserveOps measures every metric in the table above on your routers, switches, firewalls and WAN links. It learns what normal looks like, ties related alerts to one cause and opens the ticket, all from one console.
The same platform covers traffic analysis, configuration backups and topology maps. So a slow link and the reason behind it sit side by side.
Run ObserveOps on premises or in your own cloud, on a single server or in distributed, high availability and disaster recovery setups. Your performance data stays on infrastructure that you control.
Ready to implement Network Performance Monitoring?
Discover how Motadata ObserveOps can help you monitor your infrastructure in real-time and respond to issues instantly.