All Features
Hybrid Infrastructure Monitoring
VMware Monitoring
Get in-depth, actionable insights and a single console to manage all of your VMware, virtual machines, and clusters with Motadata ObserveOps. A platform made with AI-ML capabilities to execute capacity planning, discover anomalies, and get efficient performance.
VMware monitoring aids you to monitor VMware ESXI, datastores, VMware datacenter, clusters, virtual machine, virtual networking, and more. It helps locate potential issues by monitoring performance metrics such as CPU, memory, storage, and disk usage.
VMware Performance Monitoring with Motadata ObserveOps
VMware monitoring is an essential element when it comes to virtual IT infrastructure monitoring. It helps you discover your clusters, data centres, hypervisors, and after monitoring them you can achieve rich analytics, capacity planning and forecasting.
Motadata helps ensure that your resources are appropriately utilized. It also detects anomalies and forecasts potential trends to make strategies.
In addition, it provides advanced monitoring of VMware-virtualized servers and a single management console for the whole physical and virtual server infrastructure.
Motadata ObserveOps, a VMware monitoring tool, can ingest the ESXi logs with the help of the out-of-box dynamic parsers, helping you capture the hypervisor activities, providing you an at glance view across your virtualized infrastructure.
In addition, with DRS (Distributed Resource Scheduler) enabled, you can monitor the activities and resolve the issues effectively with root cause analysis.
Motadata discovers the clusters and virtual machines through vCenter and ESXi discovery. It identifies the network elements configured in virtual machines – such as nodes, virtual machines, clusters, data stores, data centers, etc.
Motadata provides information about the cluster’s configuration and device status. You can discover further drill-down instances by re-discovering or registering new network components.
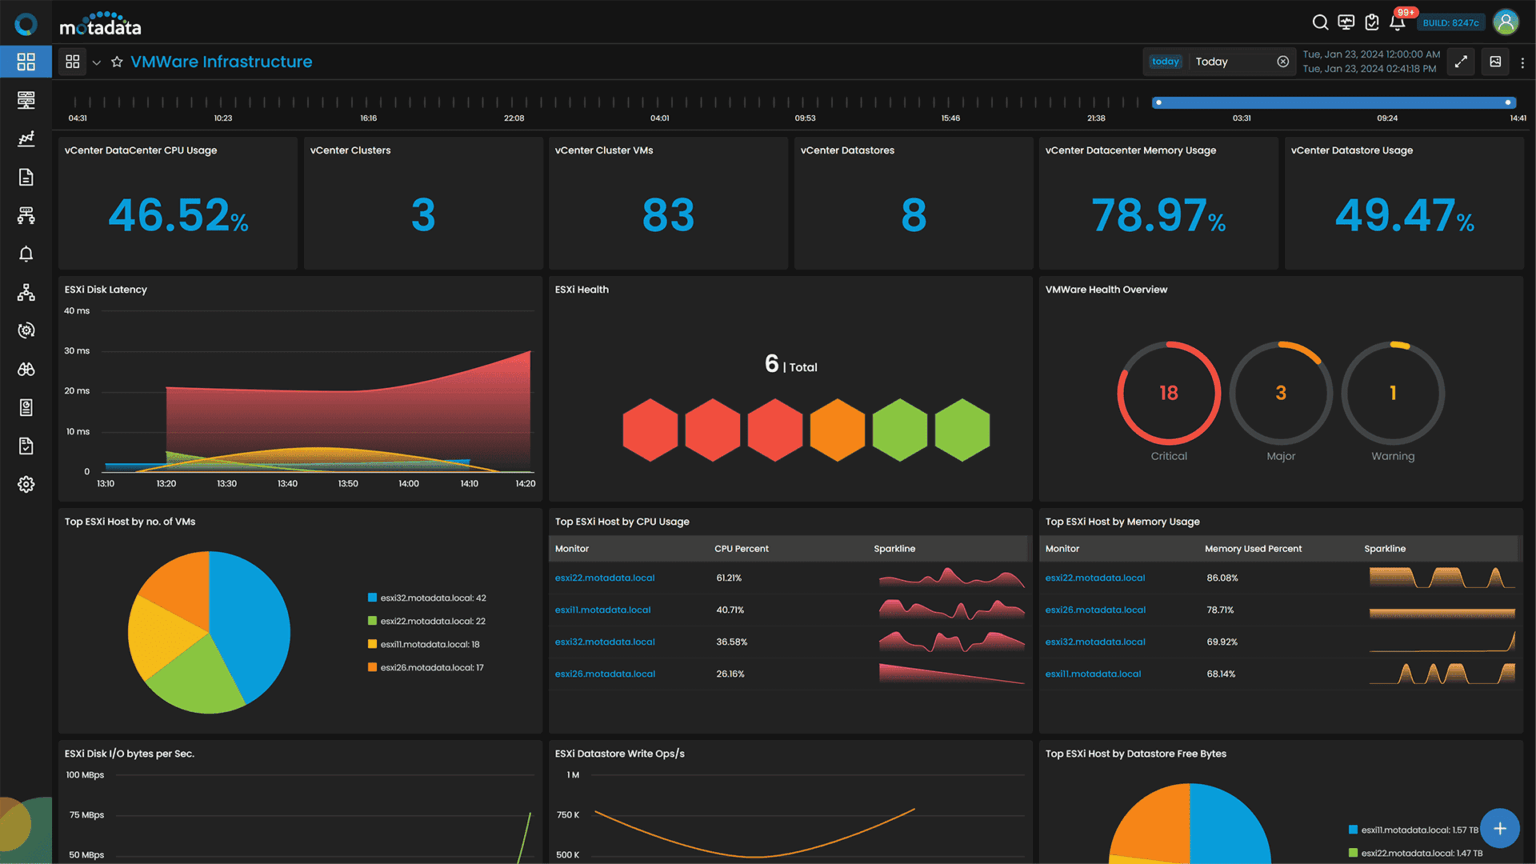
Measure Critical KPIs
VMware vCenter lets you manage all virtual machines and clusters under one platform.
With Motadata ObserveOps, a VMware network monitor, you can map all the cluster elements and co-relate with other events as well, providing a holistic view and visibility into metrics of clusters, virtual servers, virtual machines etc.
Monitoring critical metrics helps ensure smooth overall performance. It provides the top performers for every KPI, such as memory usage, CPU percentage, CPU capacity, disk free space, etc.
Some of the important KPIs of VMware monitoring are:
Sr. No. | Counter | Description |
|---|---|---|
1 | vcenter.memory.used.bytes | The amount of memory used on the vcenter. |
2 | vcenter.cpu.used.hz | The used clock rate of the CPU. |
3 | vcenter.resource.pools | The count of resource pools in the vcenter. |
4 | vcenter.virtual.machines | The count of virtual machines on the vcenter. |
5 | vcenter.data center.memory.used.percent | The percentage of used memory out of the total memory on the data center. |
6 | vcenter.data center.cpu.percent | The CPU utilisation of data center. |
7 | vcenter.datastore.used.percent | The percentage of used space out of the total space on the datastore. |
8 | esxi.disk.used.percent | The percentage of disk space used for ESXi |
9 | esxi.cpu.percent | The percentage of CPU utilization for ESXi |
10 | esxi.cpu.ready.seconds | The amount of time spent in a ready state for CPU utilization for ESXi |
11 | esxi.cpu.used.hz | The amount of CPU used in hertz for ESXi |
12 | esxi.running.virtual.machines | The number of virtual machines currently running on the ESXi host |
13 | esxi.network.bytes.per.sec | The rate of network traffic in bytes per second |
14 | esxi.disk.free.percent | The percentage of free disk space available on the ESXi host |
15 | esxi.memory.used.percent | The percentage of memory used by the ESXi host |
16 | esxi.vm.cpu.percent | Percentage of CPU time used by the ESXi VM |
17 | esxi.vm.memory.used.percent | Percentage of used memory of the ESXi VM |
18 | esxi.vm.network.bytes.per.sec | Total bytes per second transferred by the virtual machine |
19 | esxi.vm.disk.used.percent | Percentage of disk space used by the virtual machine |
20 | esxi.network.interface.bytes.per.sec | The rate at which bytes are transmitted and received by the network interface. |
21 | esxi.datastore.used.percent | Percentage of used space on the datastore |
22 | esxi.datastore.read.bytes.per.sec | Read bytes per second |
23 | esxi.datastore.read.ops.per.sec | Read operations per second |
Forecasting & Capacity Planning
Motadata ObserveOps, a virtual infrastructure monitoring tool, is built with AI-ML abilities, making it an advanced and powerful monitoring solution. It learns from historical data and patterns and predicts potential utilization, helping you to prioritize capacity and license planning.
VM Sprawl management helps you manage the number of virtual machines effectively and keeps you one step ahead by utilizing VMs effectively.
Discover under-provisioned and over-provisioned VM servers and optimize them efficiently, getting the best performance out of them.
Motadata ObserveOps offers many out of the box capacity planning reports. Here’s a list of all VMware capacity planning reports:
VMs on Full Datastores (Less than 2 GB free) |
VMs Using More Than One Datastore |
VMs With Less Than 1 GB Free Space |
VMs With Less Than 10% Free Space |
VMs with more than 2 snapshots |
VMs With More Than 20 GB Free Space |
VMs with old snapshots (older than 30 days) |
VMs With One Disk Volume |
VMs With One Virtual CPU |
VMs With One Virtual Disk |
VMs With over 2 GB in snapshots |
Dashboards, Alerts & Reports
Virtual infrastructures are robust and complex, making it challenging to get visibility and keep an eye on every metric.
With comprehensive VMWare monitoring dashboard Motadata ObserveOps offers a dynamic dashboard, providing all the critical KPIs on one screen and visibility across the IT infrastructure.
It sends SMS or email notifications whenever predefined availability and performance thresholds are crossed using out-of-the-box pre-configured alerts. The critical and prioritized alerts for potential issues save your inbox from overloaded notifications.
Motadata ObserveOps, which offers VMware monitoring, also provides detailed and rich reports on crucial metrics for every host and server, such as CPU consumption, memory, disk utilization, etc.
You can export the reports in PDF and CSV formats to troubleshoot issues and analyze utilization trends. The reports help you make confident decisions for your IT enterprise and improve efficiency, boosting your business revenue.
Motadata ObserveOps is designed on Deep Learning Framework for IT operations, making it an advanced monitoring solution. It ensures the identification and elimination of potential VM problems and offers smooth hosting.
In addition, it monitors your VMware environment proactively and ensures your virtual infrastructure’s best performance and health.
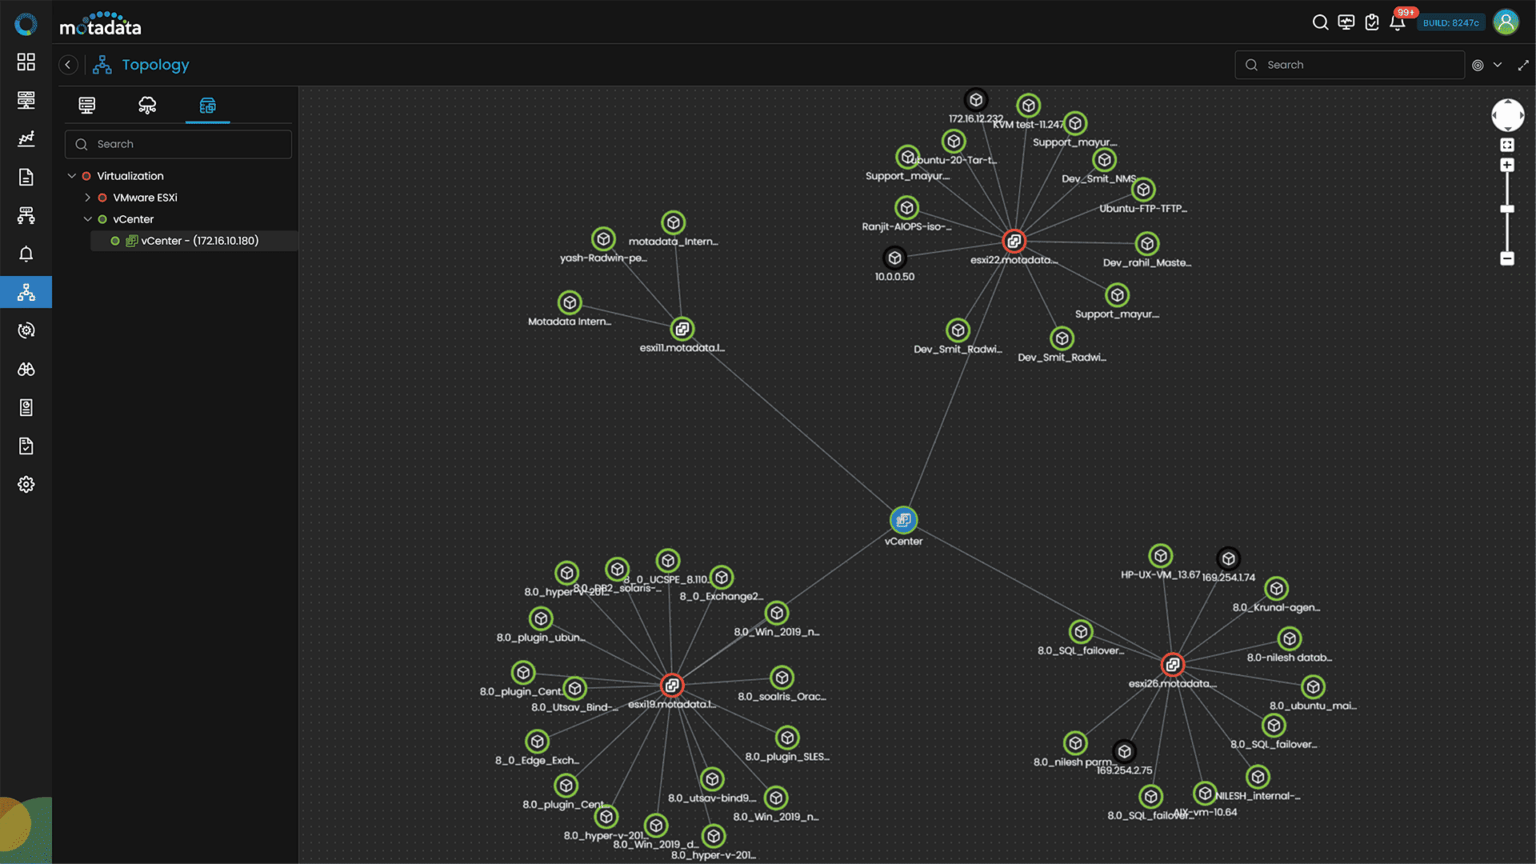
VMware Topology
Motadata VMware monitoring solution encompasses a detailed topology to manage and monitor virtual environments effectively.
VCenter is integrated at its core, working as a central hub that oversees virtual environments. This ensures real-time visibility into the health, performance, and usage of virtualized resources.
Ready to implement VMware Monitoring?
Discover how Motadata AIOps can help you monitor your infrastructure in real-time and respond to issues instantly.