All Features
Hybrid Infrastructure Monitoring
CPU Usage Monitoring
Monitor CPU usage and get insights into CPU metrics and forecasts about the potential usage. Discover anomalies with the historical CPU usage data with Motadata ObserveOps.
Motadata ObserveOps can monitor the CPU usage of different infrastructure components and generate historical trends and analytics based on past behavior. As a result, it can forecast the upcoming CPU behavior, preventing potential problems and ensuring smooth operations.
Make sure your system stays responsive with Motadata CPU Usage Monitoring solution. You can easily detect and manage heavy CPU utilization by receiving alerts when thresholds are met. It allows you to link the performance issues with the resources and helps you resolve them before they disturb the user experience.
Seamlessly Monitor CPU Usage for Higher Efficiency
Whether hosted on the on-premises or cloud infrastructure, you can map business-critical application services with Motadata ObserveOps to monitor key performance counters. This helps you trace the root cause of the application performance issues and evaluate the end source of the bottleneck.
CPU usage is one of the most imperative performance metrics to enhance the operations of your enterprise applications. Enterprises can monitor the health of the network and server by monitoring CPU usage. Here are two use cases to get more clarity:
Your cloud-hosted application degrades its performance due to high CPU usage. Motadata CPU usage monitoring can aid you in identifying the process or service that leads to increased use in the server. You can also know the underlying reason that triggered performance degradation.
If you notice an unusual CPU spike in any network device, it can increase the packet loss and error counts in your network.
This directly disrupts the end-user experience. Motadata gives you alerts and notifications in case of any spike in CPU usage.
With Motadata ObserveOps on board, it is easy to identify devices with high CPU resources and avoid disruption in your infrastructure operations. Motadata AIOps can monitor CPU utilization of all types of devices.
Visualize Trends with Metric Explorer and Dashboards
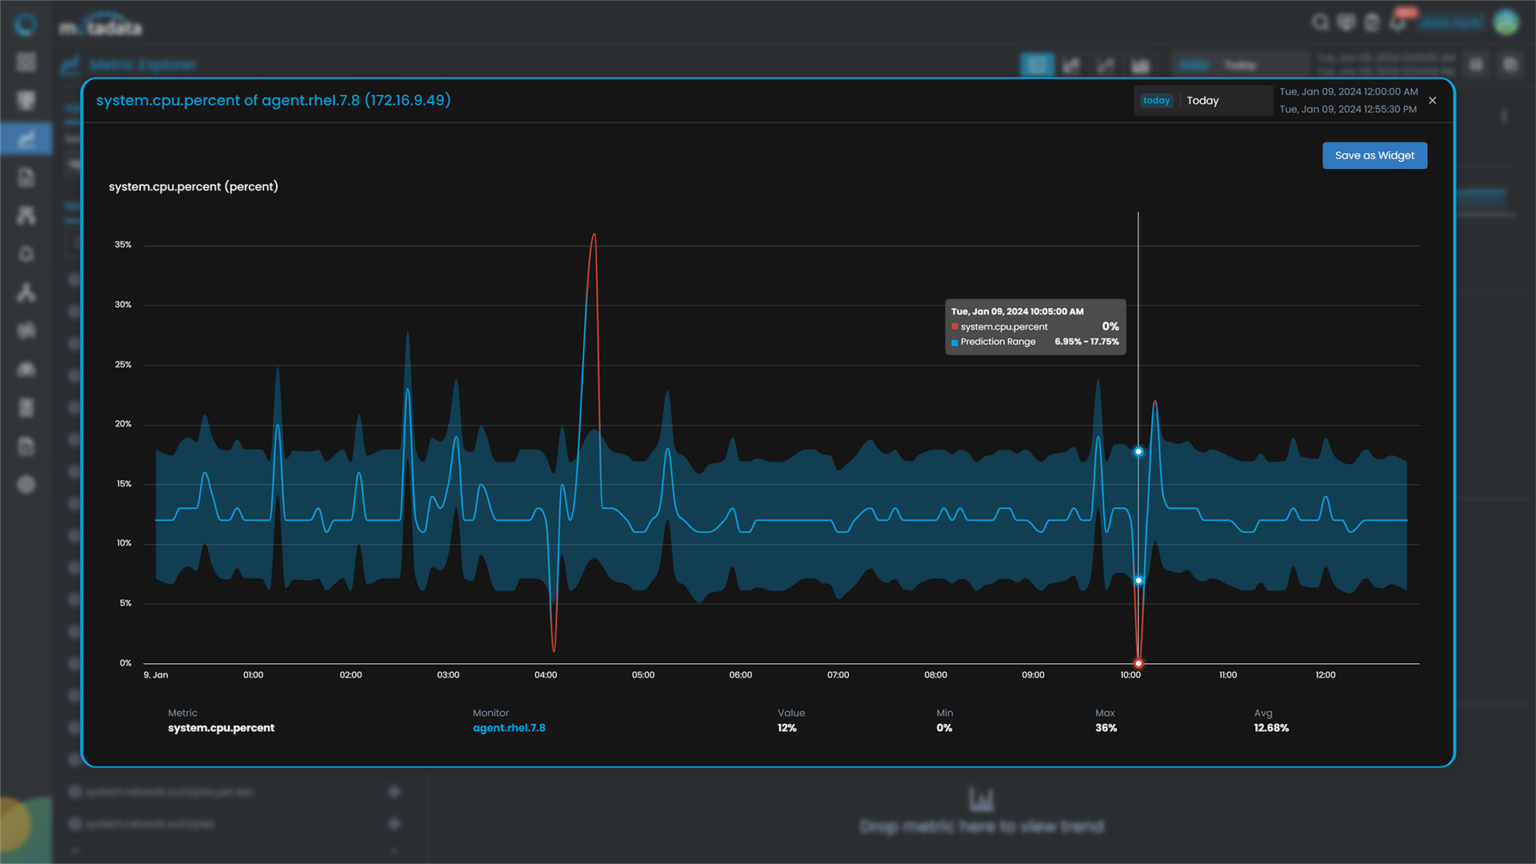
With Metric Explorer, you can determine historical trends in CPU usage, conduct an in-depth comparison of trends with past timelines, detect anomalous behavior quickly, and forecast the same – all these aid in capacity planning.
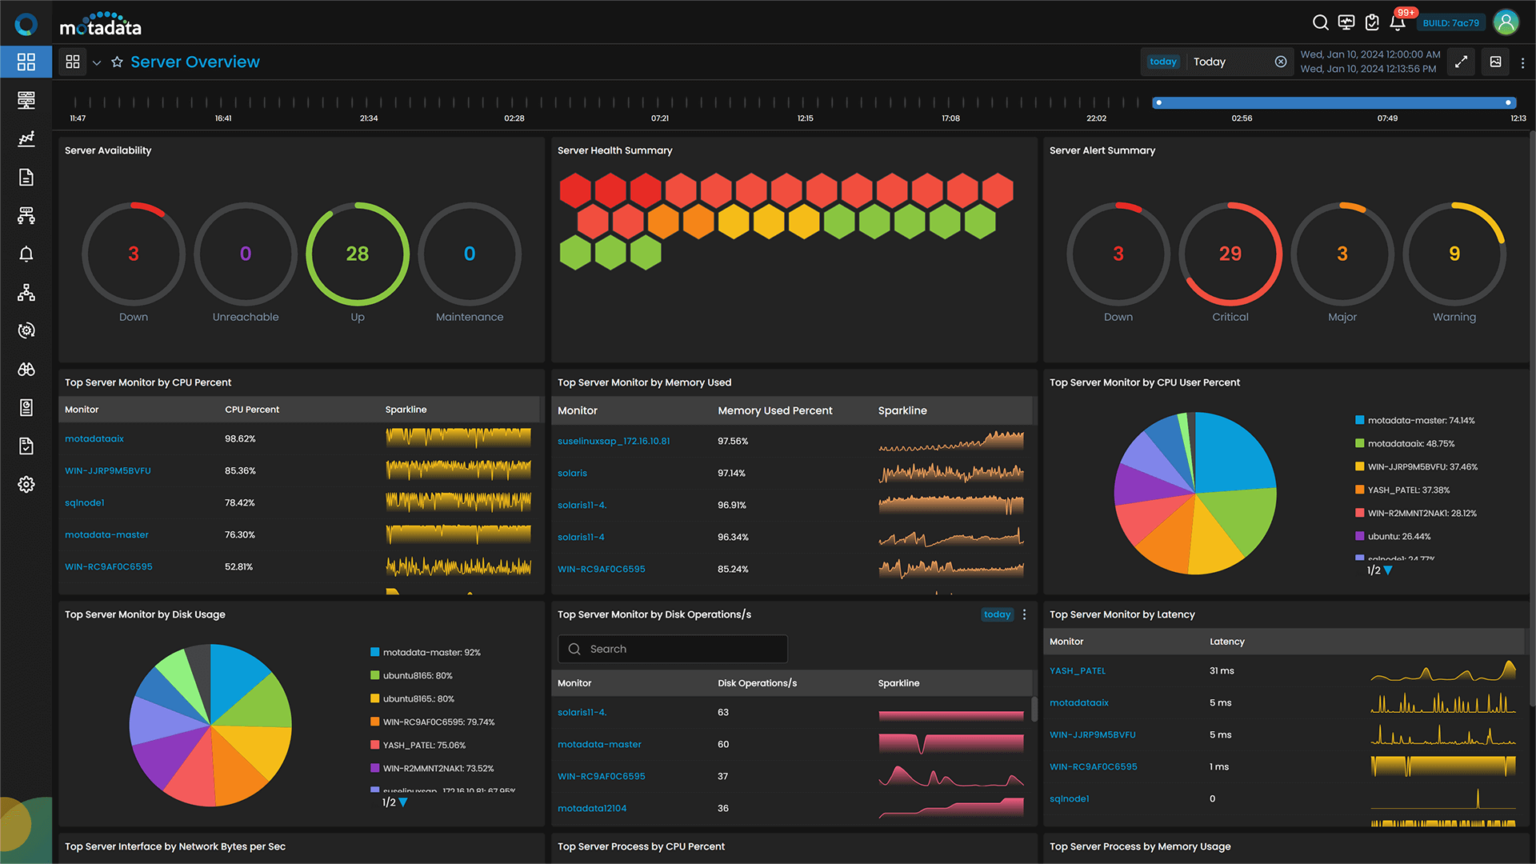
Motadata ObserveOps lets you display pre-built and customized dashboards and visualize CPU utilization with graphical displays, color-coded data, and timeline-based metrics.
With our robust dashboard, you can identify the top devices with high CPU utilization, and you can make custom widgets to identify behaviors with respect to specific timelines or days.
Metric Explorer and dashboards help you visualize CPU usage trends across devices and efficiently identify, monitor, and manage CPU usage. This facilitates informed decision-making and streamlines optimization strategies.
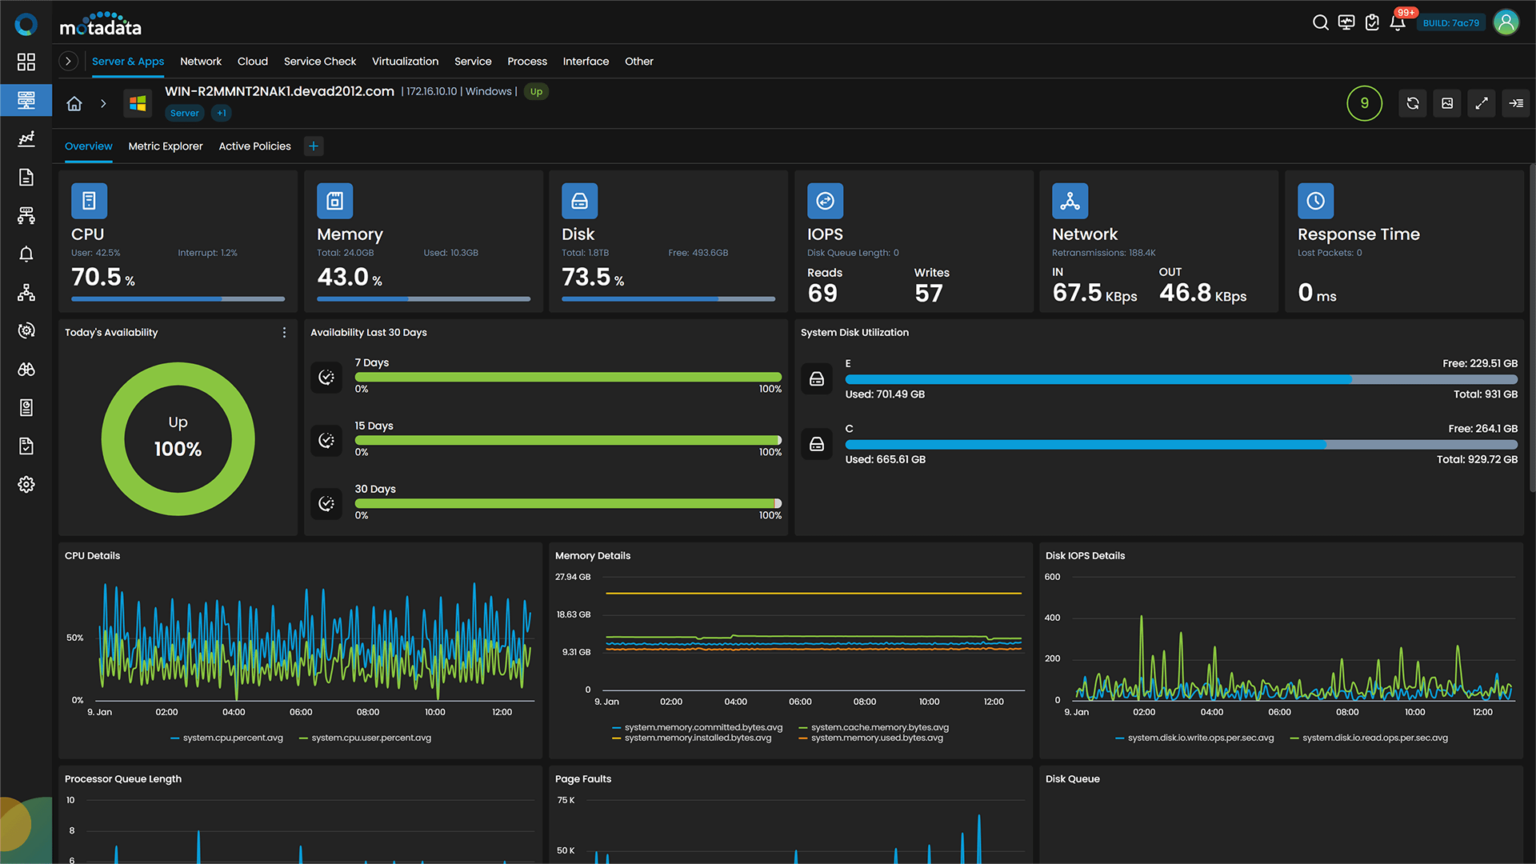
Motadata offers comprehensive CPU monitoring that can be displayed on the dashboard. The resource saturation in your server helps you address the bottlenecks efficiently.
Next, drilling down into the server performances let you maximize the CPU resource available for the application performance and prevent performance issue before they interrupt the end-user experience.
Static Threshold Alerts, Dynamic Threshold Alerts, and Anomaly Detection
Motadata lets you set the threshold for each CPU monitor across your network, alerting you whenever the CPU usage crosses the threshold limit.
Motadata ObserveOps enables two types of threshold alerts, i.e., static threshold alerts and dynamic threshold alerts. In static threshold alerts, If the CPU usage goes above a predetermined limit, it gives the user an alert.
Dynamic threshold alerts are more responsive in monitoring CPU utilization. They give alerts to the users when they detect sudden spikes beyond the usual pattern, while static thresholds trigger alerts only at predetermined limits.
For instance, if the CPU utilization is typically at 5%, the static threshold will only give an alert at its set limit. Still, the dynamic threshold will provide an alert in the event of an unexpected surge.
Motadata ObserveOps is designed with Deep Learning Framework for IT operations with AI-ML abilities, making it an intelligent and advanced monitoring solution. It monitors the CPU metrics and forecasts the potential CPU usage. It also discovers anomalies in the historical CPU usage data.
Often, even if you monitor CPU utilization, there could be a sudden spike in the usage that can impact the application performance poorly. Such sudden spikes can be anomalies. Motadata ObserveOps can detect abnormal behavior in the systems and provide alerts.
Motadata CPU Usage Monitoring Offers Trend Reports
Motadata offers built-in reports based on customized parameters that measure CPU usage. Users can manually generate and schedule the reports for the designated time.
Motadata ObserveOps servers a wide range of CPU monitoring features along with CPU usage monitoring. The comprehensive monitoring tool provides solutions for CPU performance, monitoring CPU hardware metrics, holistic monitoring dashboards for CPU monitoring, etc.
Motadata ObserveOps – CPU Usage Monitoring KPIs
System.cpu.idle.percent – The percentage of time a CPU has spent in the idle state.
System.cpu.interrupt.percent – The percentage of time the CPU has spent servicing hardware interrupts
System.cpu.description – The description of the CPU.
System.cpu.type – The type of the CPU.
System.cpu.user.percent – The percentage of time the CPU spent running user space processes.
System.cpu.percent – The percentage of a CPU being utilized at a particular instance.
System.cpu.cores – The number of CPU cores on your host.
System.cpu.core.user.percent – The percentage of CPU core being utilized by the user.
System.cpu.core.percent – The percentage of CPU core being utilized.
System.cpu.core.interrupt.percent – The percentage of time the CPU core has spent servicing hardware interrupts.
System.cpu.core.idle.percent – The percentage of time the CPU core has spent idle.
System.process.cpu.percent – The CPU utilization of a process.
Ready to implement CPU Usage Monitoring?
Discover how Motadata AIOps can help you monitor your infrastructure in real-time and respond to issues instantly.