All Features
Network Observability
SNMP Monitoring Tool
Use Motadata ObserveOps to poll routers, switches and UPS units over SNMP, and to catch the traps those devices send between polls. SNMP v1, v2c and v3 are all supported. When you add a device, ObserveOps matches it to a monitoring template on its own. Outages usually start small. Somewhere among the switches, routers and firewalls, a port starts dropping packets or a chassis fan slows. Without monitoring, users tend to see the effect before the network team does. Most network devices already come with an SNMP agent. Because of that, SNMP is still one of the first protocols a monitoring setup reaches for when the hardware comes from several vendors. ObserveOps talks to that agent in two ways, as SNMP monitoring software should: scheduled polls for metrics, and a listener for events the device reports itself.
What Is SNMP Monitoring?
SNMP monitoring is the practice of collecting performance data from network devices over the Simple Network Management Protocol, through scheduled polls and event-driven traps. It's the standard method for SNMP network monitoring across multi-vendor hardware. It also supplies much of the device data behind network management systems.
Four components make it work:
SNMP manager: The monitoring platform, ObserveOps in this case, that sends requests to devices and receives their responses and traps.
SNMP agent: Software on the managed device that answers requests and sends traps when something changes.
MIB: The Management Information Base, a structured definition of every value a device can report.
SNMP OID: The Object Identifier, a dotted numeric address such as 1.3.6.1.2.1.1.3.0 (system uptime) that points to one value inside the MIB.
A monitoring platform reads those OIDs in two ways. Polling happens on a timer, with the manager requesting current values from the agent each cycle. Traps reverse the direction, and the device speaks first whenever something changes.
How SNMP Monitoring Works in ObserveOps
In ObserveOps, SNMP devices come in through two profiles: one holds the credentials, and the other tells discovery which addresses to scan. Setup follows three steps:
Create a credential profile: Choose SNMP V1/V2c with a read community string, or SNMP V3 with a security user name and security level. One profile can be assigned to every monitor that shares the same protocol.
Run a discovery profile: Enter an IP address, host, IP range, CIDR block or CSV file, pick the credential profile and collector, and run it immediately or on a schedule. ObserveOps polls on UDP port 161 by default, with ping check and interface discovery switched on.
Provision the results: ObserveOps reads each device's system OID with an SNMP walk and matches it against the SNMP Device Catalog, which assigns the monitor type and template. Select the devices to add, and collection begins.
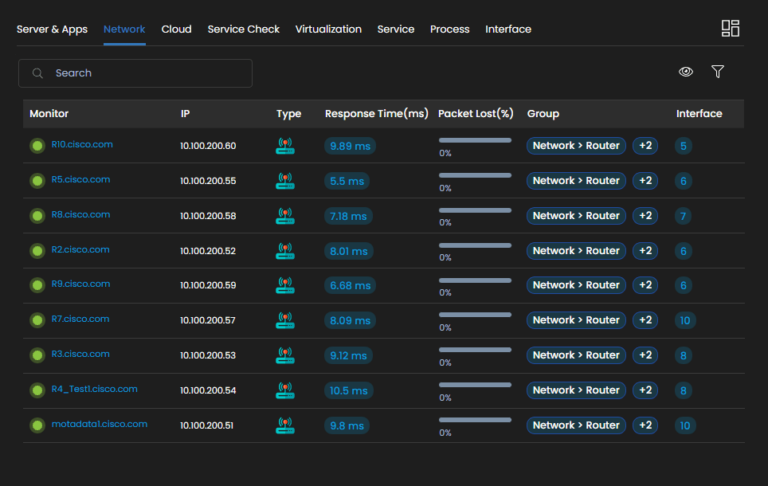
The same workflow covers UPS units alongside routers and switches. Printers, NVRs and similar SNMP-enabled hardware can be added through the SNMP Device Catalog. The polled data feeds network performance monitoring as well, which means device health and link performance are measured from the same numbers.
Which SNMP Device Metrics Does ObserveOps Collect?
ObserveOps collects SNMP device metrics through pre-built templates, one for each device type. A new monitor starts reporting straight away, with no OID mapping to do first. By default, a template pulls the core performance counters plus basic configuration details for that device family, and you can edit it when your requirements differ.
For SNMP performance monitoring, templates organize metrics into two group types:
Scalar metric groups: Single values, such as CPU utilization or memory usage.
Tabular metric groups: Sets of related rows, such as interface statistics or routing entries.
How Does the SNMP Device Catalog Identify and Monitor Devices?
The SNMP Device Catalog is a vendor-agnostic repository of device records, organized by system OID, that ObserveOps uses to identify and template every device it discovers.
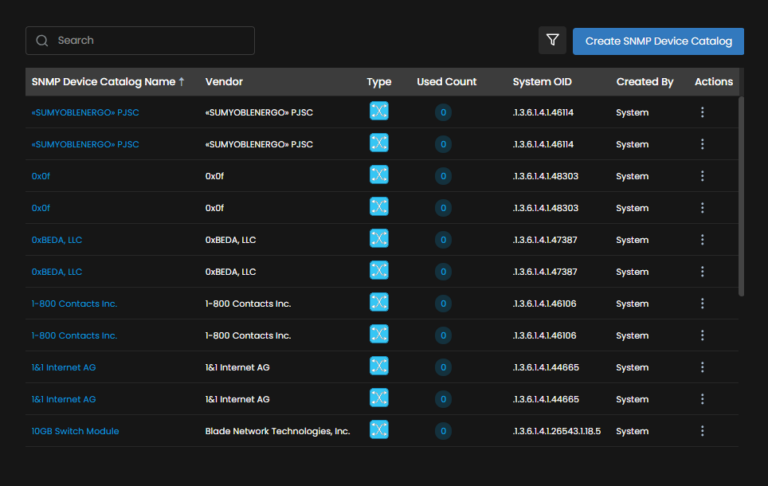
Each record ties a system OID to a vendor and device type, along with the metric OIDs to poll for that device. Vendors add new metrics over time, and sometimes you need a custom one derived from OIDs you already poll. Either way, you add a catalog entry, and ObserveOps picks up the new OIDs on its next poll cycle.
Adding a custom record takes five steps:
Identify the device: Enter the system OID, a descriptive name, the vendor and the device type.
Group the metrics: Create metric groups and mark each one as scalar or tabular.
List the OIDs: Name each OID and enter its value, or browse supported OIDs with Choose OID.
Test before saving: Run Test OID Group, select the parent OID, then create the catalog record.
Assign monitors: Attach the record to existing network monitors so collection starts on the next poll.
Once the OIDs test successfully, a device that was never in the default catalog is discovered and alerted on like any other.
SNMP Polling vs SNMP Traps
ObserveOps runs SNMP polling and SNMP traps side by side because each one sees a different part of device health.
Aspect | SNMP Polling | SNMP Traps |
Direction | Manager requests data from the agent | Agent sends a message to the manager |
Timing | At a set interval | When an event occurs |
Standard port | UDP 161 on the device | UDP 162 on the manager |
ObserveOps port | UDP 161 by default | UDP 1620 (v1/v2c) and UDP 1630 (v3) by default |
Best suited to | Trends, baselines and capacity planning | Link failures, hardware faults and events between polls |
ObserveOps components | Credential profile, discovery profile, SNMP Device Catalog | Trap listener, trap profiles, Trap Explorer, trap forwarder |
Polling builds the performance history. A fault that starts and clears between two polls would never appear in that history. Traps catch it.
How Does ObserveOps Handle SNMP Traps?
ObserveOps handles SNMP traps with a listener that takes them in and trap profiles that identify each one by OID. SNMP traps are how a device reports on itself unprompted. A link drops or a power supply fails, and the agent sends word straight away.
Encryption depends entirely on the SNMP version. On v1 and v2c, anyone who can see the traffic can read the trap, whereas version 3 encrypts it at the Auth Privacy level. Volume is what causes trouble day to day, when one serious fault turns up in the middle of routine notifications.
SNMP trap monitoring in ObserveOps handles that through four components:
SNMP Trap Listener: Receives traps on UDP 1620 for v1/v2c and UDP 1630 for v3 by default. Each listener profile takes its own port plus the community string or SNMPv3 credentials of the sending devices.
SNMP Trap Profiles: A built-in database maps well-known trap OIDs to a name, message and severity. You can create custom profiles manually or by CSV upload, and set Filter to Yes to drop traps you never need to see.
Trap Explorer: Charts trap counts over a chosen timeline and filters the list by severity, trap OID, source and vendor. Drill into any trap for its raw message and history, acknowledge it once the issue is handled, or watch incoming traps in the Live Trap Viewer.
SNMP Trap Forwarder: Maps one or more trap profiles to a destination IP address, so matching traps also reach another tool. Forwarded traps remain visible in ObserveOps.
Trap policies then turn specific trap events into alerts. Inside a policy, varbind filters narrow the match, and you choose whether the alert is raised as Critical, Major or Warning. A suppress window stops a flapping device from repeating the same notification, and a clear condition closes the alert once the issue resolves.
Notifications reach users or plain email addresses; Microsoft Teams and Slack handles work as well once the integration profile exists. Policies can also run a runbook, or declare an incident in a connected tool. Our guide to SNMP trap management covers the wider practice behind these settings.
How Does SNMP Monitoring Help Detect Network Faults?
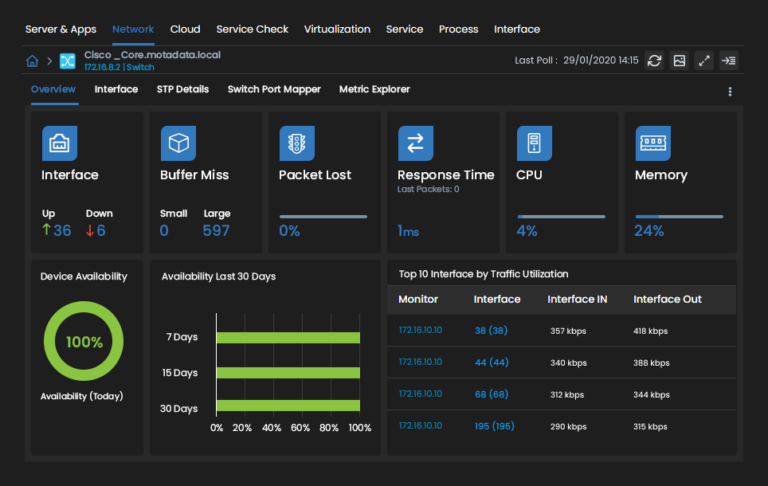
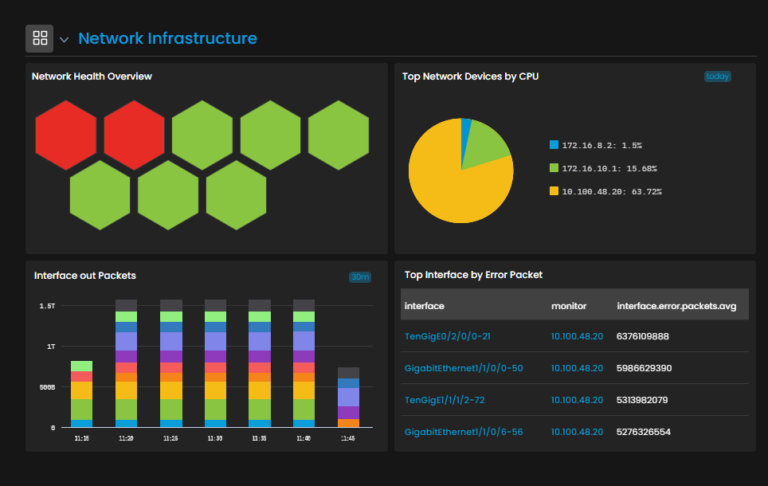
Faults show up in SNMP monitoring through two signals: a polled metric crossing its threshold, and a trap the device sends on its own. Spotting the fault is step one of fault management; network troubleshooting and repair come next. ObserveOps alerts on either signal and lists hard failures next to slow degradation, which gives triage one starting point.
With each device's polling history on record, network administrators can work back from dashboard widgets and graphs, or pull an on-demand report, and then decide what to fix first. Some metrics drift too gradually for a fixed threshold to catch. For those, ObserveOps offers two AI/ML policy types:
Anomaly policies: Flag SNMP metrics that move away from their normal pattern, covered in more detail on the network anomaly detection page.
Forecast policies: Project metric trends forward, which supports capacity forecasting before a resource runs short.
How Does SNMPv3 Secure SNMP Monitoring?
SNMPv3 protects SNMP monitoring with per-user authentication and optional encryption. Wherever a device supports it, make v3 the default. Versions 1 and 2c depend on a community string sent in clear text, and anyone capturing packets on that segment can read it.
ObserveOps handles v1, v2c and v3. For v3, you pick the security level in each credential profile:
No Auth No Privacy: User name only, with no authentication or encryption.
Auth No Privacy: Message authentication with MD5, SHA, SHA224, SHA256, SHA384 or SHA512.
Auth Privacy: Authentication plus encryption with DES, AES, AES192, AES192C, AES256 or AES256C.
SNMP Versions and Ports at a Glance
Version | How It Authenticates | Encrypted | Notes |
SNMPv1 | Community string in clear text | No | Original version with 32-bit counters |
SNMPv2c | Community string in clear text | No | Adds GetBulk requests and 64-bit counters |
SNMPv3 | Security user name with optional authentication | Only at Auth Privacy | Preferred version where supported |
Firewall rules for SNMP ports are straightforward. For polling, open UDP 161 from the ObserveOps server toward each device you monitor. Traps go the other way, to the ObserveOps server on UDP 1620 for v1/v2c and UDP 1630 for v3, unless your listener profiles use different ports.
Windows is the exception here. Its built-in SNMP service handles v1 and v2c only. On those hosts, use v2c with a strong read-only community string.
Monitor Every SNMP Device and Trap with Motadata ObserveOps
SNMP covers only what the agent exposes, which leaves application behavior and traffic patterns to logs, flows or traces. If you are comparing SNMP monitoring tools, device discovery and custom OID handling are the first two things to test. Then check how each one keeps trap noise down, and whether SNMPv3 works across your devices.
ObserveOps runs SNMP polling and trap handling inside its network observability platform. Your device metrics and traps share a console with the rest of the infrastructure you monitor there. For a direct look at how it compares, see Motadata vs PRTG.
Ready to implement SNMP Monitoring Tool?
Discover how Motadata ObserveOps can help you monitor your infrastructure in real-time and respond to issues instantly.