All Features
Hybrid Infrastructure Monitoring
Virtual Machine Monitoring
Get complete visibility across your virtual infrastructure and virtual machines. Get crucial metrics data of your Hyper-V, VMware, or Citrix VMs and perform faster troubleshooting with Motadata ObserveOps.
With complex and more extensive IT enterprises, businesses have started depending on virtual infrastructures for easy accessibility and availability with optimized resource utilization.
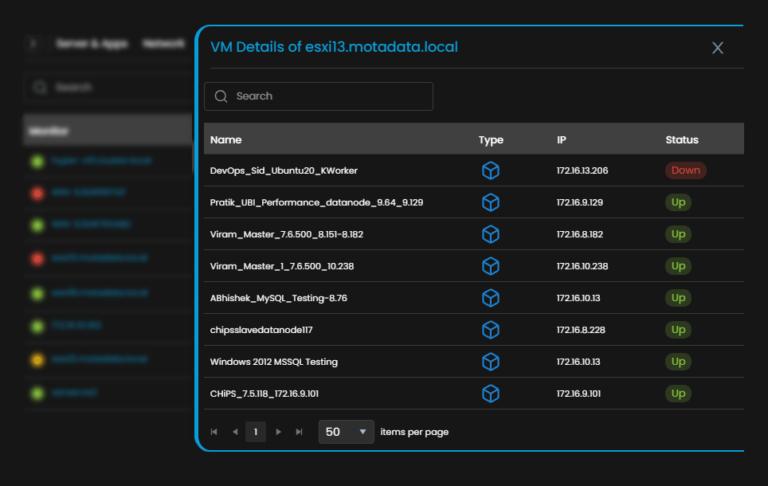
Motadata ObserveOps provides a comprehensive VM monitoring solution that offers metric data to monitor the virtual machines across your virtualization infrastructure.
Motadata connects with the virtual servers and examines the host servers’ and virtual machines’ health and performance. The out-of-the-box reports and dynamic dashboards can help IT admins with more visibility into virtual devices and perform fault management and capacity planning.
They can also maximize VM server uptime and ensure the guest virtual machines are functioning at their peak performance.
Monitor Health & Performance
Motadata’s monitoring tool is a powerful virtual machine monitoring solution that offers a wide range of monitoring features and capabilities under one console.
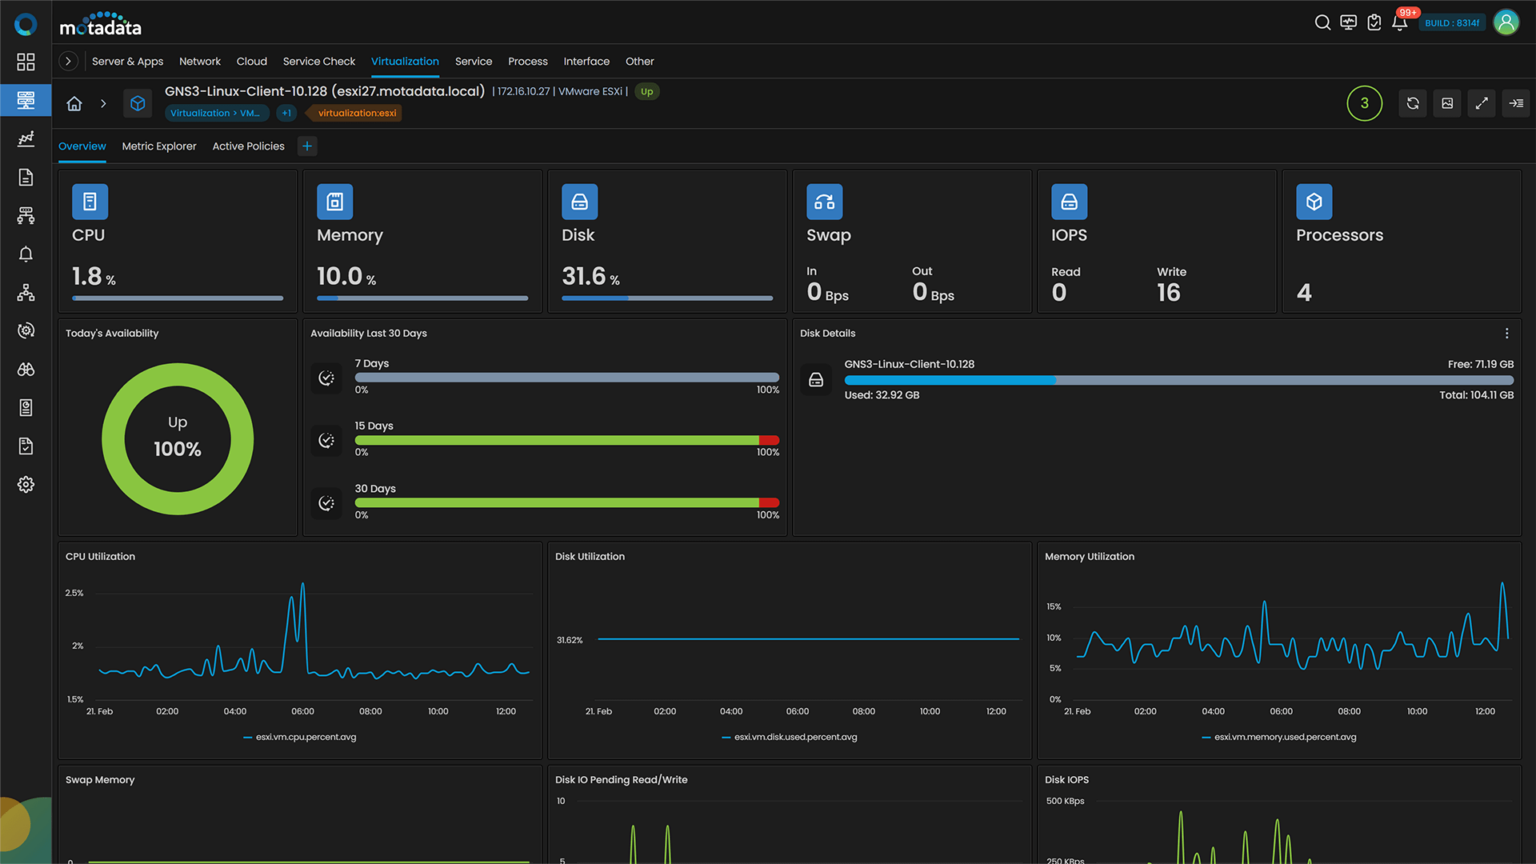
It also offers critical performance metrics and helps you visualize dashboards with metric trends and drill-down analysis. In addition, the advanced alert system helps you stay updated with the ongoing activities and events on your virtual machines.
Motadata allows you to terminate idle virtual machines quickly and provides real-time monitoring of virtual machine performance metrics such as CPU usage, memory usage, and storage.
The metrics information allows you to experiment with multiple workload models on your current technical specification and hardware.
With this, you can strategize the new investments and ensure that the resources are correctly configured to meet the requirements.
Here’s a list of some important KPIs for virtual machine monitoring:
Sr. No. | Counter | Description |
|---|---|---|
1. | vm.memory.used.percent | The percentage of used memory out of the total memory on the virtual machine. |
2. | vm.memory.free.bytes | Amount of memory currently free on a virtual machine |
3. | vm.cpu.percent | The CPU utilization of the virtual machine. |
4. | vm.idle.cpu.percent | Measure of the percentage of idle CPU time for a VM |
5. | vm.cpu.usage.hz | CPU usage in Hz for the virtual machine on ESXi |
6. | vm.virtual.disk.volumes | The number of virtual disk volumes of the ESXi VM |
7. | vm.disk.io.read.bytes.per.sec | Number of bytes read from disk per second |
8. | vm.disk.io.write.bytes.per.sec | Number of bytes written to disk per second |
9. | vm.disk.io.errors | Number of disk I/O errors |
10. | vm.disk.capacity.bytes | Total disk capacity of the virtual machine in bytes |
11. | vm.network.bytes.per.sec | Number of network bytes transferred per second |
12. | vm.virtual.processors | The number of virtual processors of the ESXi VM |
Complete Visibility Across Your Virtualized Infrastructure
With a comprehensive monitoring tool, you can gain visibility across Citrix, Hyper-V, and VMware performances. Whether your devices are on-premises, hybrid, or in the cloud, it helps you understand your virtual environment more efficiently and resolve the issues of VMware vSphere, Citrix Xenserver, and Microsoft Hyper-V. In addition, the VM monitoring dashboards helps you perfect faster troubleshooting under one dashboard without visiting multiple tools for each hypervisor.
You can get information about the health of your entire environment, be it a server, virtual machine, or storage infrastructure. You can also troubleshoot all the issues with mapping and contexts under one view.
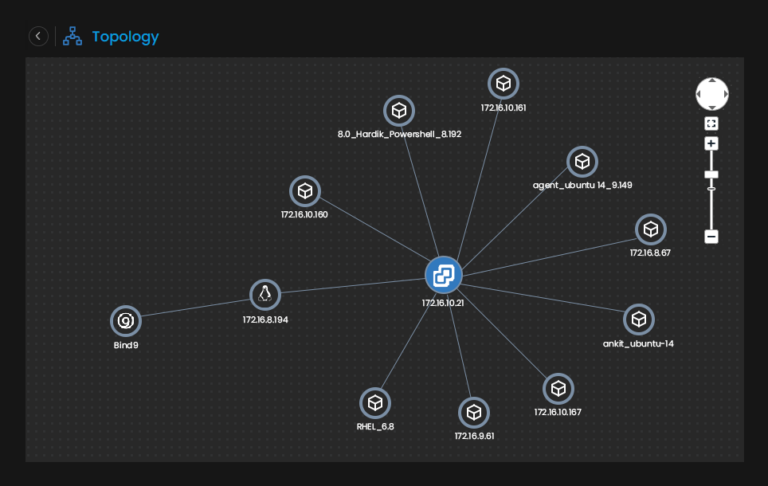
Visualize all your virtual machines with topology mapping and get complete visibility across your virtual architecture.
Motadata ObserveOps promises to offer end-to-end IT monitoring solutions with absolute ease and efficiency. For example, you can drag and drop the performance metrics from the system data of various resources and display the metric data on a single chart.
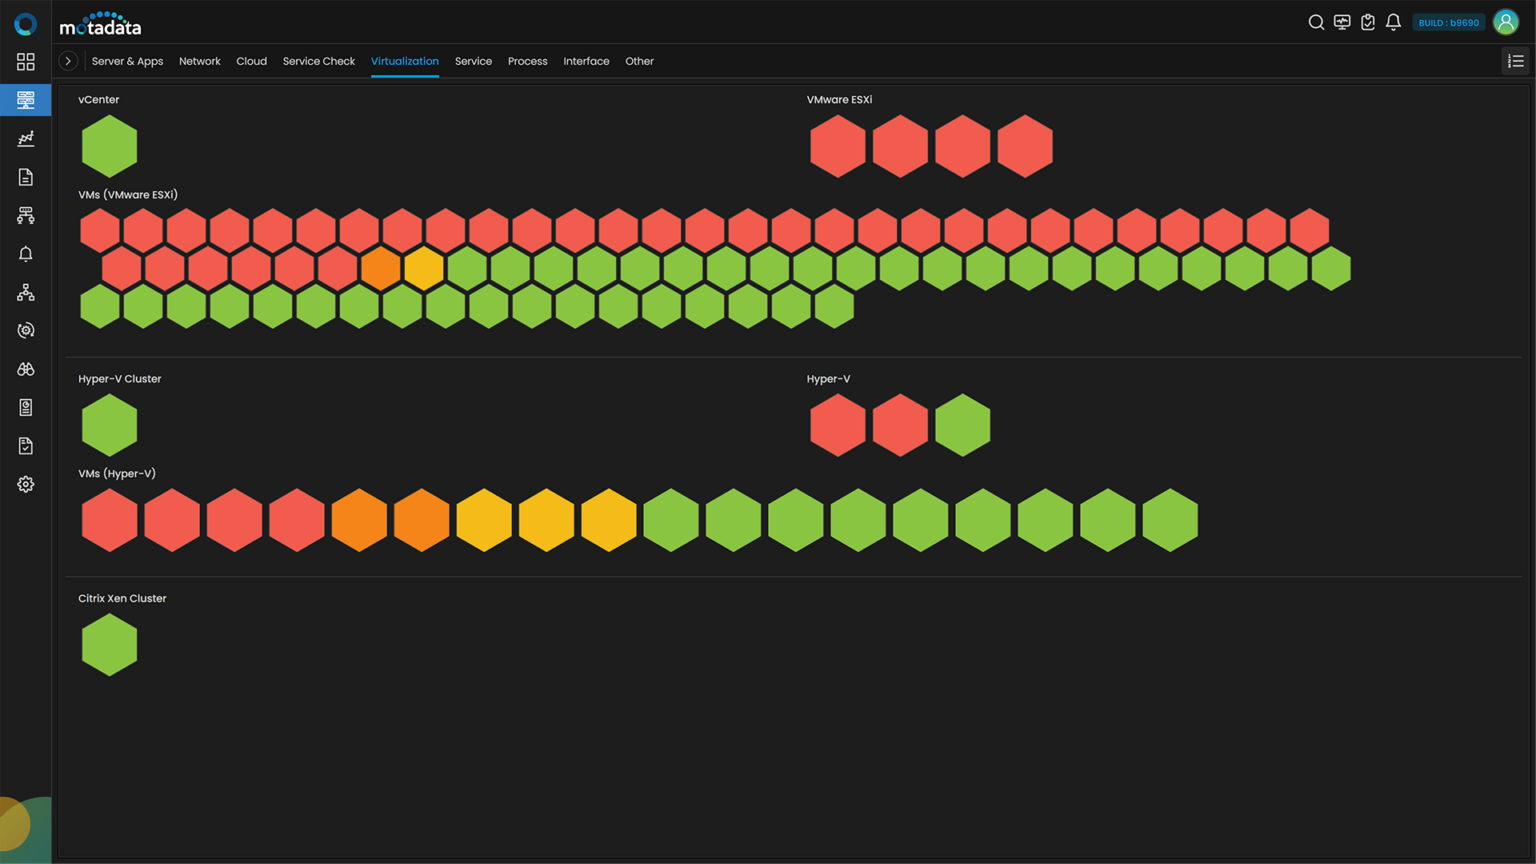
The heat map view gives you insights into the virtual machines’ status, health, and performances. In addition, it provides information about the severity, letting you make confident decisions and perform operations more efficiently.
Monitor Your Hybrid Virtualization Stack
With emerging complex IT requirements, there can be a possibility that depending on the use case, enterprises can deploy their virtual machine infrastructure on multiple platforms such as VMware, Hyper-V, Citrix Xen etc
Therefore, you can monitor and track all the critical performance metrics of different virtual machines under one dashboard. Get notified of issues that occur on any virtual machine without changing the monitoring tool.
Motadata ObserveOps aids you in appropriate capacity planning for your virtual infrastructure using VM sprawl reports. VM sprawl reports can get you in-depth details of your idle, underutilized or overutilized virtual servers.
Monitoring Virtual Machines with Motadata ObserveOps
It has AI-ML abilities that help you optimize the virtualized infrastructure. Discover the issues faster with dynamic thresholds, minimize MTTR with detailed root cause analysis, prevent issues proactively, and plan future investments with forecasting.
Dynamic and holistic topology mapping shows how data is transmitted across virtual network devices. Set thresholds for critical performance metrics and get notified whenever the thresholds are crossed, helping you streamline troubleshooting.
Identify the anomalies for the monitored resources and compare them with the historical data, helping you obtain an efficient virtual environment.
Ready to implement Virtual Machine Monitoring?
Discover how Motadata AIOps can help you monitor your infrastructure in real-time and respond to issues instantly.