All Features
Network Observability
Wi-Fi Monitoring for Enterprise Wireless Networks
Get a holistic view of all of your Wi-Fi networks and monitor the key performance metrics to boost the performance and maintain high availability. Troubleshoot network issues and proactively monitor Wi-Fi network with Motadata ObserveOps.
Wi-Fi monitoring tracks wireless LAN controllers, access points, SSIDs and connected clients, including signal quality and rogue devices, so IT teams can keep enterprise wireless coverage reliable. With Motadata ObserveOps, most of that comes down to adding your controllers. Each one hands over its access points, WLANs and clients during discovery, and Cisco, Aruba, Ruckus and Ruijie are supported out of the box.
How Does Wi-Fi Monitoring Work in ObserveOps?
You point ObserveOps at the controller, not at each access point. On a campus with a few hundred APs, that's a lot of IP addresses nobody has to type in (the controller already knows every AP, client and nearby rogue).
Cisco, Aruba and Ruijie controllers are polled over SNMP, any of v1, v2c or v3, on port 161. Ruckus is the odd one out. It's read over HTTPS on port 8443 (plain HTTP works too), and you tell ObserveOps whether it's a SmartZone or a ZoneDirector.
For a controller at a branch, pick that site's collector in the discovery profile, or leave the field blank and ObserveOps picks one. When the scan's done you tick the devices you want as monitors and polling begins. They'll show up in the Network view next to your switches and routers.
Monitor Wireless LAN Controllers for CPU, Memory and Client Load
For wireless network controller monitoring, ObserveOps tracks controller CPU and memory use, free memory, temperature and uptime, along with how many APs, WLANs and clients the controller is carrying right now.
Cisco controllers report the state of their 802.11a and 802.11b networks too. Any of these metrics can carry Warning, Major and Critical thresholds (Major at 80% CPU, for instance), and the alert goes out by email, SMS, Teams or Slack.
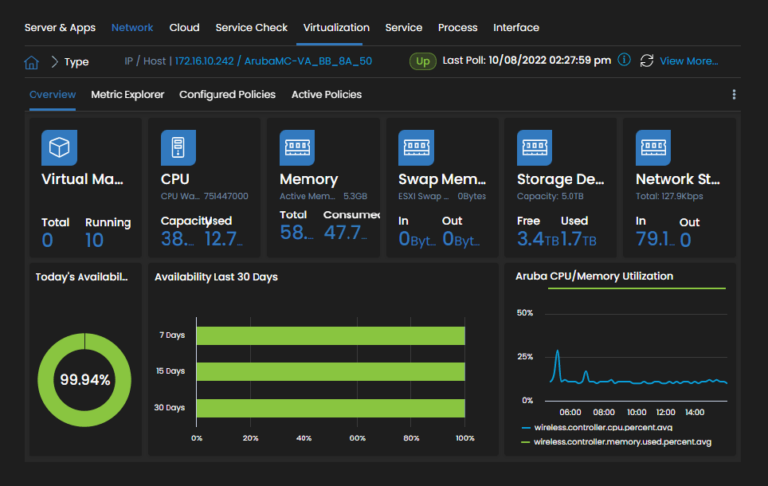
The Aruba controller overview below shows today's availability, the 30-day record and controller CPU and memory across the day.
Track Access Point Status, Channel, Power and Clients
Every AP on the controller gets its own row, with its status, model, IP and MAC address, location, group and uptime. Beyond that:
Clients per AP: Probably the column you'll sort by most. It's how you find the conference-room AP carrying 60 clients while the ones next door sit almost empty.
Radio detail: Current channel and power level per radio interface on Cisco, plus admin and operational status.
Traffic: Aruba breaks bytes and packets out by AP interface. Ruckus gives one figure per AP.
Ruckus extras: CPU, memory and a reboot counter on every AP (handy when one keeps restarting and nobody's noticed), plus a count of APs that have lost the controller.
AP groups carry over from the controller as well. If yours are set up by floor or building, a dead AP is easy to place.
See Client Signal Strength, SNR and SSID Usage
ObserveOps lists every connected client with its IP address, username and OS type, plus the AP and WLAN it's on, its channel and how much traffic it's moving. Signal strength is reported in dBm for all four vendors. SNR only comes from Cisco and Ruckus (Aruba doesn't expose it).
Low SNR on a busy channel usually points to interference or a badly placed AP rather than a bandwidth limit, which saves you from chasing the uplink first. Ruckus also grades its own clients as excellent, healthy or warning, and ObserveOps keeps those counts.
SSID usage is tracked per WLAN:
Client count and traffic for each SSID (Aruba and Ruckus), so a guest network eating the bandwidth is easy to spot.
WLAN status and ID on Cisco, and up and down APs per WLAN on Aruba.
Authentication type and encryption for each Ruckus WLAN.
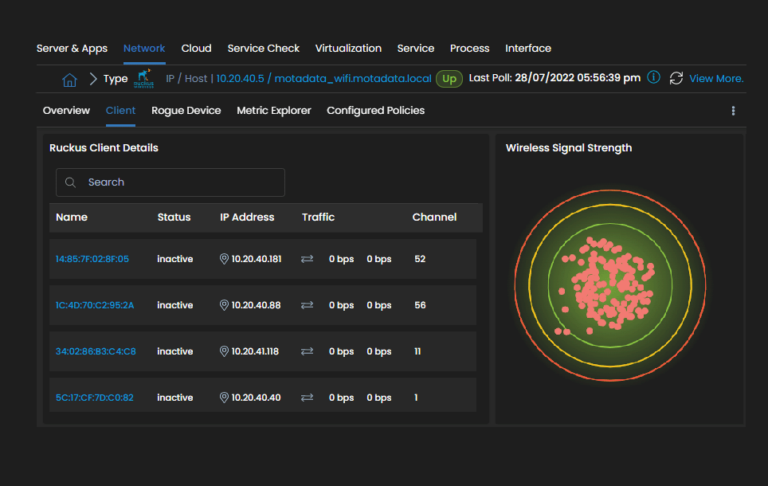
The Ruckus client view below lists each client with its status, IP address, traffic and channel, with a signal strength chart beside it.
Detect Rogue Access Points and Clients Near Your Network
Your controller already scans for radios it doesn't recognize. ObserveOps pulls that rogue list in and keeps it with the rest of your wireless data, so you don't have to log in to each controller to check it.
For each rogue AP you get its name, MAC address, channel, class type, state and when it was last detected (Ruckus adds encryption, which is how an open hotspot named after your office stands out). Rogue clients come with the SSID they joined and the AP they're associated with. Counts of rogue APs and rogue clients are tracked as metrics too, so a sudden jump can trigger an alert.
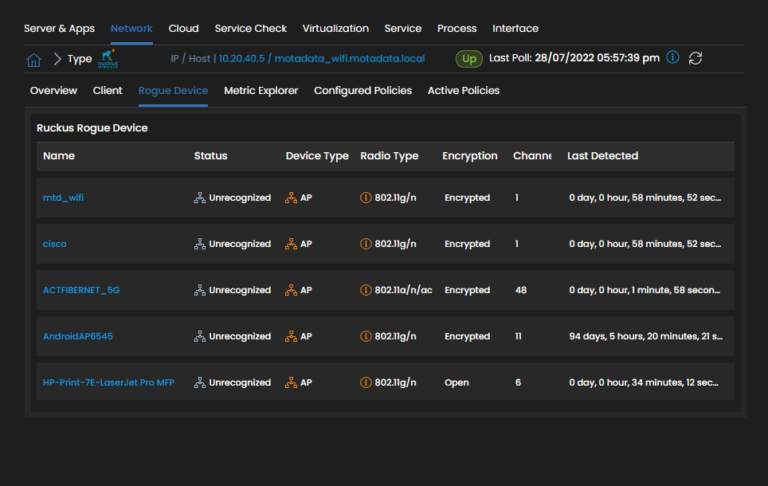
The Ruckus rogue device list below shows unrecognized APs with their radio type, encryption, channel and last detected time.
Monitor Cisco, Aruba, Ruckus and Ruijie Wireless from One Console
ObserveOps ships wireless integrations for the controllers most enterprises run, and they all land in the same dashboards, alert policies and reports.
Vendor | Protocol | What's Covered |
SNMP | Controller, APs and radios, WLANs, clients with SNR and dBm, rogue APs and clients | |
SNMP | Controller, APs, per-WLAN traffic and AP counts, clients with dBm, rogue APs and clients | |
HTTP or HTTPS | SmartZone and ZoneDirector, AP health and reboots, WLAN security, client health and SNR, rogue APs | |
SNMP or API | Controller, APs, WLANs, clients with dBm, rogue APs |
Extreme wireless controllers can be discovered over SNMP as well. The wired side of the same network (the switches your APs plug into) is covered by LAN network monitoring.
Keep Enterprise Wi-Fi Reliable with Motadata ObserveOps
Motadata ObserveOps monitors your wireless LAN controllers, access points, SSIDs and clients from one discovery run per controller, and it keeps the rogue devices your controllers hear in the same place. Alerts fire by severity on any of these metrics.
Wi-Fi sits in the same console as your switches, routers, flows and logs, as part of network observability. So when users on one floor complain, you can check the AP, the switch port it's plugged into and the uplink without opening another tool.
Run ObserveOps on premises or in your own cloud, on a single server or in distributed, high availability and disaster recovery setups. Remote collectors can poll the controllers at each site, and your monitoring data stays on infrastructure you control.
Ready to implement Wi-Fi Monitoring for Enterprise Wireless Networks?
Discover how Motadata ObserveOps can help you monitor your infrastructure in real-time and respond to issues instantly.