The recent high-frequency trading scenario works in a way that every second matters. Even the smallest technical glitch can lead to huge disruptions in transactions and cause severe financial and reputational losses. To overcome this, the Securities and Exchange Board of India (SEBI) has introduced the Log Analytics and Monitoring Application (LAMA) framework, an initiative aimed to improve transparency, reliability, and accountability in digital trading infrastructure.
Motadata supports this vision by offering an out-of-the-box LAMA integration that enables you (i.e., if you are a stockbroker, exchanges, and related financial institution) to stay compliant with SEBI’s regulations effortlessly.
What is LAMA?
LAMA is a SEBI-mandated logging and monitoring model designed to:
- Monitor real-time health of applications and infrastructure.
- Collect and retain comprehensive log.
- Enable secure log forwarding to a centralized system.
- Support early detection of outages, anomalies, and performance bottlenecks.
- Maintain accountability with secure audit trails and long-term storage.
According to SEBI’s definition, any malfunction happening in a stockbroker’s system, including issues in hardware, software, networks, or third-party services that results stoppage or degradation in system performance for five continuous minutes or more is a technical glitch.
Whether you are part of a stock exchange, clearing corporation, or a depository, LAMA is built to help in ensuring system integrity, transparency, and quick incident response while it doesn’t depend on your working culture.
How Motadata Helps Implement LAMA
Motadata’s integrated LAMA module allows financial institutions to:
- Create and manage LAMA profiles directly within the platform.
- Automate token generation and lifecycle.
- Collect all SEBI-mandated KPIs from multiple geographies (groups).
- Send logs and metrics securely to SEBI’s LAMA server every 5 minutes.
Note: SEBI mandates a default data interval as 5 minutes. So, it is suggested that you should not alter this input during configuration in Motadata.
Creating a LAMA Profile in Motadata
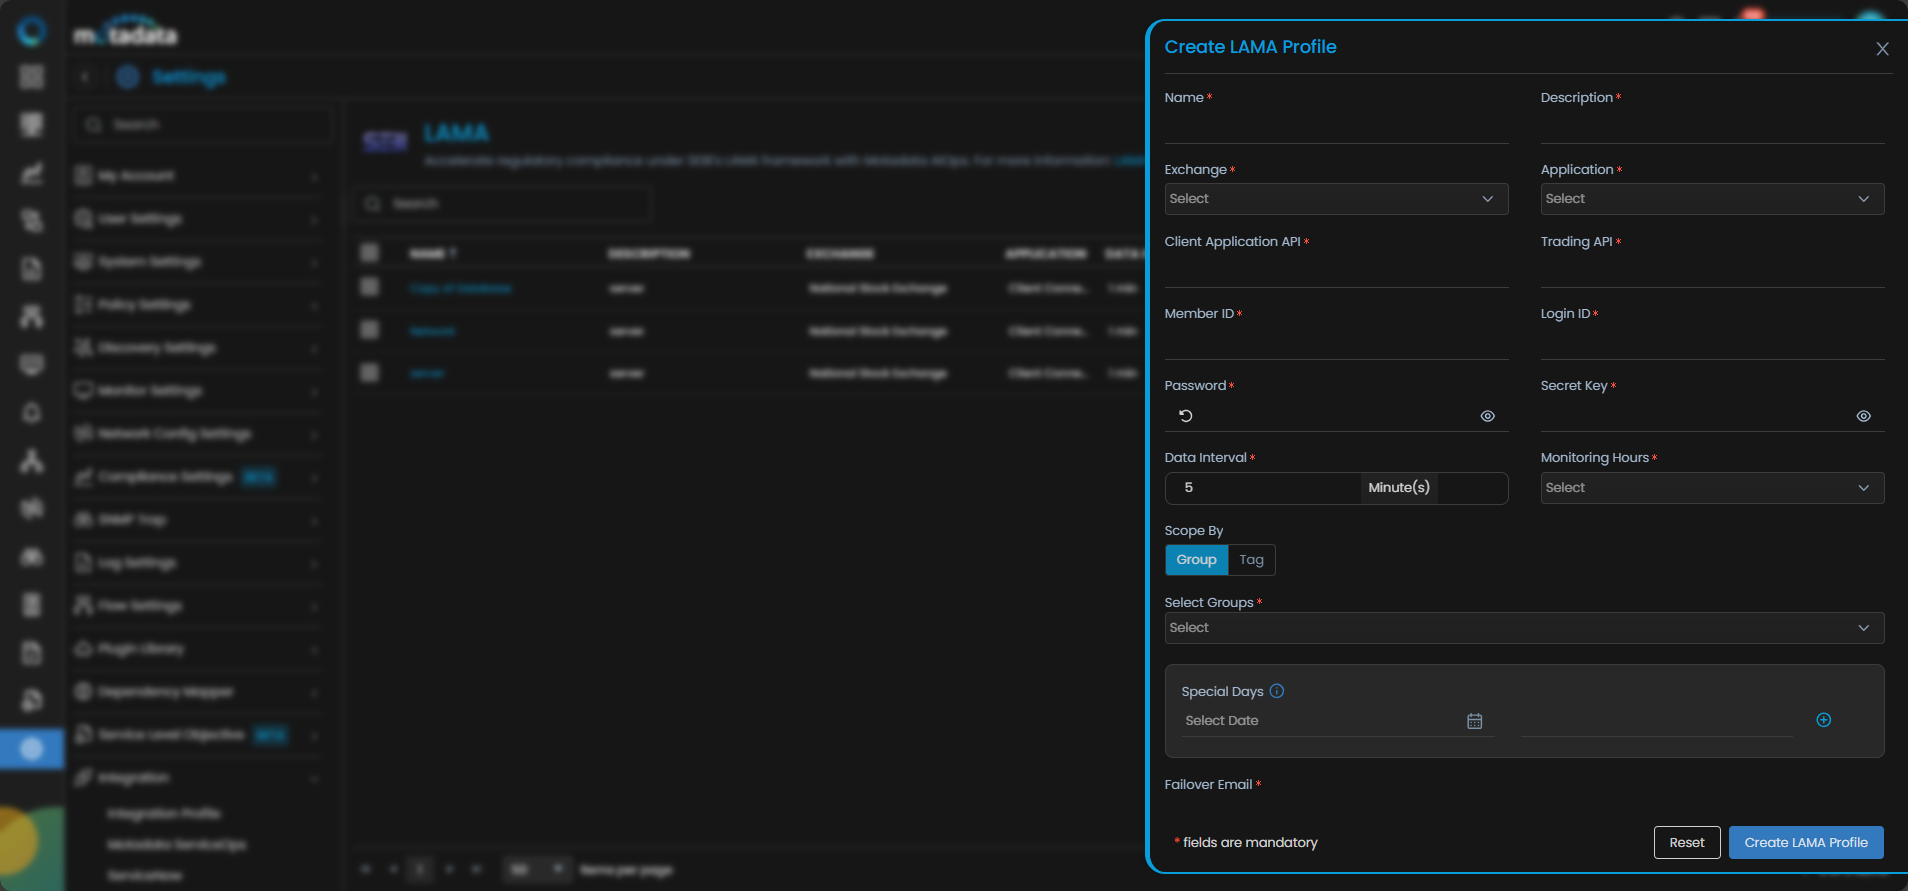
To integrate LAMA profile in Motadata AIOps, users must first create a LAMA Profile. This is where you (brokers and/ or financial firms) input their authentication details.
| Field | Description |
| Exchange | Select the exchange you’re reporting to (e.g., NSE, BSE, etc.). |
| Application | Select the type of the trading application being monitored (client connectivity, OMS, RMS, etc.). |
| Member ID | It is a unique ID assigned by the exchange to your trading entity. |
| Login ID | It is a user login credential used to authenticate with SEBI’s system via the LAMA API. |
| Client Authentication API | The endpoint used for generating the secure access token for LAMA API communication. |
| Trading API | The API is used to send trading performance data to SEBI’s LAMA server. |
| Password & Secret Key | These are the credentials needed to securely authenticate and generate access tokens. |
| Data Interval (Default: 5 mins) | The frequency at which data is collected and reported. The default interval is set for 5 minutes as per SEBI mandate. It is advised to not to update this interval. |
| Monitoring Hours | Define the hours during which your system is monitored (e.g., trading hours from 9:00 AM – 4:00 PM). |
| Scope by (Group or Tag based) | This selection allows you to filter your infrastructure application(s) and/ or devices for which you want to report your data with LAMA based on either by Group (location) or Tag (function). |
| Special Days | Specify non-trading or holiday days when reports shouldn’t be sent. |
| Failover Email | Provide email address to be notified if data transmission to LAMA fails. |
Motadata AIOps helps in a way that the data gets automatically packaged and forwarded to LAMA at the pre-set intervals, and no manual intervention is required.
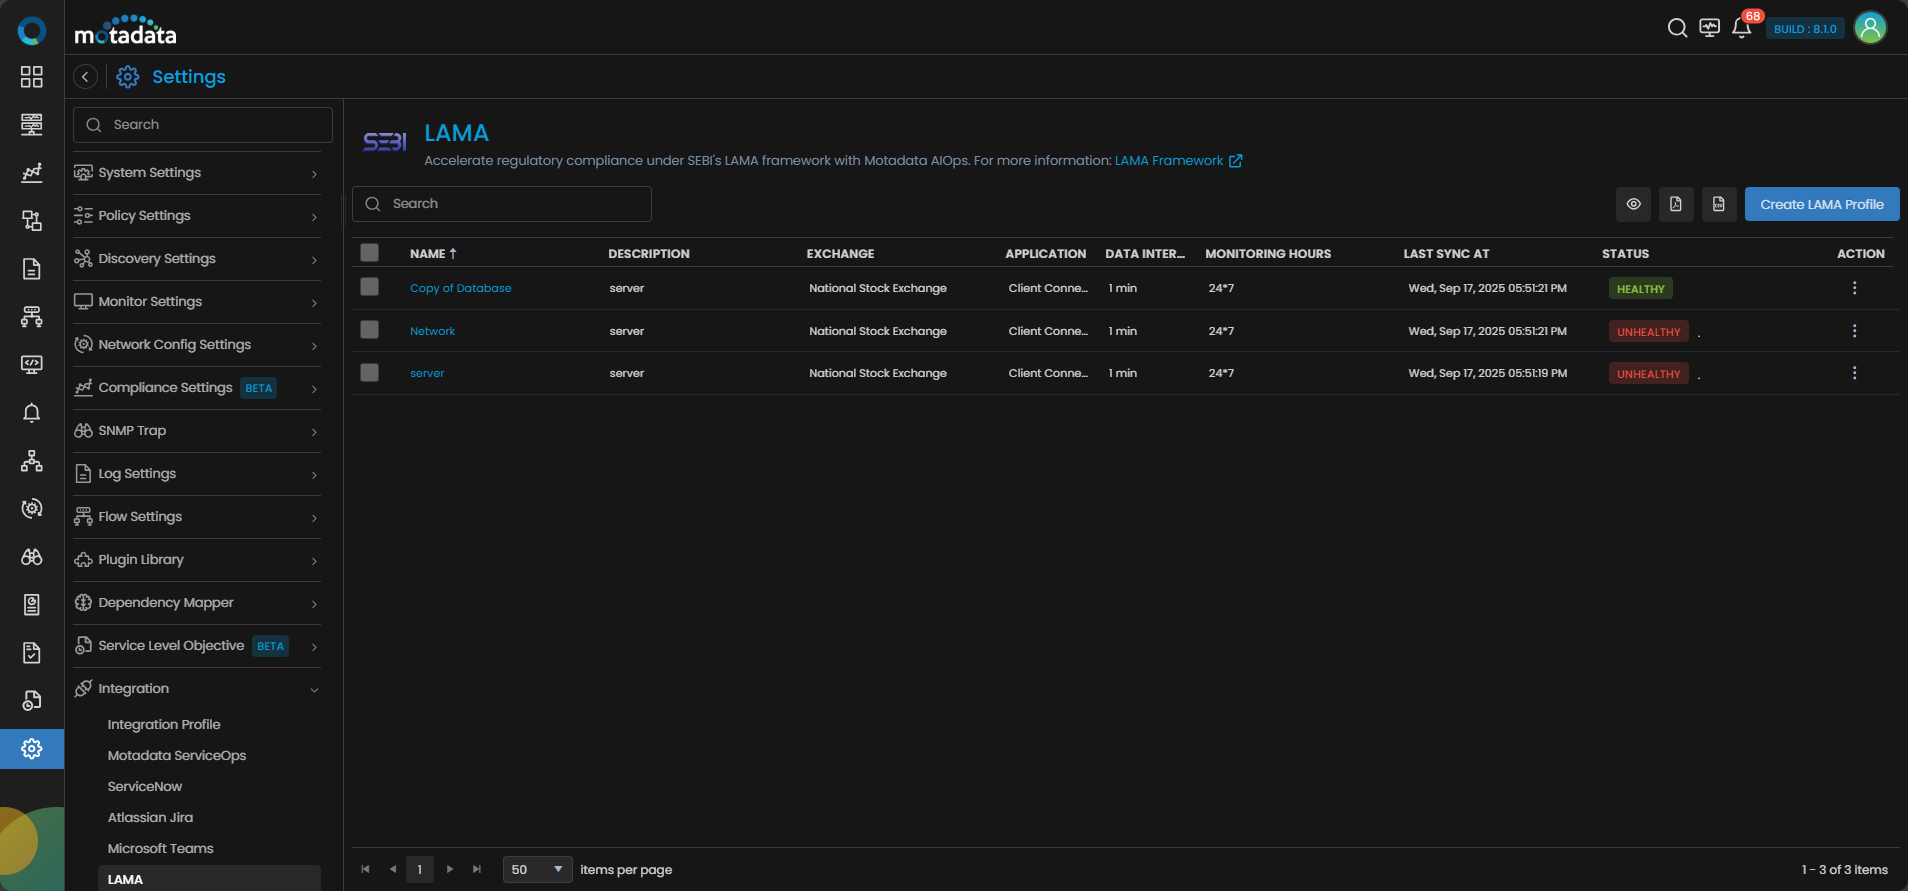
Once the profile is created, users can view and monitor the health of each trading entity under the LAMA Integration.
Each row represents a trading segment like NSE Equity, BSE Currency, or MCX Commodities, along with its metadata. You can find Status displaying Healthy/Unhealthy value. The action icon provides options to Edit, Clone and Delete the LAMA profiles.
Compliance Made Seamless
With Motadata, you can:
- Define multiple LAMA profiles for different exchanges.
- Automated data transfer and health status reporting.
- Track sync failures and correct them immediately.
- Stay audit-ready with minimal operational overhead.
Whether you’re monitoring NSE Derivatives or BSE Currency, the platform keeps your LAMA compliance on autopilot mode, while letting you focus on what matters most to you for trading and business continuity.
Embrace LAMA With Confidence
Motadata empowers institutions to move beyond compliance and adopt a proactive, resilient, and insightful approach to SEBI’s LAMA framework. With built-in KPIs, secure API integrations, and centralized dashboards, you gain full visibility and control without the complexity.


