The overall health and performance of web servers is imperative for the well-being and availability of your business-critical apps.
Well, the question is how do we ensure good health and performance of the web servers all the time? This is when web server monitoring comes into play.
Web Server Monitoring is essential for enterprises as their IT infrastructure grows and includes numerous elements that keep running network operations. Therefore, it is important to monitor web servers to ensure they are always up and running.
Motadata AIOps helps you do just that with advanced monitoring features. With Motadata AIOps, you can perform a proactive approach to identify the potential issues as effectively as possible before they interrupt the user experience.
Web Server Monitoring Applications
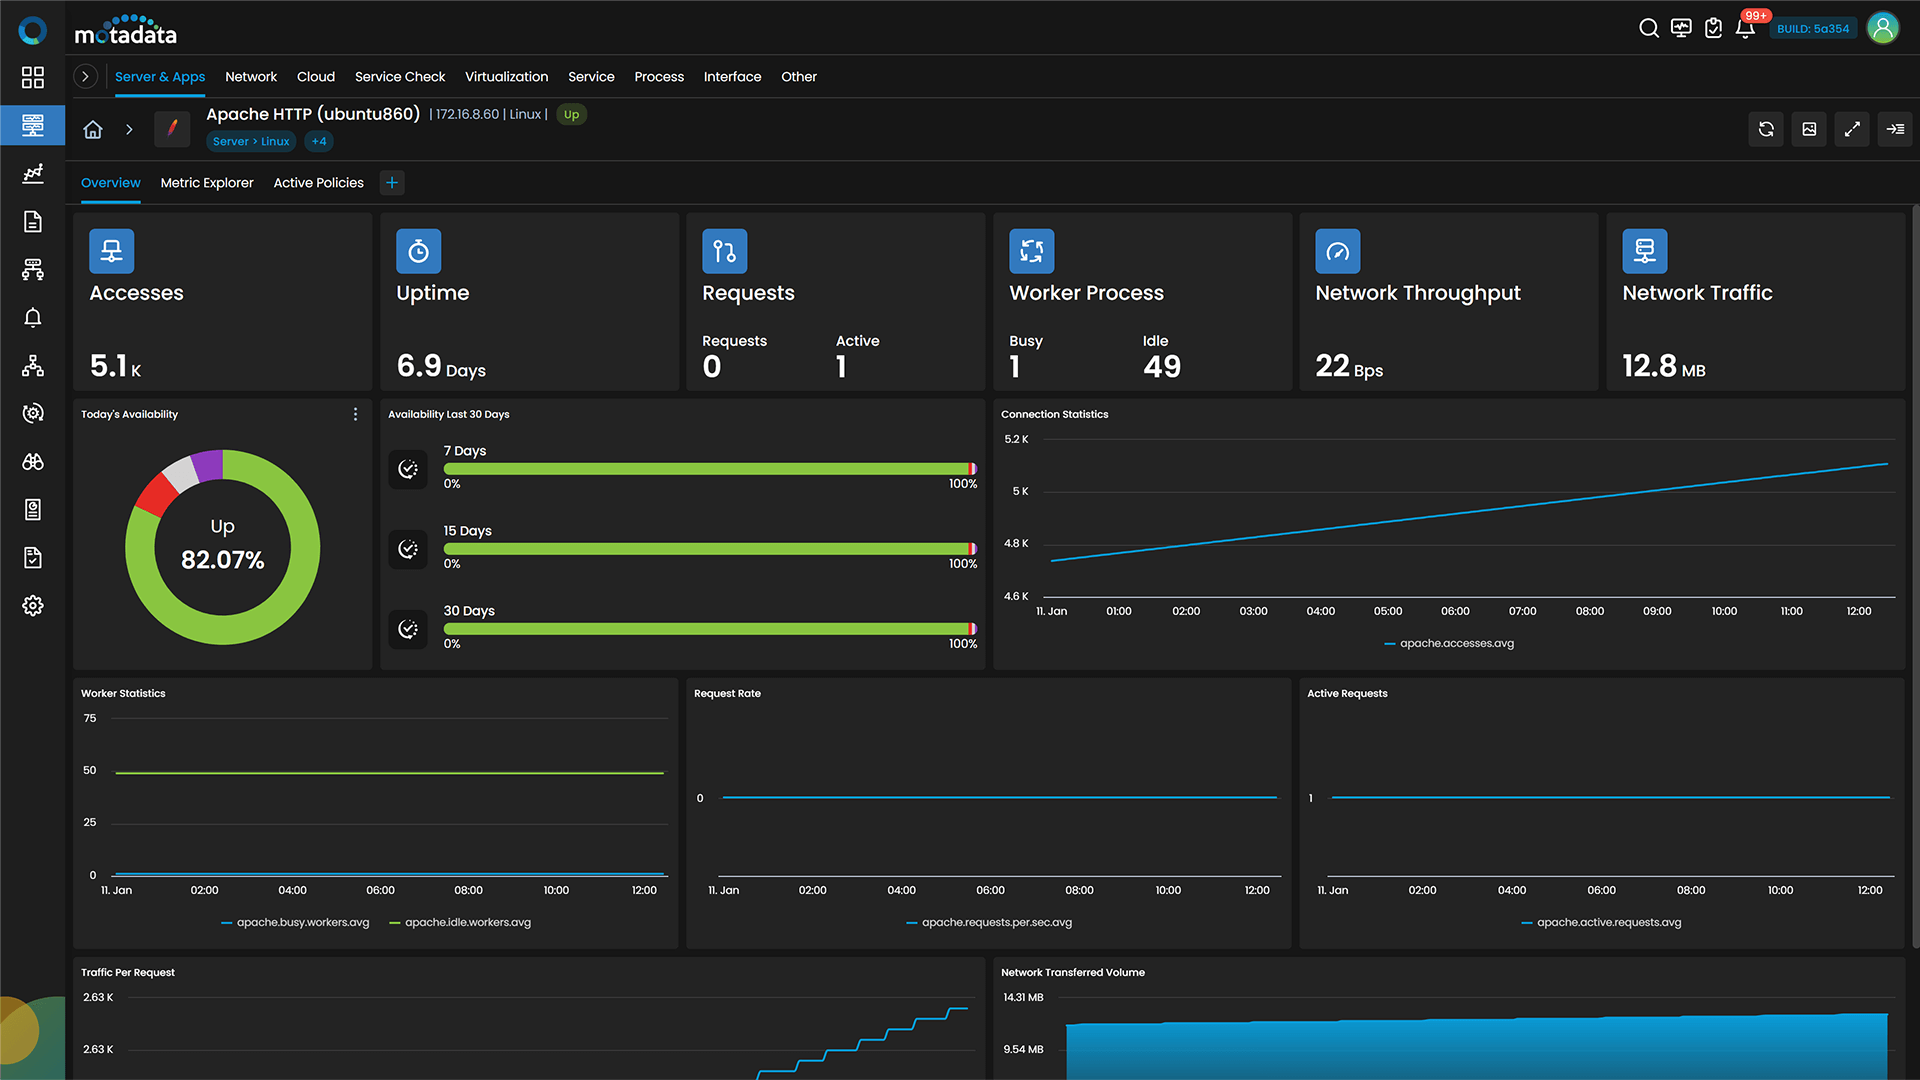
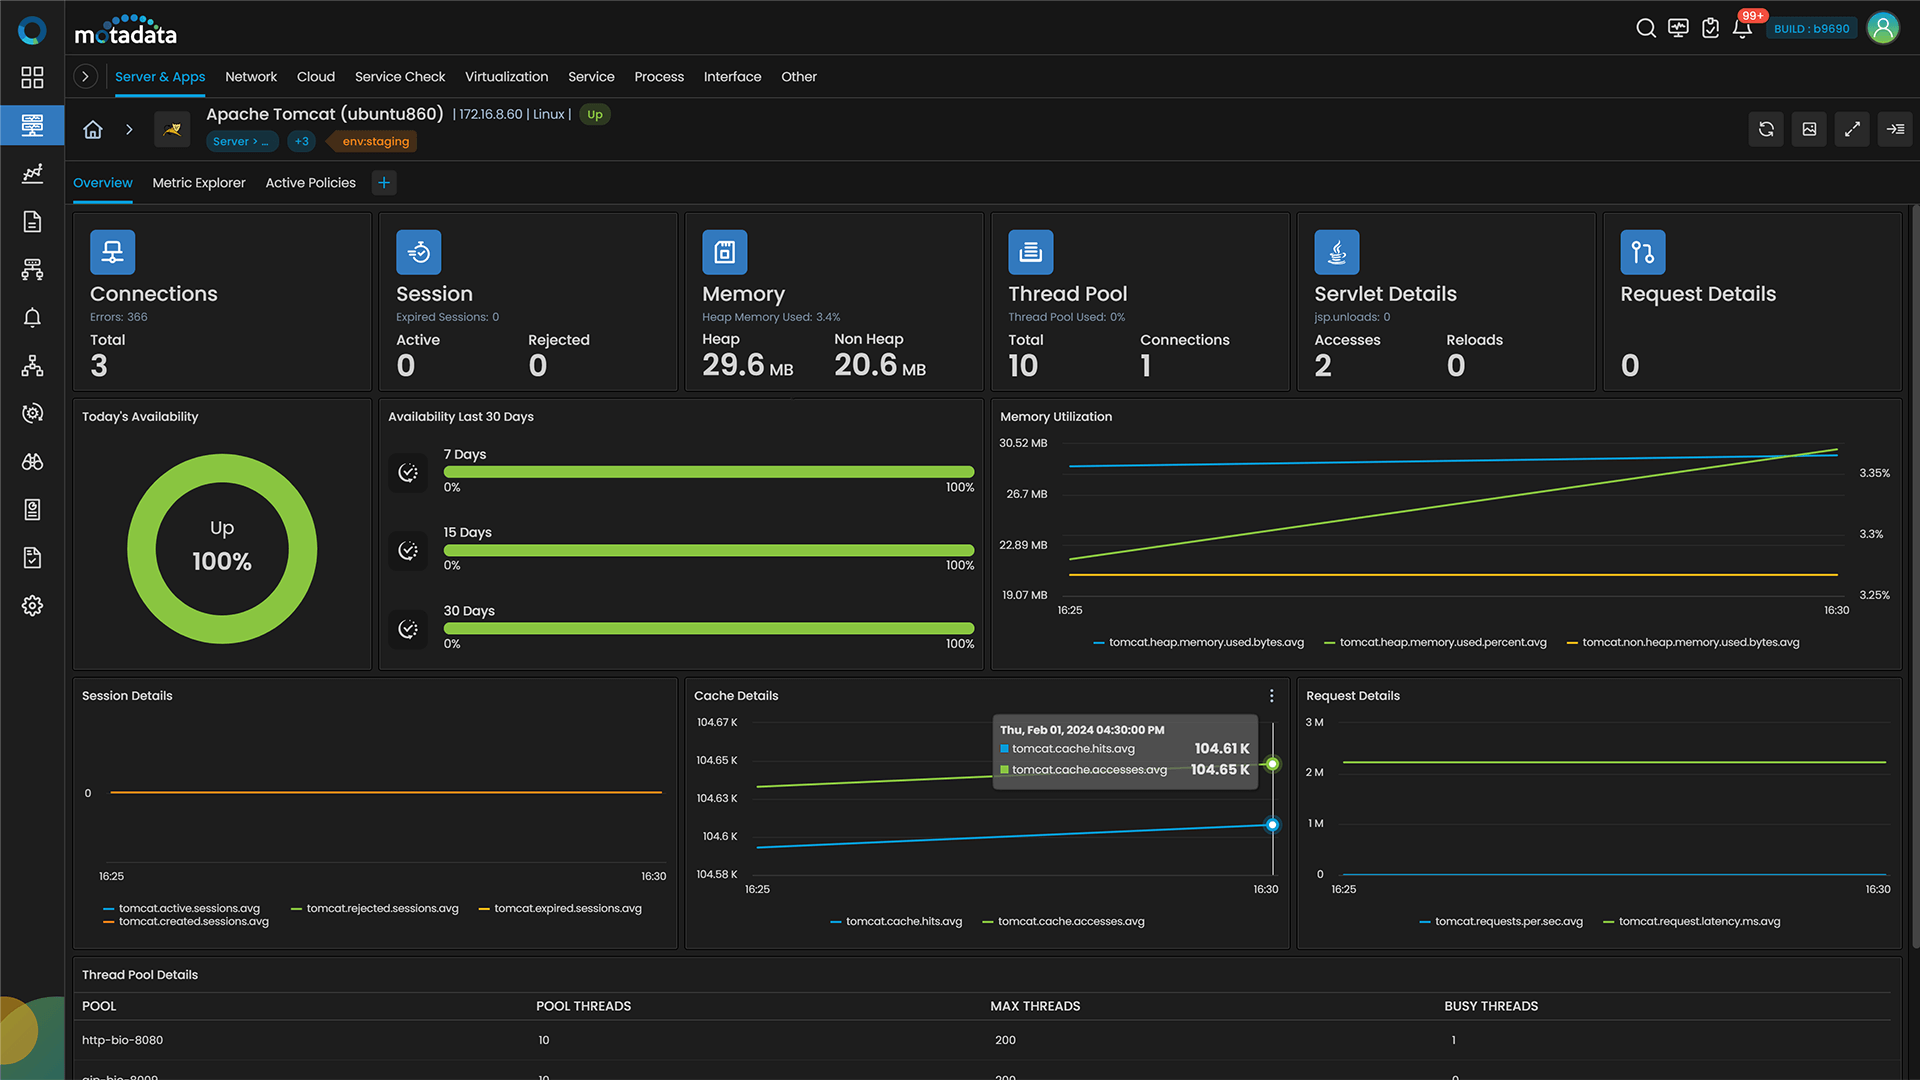
The metrics can be collected from various web server applications such as Apache HTTP, Tomcat, Lighttpd, Microsoft IIS, Nginx, etc.
The detailed and out-of-the-box reports provided by Motadata AIOps help you gain insights into the trends of the servers with key web server monitoring metrics.
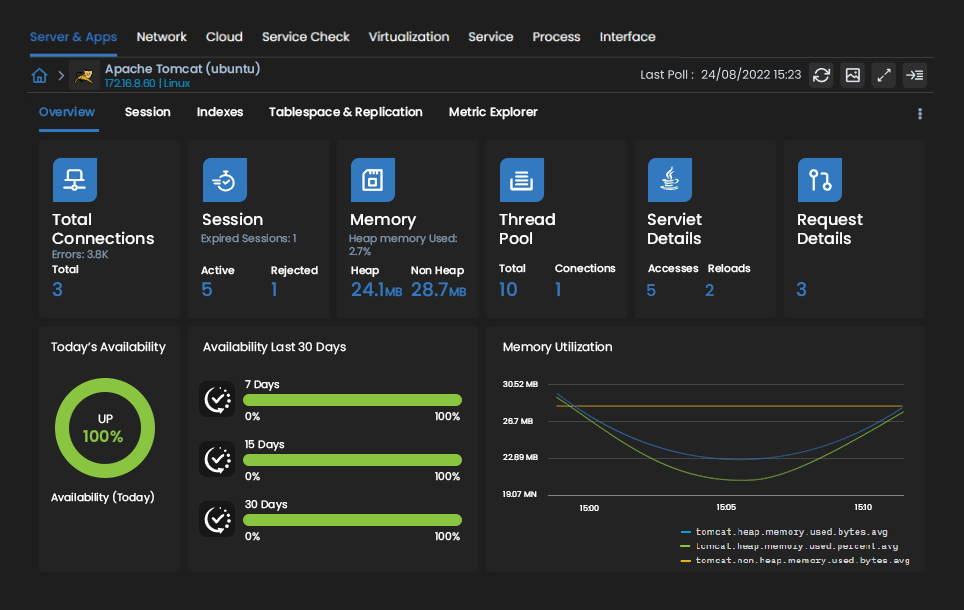
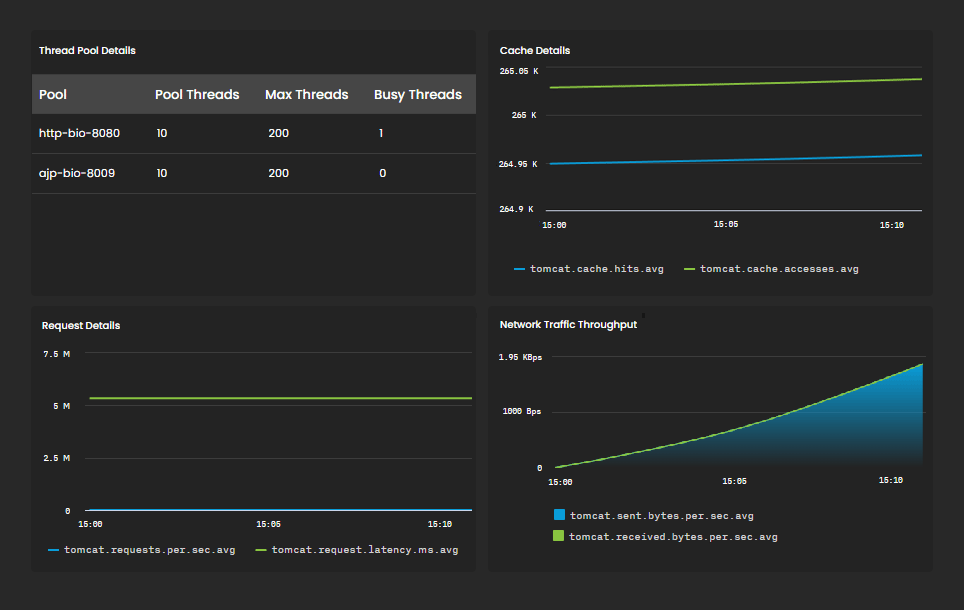
The web server monitoring solution also offers statistical reports with performance graphs for key performance metrics like IOPS, Thread Pool details, session statistics, etc. These reports help you visualize the performance data and analyze overall web server performance.
Monitor Web Server Performance
Monitoring web server performance ensures you get deeper into the details, analyzing metrics like requests per second, average and peak response times, session time and more. All such performance metrics help you get insights on the efficiency users receive while interacting with the application.
After monitoring such metrics, let’s say you identify slow response time, then with Motadata AIOps you can find out the root cause of the issue, ensuring whether the web server is performing seamlessly or not.
In addition, metrics like the session statistics, Thread Pool , Hit Ratio Percentage, and the used and free memory provide complete visibility into web server activities and performance.
In addition, regular web server performance monitoring alerts you whenever there’s a performance issue so that you can resolve the problems based on priorities and severity, saving your server from inevitable damage. Monitoring Web server also helps network admins configure dynamic baselines for the performance metrics for anomaly detection.
For example, you can set a threshold to key web server performance metrics, detect the bottlenecks as they occur, and configure automation to take actions automatically and resolve them before they disturb web server performance.
Transaction-related KPIs
You can know the overall performance of your web servers through all the transactions that take place in your web server. This will help you get a faster access to your end-users.
List of Important KPIs for Web Server.
| Sr. No. | Counter | Description |
|---|---|---|
| 1. | apache.traffic.volume.bytes | Traffic volume in bytes |
| 2. | apache.traffic.bytes.per.sec | Traffic bytes per second |
| 3. | apache.requests.per.sec | Requests per second |
| 4. | lighthttpd.requests.rate | The rate of requests in Lighthttpd. |
| 5. | lighthttpd.traffic.volume.bytes.rate | The rate of traffic volume in bytes in Lighthttpd. |
| 6. | iis.traffic.volume.bytes | Total volume of traffic in bytes handled by IIS. |
| 7. | iis.active.connections | Number of active connections to IIS. |
| 8. | iis.bytes.per.sec | Rate of total bytes (sent + received) per second. |
| 9. | Rate of total bytes (sent + received) per second. | Rate of file transfers per second by IIS. |
| 10. | iis.app.cache.hit.ratio.percent | The percentage of cache hits for the IIS application. |
| 11. | iis.app.active.requests | The number of active requests for the IIS application. |
| 12. | iis.app.sessions | The number of sessions for the IIS application. |
| 13. | iis.app.requests | The total number of requests for the IIS application. |
| 14. | iis.app.transactions | The total number of transactions for the IIS application. |
| 15. | Nginx Active Connections | The number of currently active connections to the Nginx server. These connections represent clients that are currently sending or receiving data. |
| 16. | Nginx Requests Rate | The rate at which requests are being made to the Nginx server. This metric indicates the incoming request load on the server. |
Dashboards and Reports
Motadata AIOps is designed on a Deep Learning framework with AI-ML capabilities that offers a wide range of features and out-of-the-box monitoring tools for web applications.
For example, the built-in dashboards let you monitor the availability and performance of web applications across your server and provide real-time status data.
Get Motadata AIOps and ensure healthy server operations across your enterprise’s IT infrastructure.