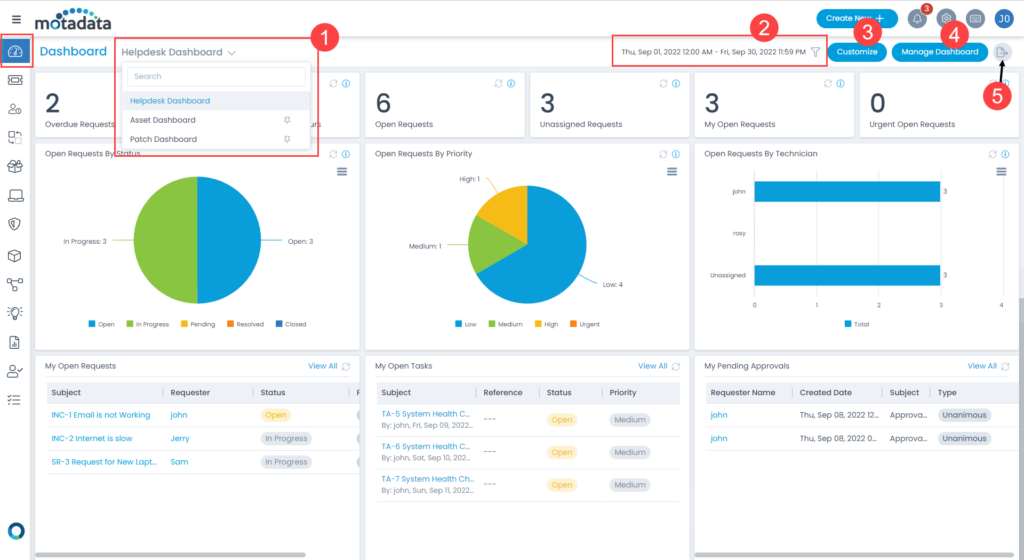
Predefined Widgets
Currently, Motadata gives few Predefined Widgets out of the box. Each of them have different set of parameters. These Widgets support the following operations:
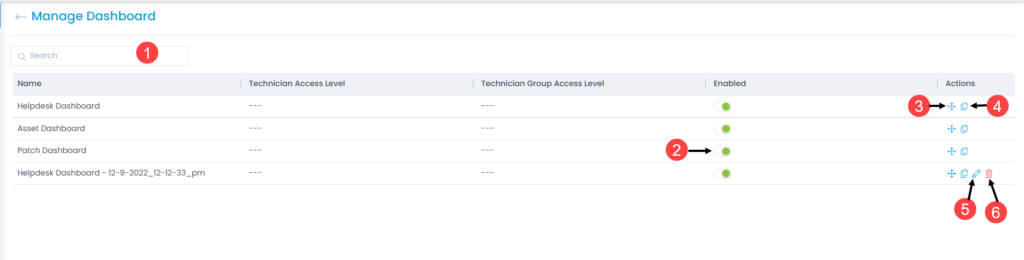
- Predefined Widgets can be added to all kinds of Dashboards by their respective owners.
- The super user is the default owner of all Predefined Widgets.
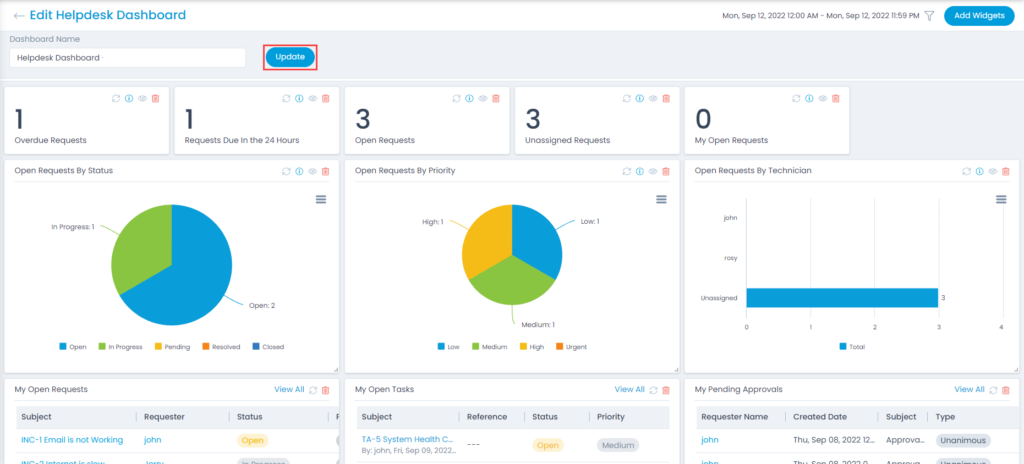
- Only the super user can modify (even add Widgets) a Predefined Dashlet but cannot delete it.
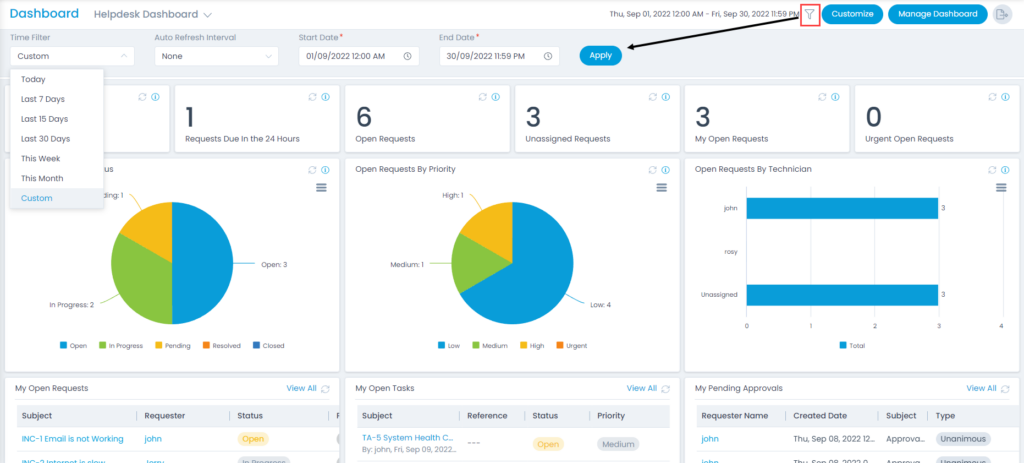
- The options to ignore time and location filters are disabled for Predefined Widgets.
Predefined Widgets are spread across all Dashlet types (KPI, Widget, and Shortcut), they are as follows:
1. KPIs:
They display a total count of the following:
- Missing Patches awaiting for Approval
- Patches Released in Last 30 Days
- Vulnerable Systems
- Health Systems
- Missing Antivirus Patches
- Missing Security Patches
- Missing Patches
- Installed Patches
- Applicable Patches
- Expired Software License
- Total Non IT Assets
- Total Prohibited Softwares
- Total Managed Softwares
- UnAssigned Hardware Assets
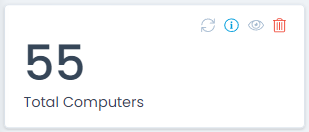
- Total Computers
- Hardware Assets
- Open Changes
- Open Releases
- Open Problems
- Closed Requests
- Urgent Open Requests
- My Open Requests
- My Requests Due in the 24hours
- My Overdue Requests
- Requests Due in the 24hours
- Overdue Requests
- Unassigned Requests
- Open Requests


2. Widgets:
They display a column graph which shows the following:
- Monthly OLA Violation Count By Technician Group
- Monthly OLA Violation Count By Technician
- Severity Wise Missing Patches Awaiting Approval
- Category Wise Missing Patches
- Severity Wise Missing Patches
- OS By Computers
- System Heath Dashboard
- Open Request Count by Category
- Software Count by Software Category
- Software Count by Software Type
- Count of Hardware Asset by Location
- Count of Hardware Asset by Vendor
- Count of Hardware Asset by Product
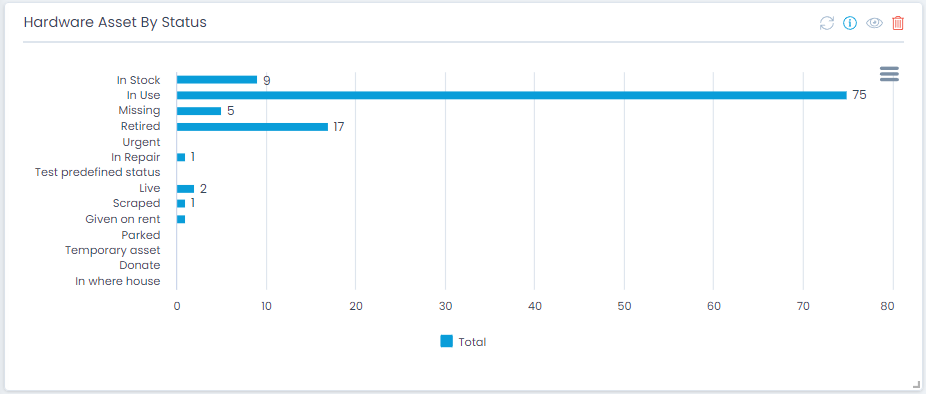
- Count of Hardware Asset by Status
- Count of Daily closed Requests
- Daily Incoming Requests Trends
- Count of Reopened Requests By Technician
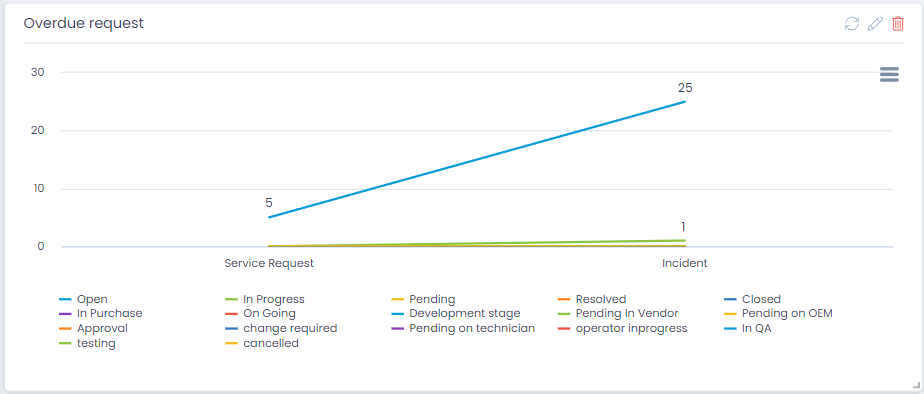
- Count of Overdue Requests By Technician
- My Open Requests By Priority
- My Open Requests By Status
- Open Requests By Technician
- Open Requests By Priority
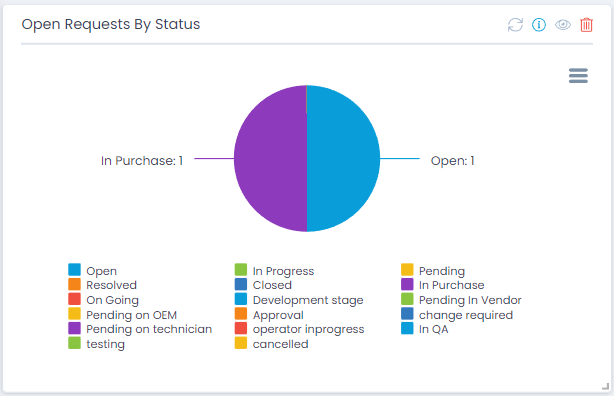
- Open Requests By Status
3. Shortcuts:
- My Pending Approvals
- My Open Requests
- My OpenTasks