Log Management Software
Log Analyzer with Context
Collect, Analyze, Visualize, and Diagnose with your Log Data along with Metrics for Complete Visibility at Scale
Unified Log Management with Full-stack Monitoring
The Motadata log analysis tool is designed to help organizations to collect, analyze, monitor, and visualize the log data for rapid investigation, troubleshooting, and higher-level analytics. Effortless collection methods unify logs along with metrics and streaming data for a centralized view with deeper context to analyze log events.
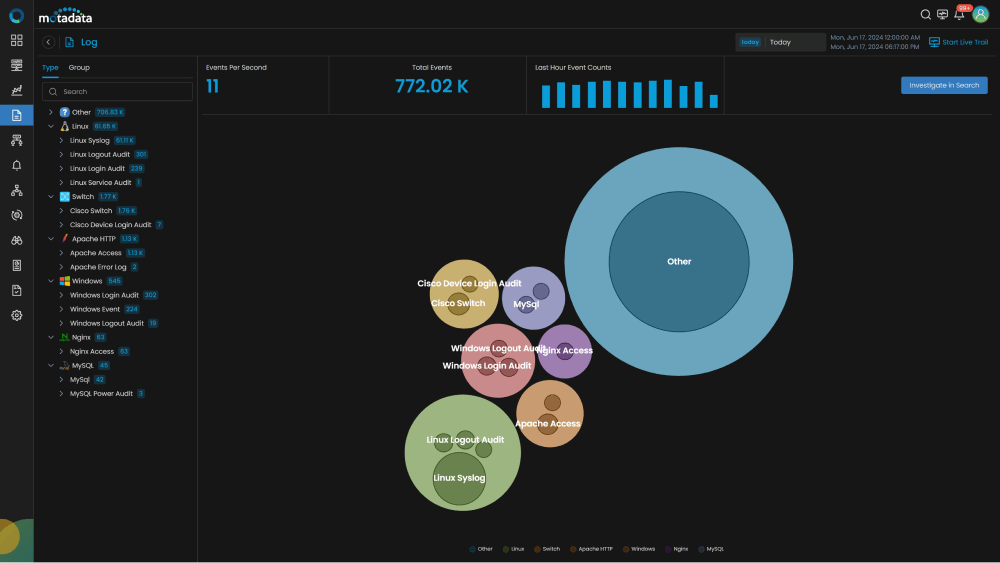
Actionable Insights for Services, Apps, Systems, Devices
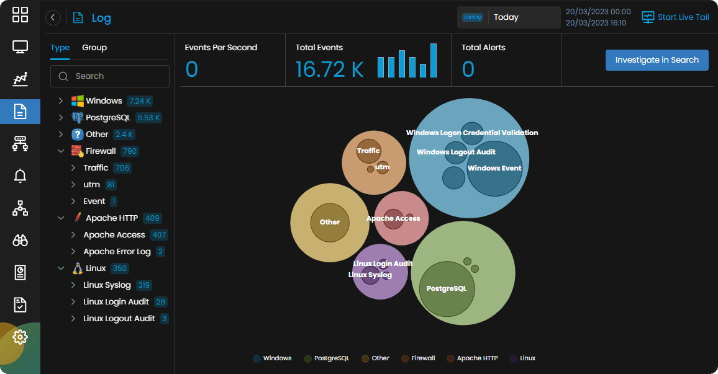
As logs are forwarded, Motadata immediately clusters the received log data in real-time and intelligently surfaces trends in log activity.
- Collect and Correlate: Collect logs from a heterogeneous environment with agent-based or agent-less collection methods. Correlate your logs and metrics via email, Slack, and other channels.
- One-Stop Solution: One robust agent that collects any type of data or format from any kind of source. One-stop solution to install, configure, and scale.
- On-demand Customization: Stay in Compliance with log retention, audit, or regulation for legacy log reporting policies based on your organization’s requirements.
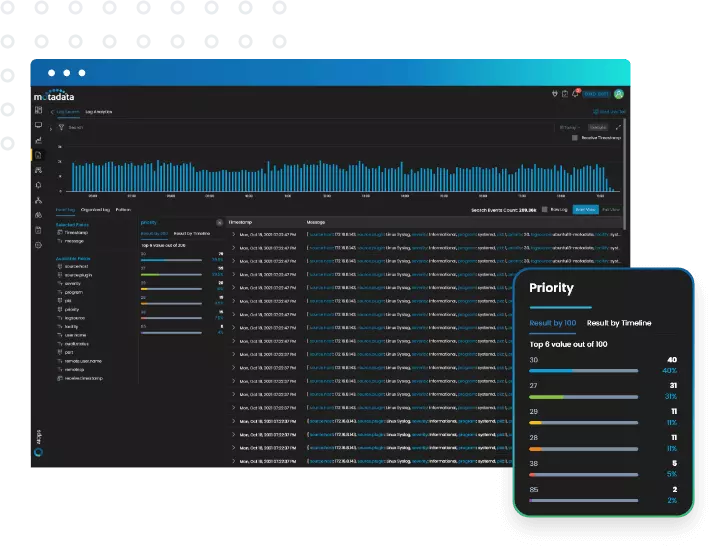
AI-Based Log Analysis
Make machine learning and advanced log analysis level up your investigation and troubleshooting. Monitor and manage your log data with a Log management solution that is easy to deploy and effortless to manage.
- Centralized Configuration: Log pattern analytics for rapid insight across millions of log events. Store and connect your logs data in a centralized location to detect anomalies and respond to them more quickly.
- Reduced MTTR: Use log clustering to consolidate operational visibility for all your applications and services. Troubleshoot with 100+ out-of-box Log Parsing apps, which group surrounding logs to search in seconds.
- Advanced Log Analysis: Monitor, analyze, and diagnose hybrid and multi-cloud environment issues with a unified platform — get advanced log file analysis in real-time driven by machine learning.
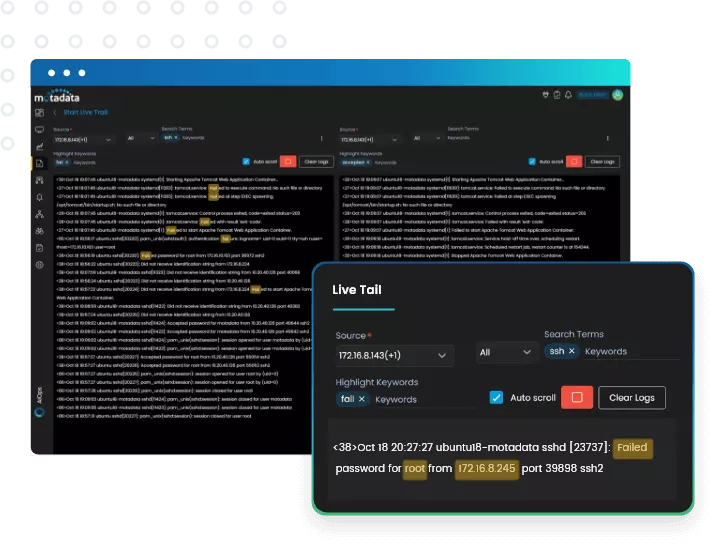
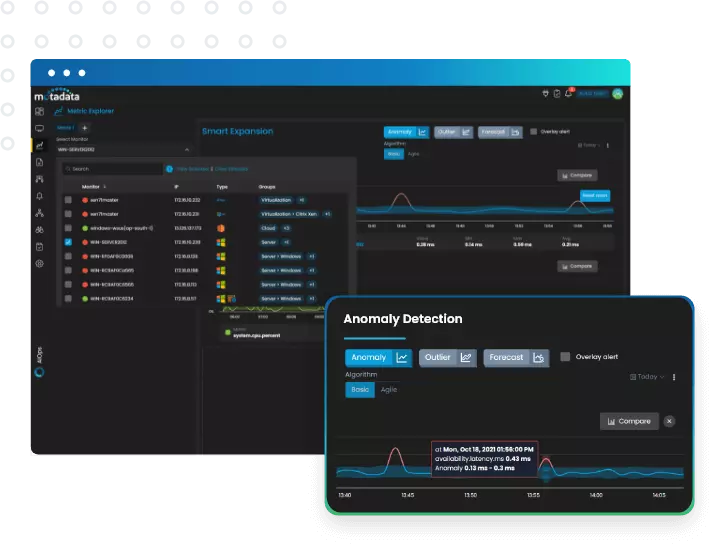
Live Tail and Alerting
Eliminate blind spots with full support for hundreds of log sources including on-premise to cloud and everything in between. Spend less time on configuration and more time on insights.
- Smart Alerting: Use anomaly detection to automatically identify abnormal behavior. Get the alerts you want to be notified about and receive them via email, Slack, and other channels.
- Live Log Tail: Put live tail in action to see the live feed logs data from multiple sources. Intelligently analyze and aggregate log events across apps, devices, systems.
Unlocking Powerful Insights with Log Monitoring Tool
Our exceptional Log Monitoring tool provides unparalleled visibility into the health and performance of your applications, databases, servers, networks, and more. By leveraging the wealth of information stored within these logs, you gain a deeper understanding of your systems, enabling you to maintain the data records in a synchronized way.
Logs act as a digital security camera, recording every action within your system. This allows you to detect suspicious activity, identify potential security breaches, and take swift action to mitigate threats. The software also provides insights into system resource utilization, application behavior, and network traffic patterns. By analyzing these trends, you can identify areas for improvement and optimize your infrastructure for peak performance
Out-of-the-Box Log Management
Massive volumes of log data produced by modern infrastructure are difficult to store and process. Effective log management also requires having all log data accessible in one place.
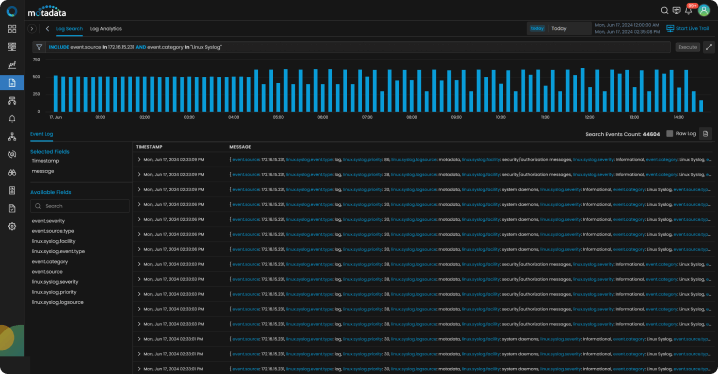
Motadata Log Management tool dynamically parses and visualizes millions of lines of log data. Machine learning-powered pattern matching lets you quickly identify relevant logs and observe their live trails in real-time.
Log monitoring alerts are the most effective way to safeguard your infrastructure’s integrity and security. At Motadata, we recognize how important preventive measures are for maintaining operational efficiency.
Our sophisticated log monitoring system ensures that you can quickly identify any security risks and keep an eye on critical infrastructure events. You can handle problems before they become worse through real-time notifications, ensuring the dependability and security of your systems.
Key Features of Motadata Log Management Tool
Motadata’s comprehensive event log analyzer provides the following procedural features:
-
Collect
With Motadata, you can easily collect data from every part of your infrastructure. Never miss a beat with our flexible agent-based or agent-less solution, and easily interface with a variety of sources, including operating systems, applications, and networking devices.
-
Parse
Using Motadata’s parsing capabilities, raw logs can be quickly transformed into useful insights. Take advantage of pre-built log parsers, dynamic parsing features, and custom log parser plugin support for languages like Python and Go to get useful data adapted to your requirements.
-
Analyze
With Motadata’s advanced analytical tools, uncover significant trends and insights within your data. Robust log search features like live log tailing and pattern detection enable you to track performance, find problems quickly, and make educated choices.
-
Visualize
Use Motadata’s user-friendly visualization tools to see how your infrastructure is performing. Look at pre-made dashboards that are specific to your technology or build your own dashboards and widgets. Simple querying makes it easy to go through your data and quickly get useful insights.
Inclusive Log Management Solutions for Your Technology Stack
Given the complexity of modern IT settings, Motadata has built its platform to support a broad range of technologies. Whatever your operating system—Windows, Linux, or numerous cloud platforms—our solution provides extensive log management features suited to your particular configuration. We ensure that you don’t overlook any data source, including databases, network devices, and application logs, providing a comprehensive view of your entire infrastructure.
You can quickly collect, manage, analyze, and showcase logs from across your technological stack, which helps you get useful insights and make informed decisions. Our scalable and versatile solution helps you efficiently monitor and optimize your IT operations, regardless of your size.
Motadata AI-Powered NMS
The Perfect Solution
For Automated Network Performance Monitoring
Monitor every bit of your IT infrastructure with a multi-vendor Network Management System.
- Monitors & optimizes the entire IT infrastructure.
- Monitors the network ensuring maximum uptime.
- Provides customizable dashboards and widgets.
- Provides actionable operational intelligence insights.
Explore Log Analytics
Log Analytics Powered by Motadata Saves your Company’s Time and Money by Smartly Monitoring the Logs and Discovering Powerful Actionable Insights from the Analytics.

Try AIOPs for 30 Days
Download our software free of cost for 30 days

Schedule Demo With Our Expert
Book a slot in our calendar and experience AIOPs live.

Contact Sales
Still, have questions? Feel free to reach out to us.
Motadata NMS
Your One-Stop Solution for Entire IT Infrastructure
Motadata’s unified NMS services offer a highly scalable AI-driven solution for Service Assurance, Orchestration & Automation, enabling companies to meet their network management objectives. Motadata will also give you network observability with a comprehensive application and infrastructure perspective, so you can find and fix issues quickly.
By TEAM
Learn how different teams can leverage our platform to improve their productivity and streamline their internal processes.
By USECASEs
Learn about the problems that our AIOps and ServiceOps platform can solve and the benefits they can provide.
Our Success Stories
See How Companies Like Yours Use Our Platform For Actionable Insight


TELECOM
More than 50 metrics analyzed per device
RADWIN, Israel selects Motadata as OEM Partner for its integrated NMS product suite for carrier-g...


HEALTHCARE
1200+ Assets Monitored and Managed
Motadata helped Emirates Healthcare to streamline IT operations with Smart Automation, to handle ...


TELECOM
More than 27 GB of log data processed per day
Bharti Airtel, A leading global telecommunications company selected Motadata for its unified feat...
Do You Have Any Questions? Please Ask Here, We Are Ready to Help You Out
If your question is not listed here, please feel free to reach out.
Log Analytics solution collects the log data from various events and operations. Logs are a record of events, such as user actions or system errors, in real-time. They also help you identify potential security threats by providing information about what users do when accessing sensitive resources.
Log Analytics can be used to discover the patterns in the user behaviors, identity issues, audit security activities, or compliance with the established rules. Organizations can also use it to strategize and configure IT infrastructure changes.
Log Analytics can be performed with the given practices below in chronological order.
- Collect
- Centralize and Index
- Search and Analysis
- Monitor and Alert