6 Network Monitoring Best Practices Every IT Team Needs in 2026
Amartya Gupta
A single hour of network downtime costs the average enterprise over $300,000. Yet most network monitoring setups aren't built to prevent outages — they're built to react after one happens. That's the gap between monitoring and effective monitoring.
Today's networks span on-premise data centers, multiple cloud environments, IoT devices, and software-defined architectures. The monitoring practices that worked five years ago can't keep up. This guide covers six proven best practices that'll help your team move from reactive firefighting to proactive network management — and keep your infrastructure running at peak performance.
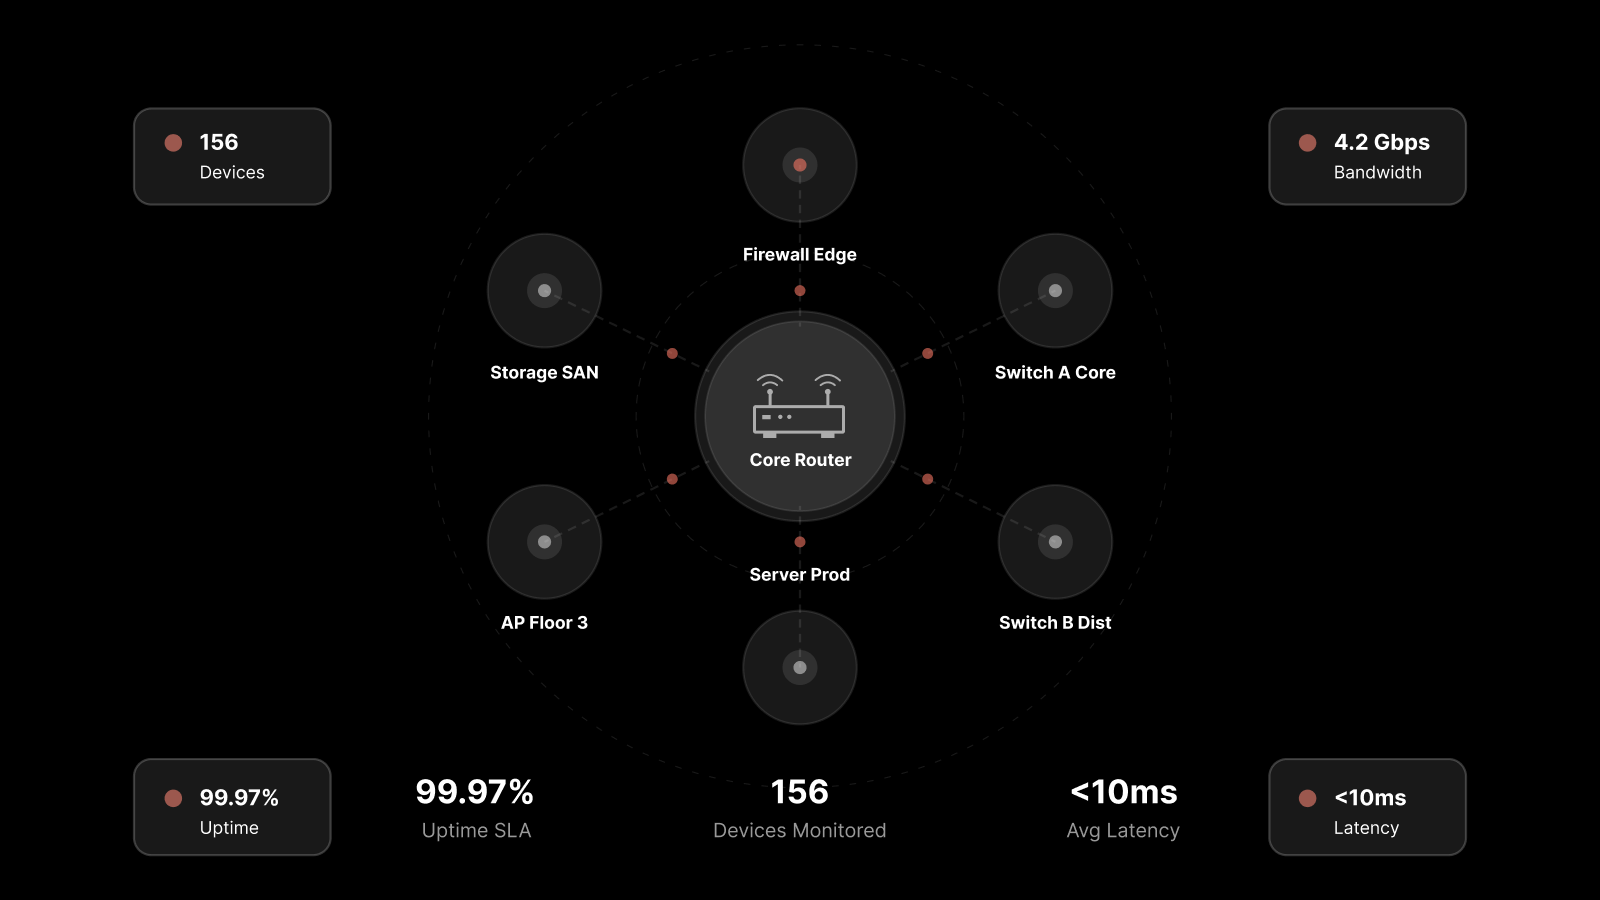
Network monitoring is the continuous process of observing, analyzing, and managing network components — routers, switches, servers, firewalls, and endpoints — to ensure optimal performance, availability, and security. A network monitoring system (NMS) is the platform that automates this process.
Baseline Your Network Performance First
You can't detect a problem if you don't know what normal looks like. Performance baselining is the foundation of every effective monitoring practice.
Here's how it works: observe your network performance across several weeks or months, covering different business activity levels — peak hours, off-hours, month-end processing, seasonal surges. At the end of this observation period, you'll have a mean performance benchmark that represents your network's normal behavior.
Use this baseline to set performance thresholds across your network. When any metric — CPU usage, bandwidth consumption, latency, packet loss — deviates from the baseline, your NMS triggers an alert.
The real power of baselining is what it reveals indirectly. A sudden spike in CPU usage on one server might indicate a problem somewhere else in the network entirely. Baselines give your team the context to interpret anomalies and act proactively — before users even notice something's wrong.
AI-native advantage: Modern platforms use machine learning to continuously refine baselines automatically, adapting to seasonal patterns and organic growth without manual recalibration.
Define Clear Alert Ownership to Accelerate Resolution
Getting the right alert is only half the battle. Getting it to the right person at the right time — that's what actually reduces mean time to resolution (MTTR).
Many enterprises struggle here. Alerts fire correctly, but they land in a shared inbox or a general Slack channel. Nobody owns them. Response times stretch. Issues escalate.
Fix this by creating a hierarchy of ownership across your network:
Map network segments to specific teams or individuals. Each zone, VLAN, or service group should have a designated owner.
Configure rule-based alert routing. When a threshold breach occurs in a specific segment, the alert goes directly to the responsible team — not to everyone.
Establish escalation policies. If the primary owner doesn't acknowledge an alert within a defined window, it escalates automatically.
This structure does two things: it eliminates the "someone else will handle it" problem, and it lets individual engineers focus on their area of responsibility without being distracted by alerts they can't act on.
Implement Layer-Sensitive Reporting
Network issues can originate at any layer of the OSI model — physical, data link, network, transport, session, presentation, or application. Your monitoring system needs to detect and classify issues across all of them.
Why does this matter? Because the troubleshooting approach for a physical layer cable fault is completely different from an application layer timeout. If your NMS can't tell the difference, your team wastes time investigating the wrong layer.
Layer-sensitive reporting means your NMS:
Tags each alert with its source layer so technicians immediately know where to look.
Generates layer-specific reports that show trends and patterns within each layer.
Correlates cross-layer events to identify cascading failures — like a physical layer issue causing application-level timeouts.
This capability transforms your team's efficiency. Instead of starting every investigation from scratch, they start with the right context and can launch targeted troubleshooting protocols immediately.
Ensure High Availability for Your Monitoring System
Here's a scenario that catches more teams than you'd expect: your network goes down, and your monitoring system goes down with it — because it runs on the same network it's supposed to monitor.
You lose visibility at exactly the moment you need it most.
High Availability (HA) for your NMS solves this circular problem. An HA configuration ensures your monitoring platform keeps running even when the network it monitors experiences failures. This means:
Redundant monitoring servers in separate network segments or availability zones
Automatic failover so monitoring continues without manual intervention
Data persistence ensuring no monitoring data is lost during a failover event
This might seem like a secondary concern when everything's running smoothly. But during an outage, HA is the difference between having the data you need to diagnose the problem and flying blind.
Maintain Historical Data for Trend Analysis
Real-time alerting tells you what's happening now. Historical data tells you why it's happening and what's likely to happen next.
Most monitoring workflows focus on the immediate: an alert fires, someone investigates, the issue gets resolved. But without historical context, you're solving the same problems repeatedly without understanding root causes or trends.
Build your monitoring practice around retaining and analyzing historical data:
Store alert history with full context — timestamps, affected components, source layers, resolution actions.
Track performance trends over hours, days, weeks, and months to identify gradual degradation.
Use historical patterns for root cause analysis — if the same alert fires every Tuesday at 3 PM, there's a pattern worth investigating.
Feed historical data into predictive models that forecast potential issues before they occur.
AI-native monitoring platforms excel here. They can analyze months of historical data to identify patterns that humans would miss, predict capacity constraints, and surface recommendations for optimization.
Build a Unified, Federated View of Your Entire Network
As organizations scale, their networks fragment. New offices in new cities. Cloud infrastructure on multiple providers. Edge computing deployments. Remote workforce endpoints. Suddenly, you're managing a dozen different monitoring views across disconnected tools.
A unified view consolidates everything into a single platform:
All locations, all cloud providers, all network segments visible from one dashboard
Federated monitoring that scales across geographies without centralizing all data in one location
Cross-network correlation that reveals how issues in one segment affect others
Consistent policies and thresholds applied across the entire network fabric
Without a unified view, you're making decisions based on partial information. You might see that a branch office is experiencing latency, but you won't see that it's caused by a routing change at headquarters. Unified monitoring connects those dots.
FAQs
How often should I update my network monitoring baselines?
Review baselines quarterly at minimum, or whenever you make significant network changes — adding new infrastructure, migrating workloads, or changing traffic patterns. AI-native platforms handle this automatically through continuous baseline learning.
What's the most important network monitoring metric?
There's no single answer — it depends on your business priorities. However, availability (uptime), latency, packet loss, and bandwidth utilization are universally critical. Start there, then add application-specific metrics as your monitoring matures.
What is a network monitoring system (NMS)?
An NMS is a software platform that automates network monitoring. It collects data from network devices, analyzes performance against baselines and thresholds, generates alerts when issues are detected, and provides dashboards and reports for network visibility.
Should I use agent-based or agentless monitoring?
Most mature environments use both. Agentless monitoring (via SNMP, WMI, SSH) works well for network devices and requires no software installation. Agent-based monitoring provides deeper visibility into servers and applications. A hybrid approach gives you comprehensive coverage.
How do I reduce alert fatigue in network monitoring?
Three strategies work: baseline-driven alerting (only alert on genuine anomalies, not arbitrary thresholds), clear ownership structures (alerts go to the right person, not everyone), and AI-driven correlation (group related alerts into a single incident instead of flooding teams with individual notifications).
Make These Best Practices Native with Motadata
Motadata's AI-native platform doesn't just support these best practices — it's built on them. With intelligent baselining, layer-aware alerting, high availability, deep historical analytics, and a federated view of your entire network across locations and cloud environments, Motadata gives your team the monitoring foundation they need.
You won't need to spend weeks reengineering your monitoring process. Motadata's capabilities make your practice more responsive, efficient, and systematic from day one.
Start your free trial or schedule a demo to see Motadata's network monitoring in action.


