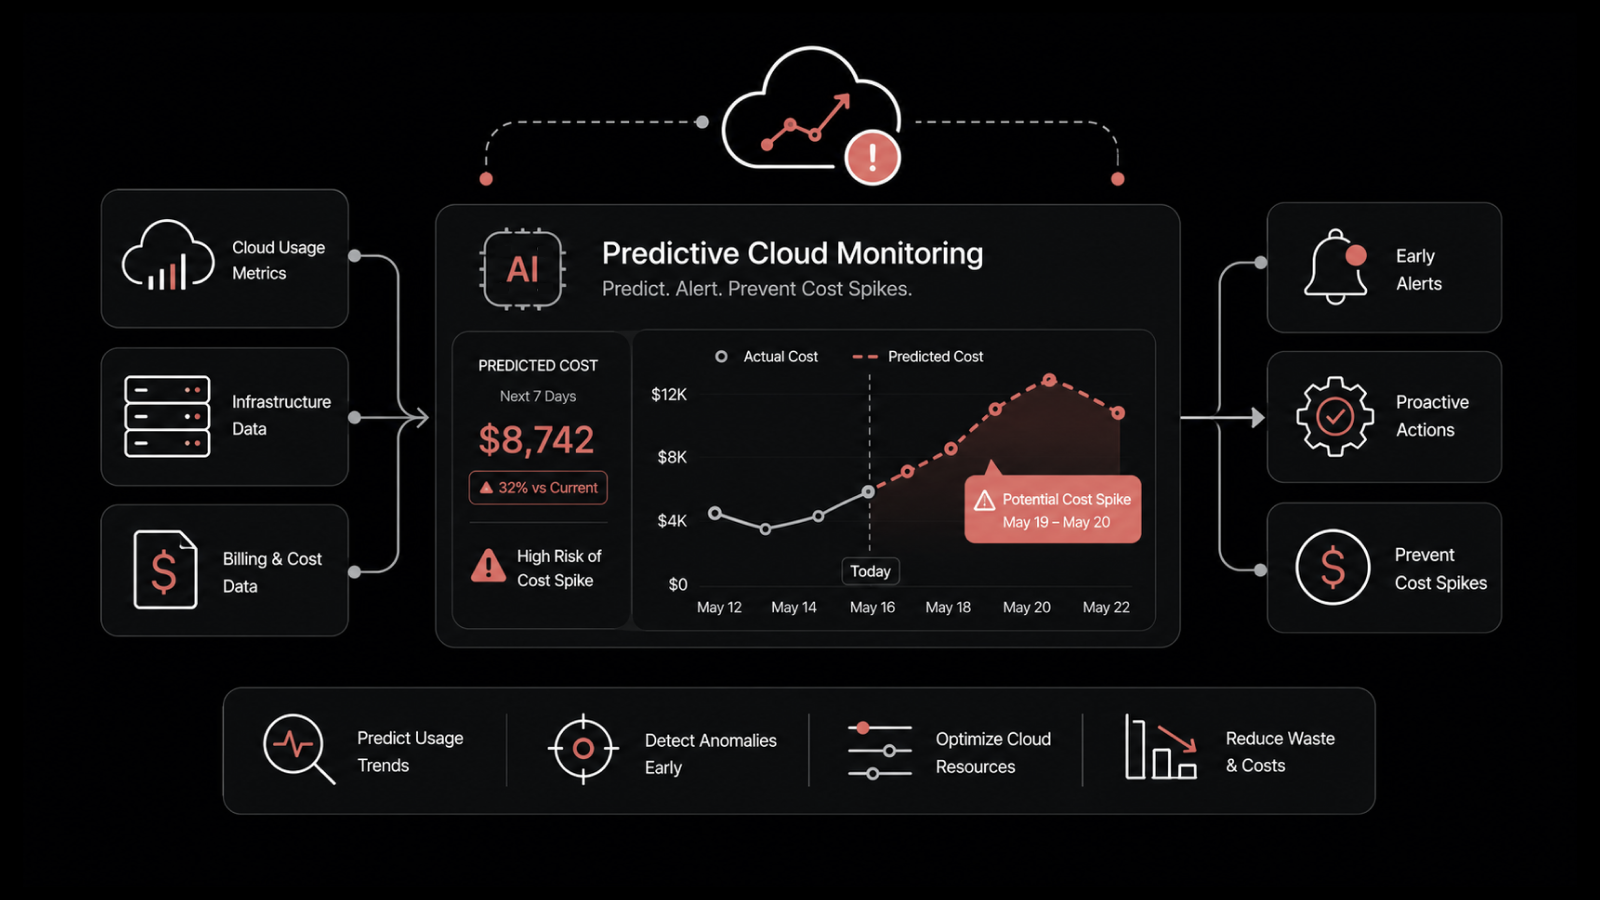
What Is Hybrid Cloud Monitoring (And How To Actually Do It Well)
Most IT teams running a real hybrid setup are not short on data. They are short on a place where the data agrees with itself.
Hybrid cloud monitoring means pulling metrics, logs, flows, traces, and topology from both your on-prem gear and your public cloud into one view, so you can find and fix problems that cross the line between them.
Old-school monitoring tools struggle with hybrid because each environment ships its own data into its own console.
The bill arrives as slow incident resolution, alert noise from three or four tools that do not talk to each other, and audit reports that take a week to pull together.
Doing it right means one place for ingestion, real correlation across signals, AI that works without months of training, and a way to turn alerts into tickets without someone retyping anything.
This post walks through what hybrid cloud monitoring actually is, the five signals you need in one platform, eight things we see working in production, and how the tool market really shakes out.
By the end, you will know what to ask a vendor for, where teams usually trip, and how to scope a proof of concept that does not burn a quarter.
What Is Hybrid Cloud Monitoring
Hybrid cloud monitoring is the ongoing collection of telemetry across your on-prem kit and one or more public clouds, treated as one environment instead of two or three. The goal is not just visibility. It is being able to follow a slow checkout page that starts in Azure, crosses a private link to an on-prem database, and ends at a storage box in your own rack. Without switching tools three times.
Most teams arrive at hybrid by accident. A SaaS move here. A cloud-burst workload there. An acquisition that brought its own AWS account. By the time someone draws the diagram, the monitoring stack is already four products deep and nobody owns the seams.
A working definition has three parts. You collect from everywhere using agents, agentless polling, and cloud APIs. You normalize the data so a CPU metric from EC2 and a CPU metric from a VMware host live in the same query. And you correlate across signal types, so a log spike, a flow change, and a latency jump get treated as one incident (not three).
Why Hybrid Cloud Breaks Traditional Monitoring
Old monitoring tools assume one network, one perimeter, one team. Hybrid breaks all three at once.
You no longer own the infrastructure under half your workloads. AWS gives you CloudWatch. Azure gives you Monitor. GCP gives you its own thing. None of them know what is happening on the VMware cluster in your rack. Your network tool sees on-prem switches and routers but treats the cloud as a black box. Your APM agent traces the app but cannot see the VM underneath it in the cloud. So you end up with four tools, four bills, four dashboards, and one team that has to stitch the story together every time the phone rings.
This is the boundary problem. When something goes wrong fully on-prem, your on-prem tool catches it. When it goes wrong fully in the cloud, the cloud tool catches it. When it lives on the boundary, both tools see half of it and neither one owns it. Flexera's 2024 State of the Cloud report found 73 percent of organizations use more than one cloud, and most cited cross-environment visibility as their biggest monitoring gap. That gap is what traditional tools leave wide open.
The fix is not adding a fifth tool. It is a platform built for the fact that the environment is mixed (which is what real unified observability is supposed to deliver). Layering a fifth dashboard on top of four others just adds to the noise.
We will get to a demo link later in the piece. The rest of this article is the method.
The Five Signals You Need In One Place
A hybrid cloud monitoring tool is only as good as the signals it pulls in. There are five. You need all of them under one roof, not four under one and one in a separate tab.
1. Metrics
CPU, memory, disk, network I/O, request rates, errors, latency. Collected every second to every minute, depending on the source. The catch in hybrid: you pull cloud metrics from APIs and on-prem metrics from SNMP, and you end up with two slightly different definitions of the same thing.
2. Logs
App logs. System logs. Syslog from network devices. Cloud audit logs like CloudTrail and Azure Activity Log. The problem is volume. A mid-sized hybrid setup generates 50 to 200 GB of logs a day. Without parsing and categorization, your log store becomes a dumping ground nobody opens until after something has already broken.
3. Flows
Network flow analysis (NetFlow, sFlow, jFlow, IPFIX) tells you who is talking to whom, how much, and which path. Cloud providers do not speak NetFlow natively, so in hybrid you get flow data from on-prem devices plus VPC flow logs. Both should land in the same engine.
4. Traces
A trace follows one request through every service it touches. For a request that hits a cloud API, calls an on-prem database, and writes to S3, the trace is the only signal that connects the three. OpenTelemetry is the standard now, and any modern platform should ingest OTLP without a custom build.
5. Topology
A live map of what depends on what. Without it, correlation is guesswork. With it, you can answer "if this router dies, which business services break" without calling a meeting.
The reason these five have to share one platform is correlation. If logs sit in one product and metrics in another, the best you can do is join by timestamp. You cannot ask the system "which logs showed up just before this latency spike on these dependent services" and get an answer in a few seconds. That is the difference between fifteen minutes to root cause and three hours.
The Core Parts Of A Hybrid Cloud Monitoring Stack
Five signals is the input. The platform itself needs five things to turn that input into fixed incidents.
1. Unified Data Collection Across On-Prem And Cloud
You need agents for endpoints (servers, VMs, containers) on Windows, macOS, and Linux. You need agentless polling for network devices over SNMP v1, v2c, and v3. You need cloud connectors for AWS, Azure, GCP, OCI, and Microsoft 365. And you need to handle the operational reality of multi-site setups: collectors at branches that buffer locally if the link to HQ flaps, so nothing gets lost. A platform that covers four of those five and leaves a hole is the platform you replace in eighteen months.
2. Correlation And Dependency Mapping
Correlation is what gets you from "here is what happened" to "here is what caused it." It works in two directions. Horizontal correlation links signals at the same point in time across types (a log line, a metric jump, a flow change). Vertical correlation walks up and down the dependency tree, so you can see that the slow cloud-hosted checkout is actually rooted in a saturated firewall on-prem. Dependency mapping has to be automatic. If a human draws it, it will be wrong inside a month (we have seen this play out enough times to bet on it).
3. AI-Driven Anomaly Detection And Noise Reduction
Threshold alerts work fine for static workloads. They fall apart in hybrid because cloud workloads scale up and down on demand. Any fixed threshold is either too tight (false alarms all day) or too loose (real issues missed). Anomaly detection with machine learning sets dynamic baselines that adjust to the workload pattern. The credible tools here support both: fixed thresholds where they make sense, learned baselines where they do not. Then noise reduction groups related alerts into one incident so a cascade does not page three engineers at 2 a.m.
Honest trade-off here. ML-based detection is not magic. It needs a few weeks to settle on stable baselines for new workloads, and it will produce some false positives during the bedding-in period. Vendors who promise zero-noise AI from day one are either overselling or assuming a stationary workload, which hybrid is not.
4. Closed-Loop Incident Response
The monitoring platform should not be where the workflow ends. When an alert fires, a ticket should open in the service desk with the affected CI, recent changes, the right runbook, and the on-call already assigned. When the ticket closes, the alert should close. That is what closed-loop means. Without it, engineers spend a third of every incident copy-pasting context between tools, which is a tax nobody budgets for but everyone pays.
5. Compliance And Audit Visibility
In a hybrid setup, audit data is scattered. Some lives in cloud audit logs, some in on-prem syslog, some in individual application logs. A working stack pulls these together, checks configuration drift against frameworks like CIS, GDPR, HIPAA, and SOX, and produces reports an auditor will accept on the first pass. This is also where network configuration management earns its keep, because most compliance failures we see started as a config change nobody caught.
Eight Best Practices For Hybrid Cloud Monitoring
These are the things we see separating teams who run hybrid cleanly from teams who just tolerate it. Each one has a number you can use to make the business case.
1. Draw The Boundary Before You Buy A Tool
Sit down and draw, on paper, which workloads live where. Then mark which application flows cross the boundary. Most teams skip this because it feels like documentation theatre. It is not. The boundary diagram is what tells you whether your shortlist actually covers your real environment. We watched a 400-person financial services team buy a cloud-native APM product and then realize, six weeks in, that 40 percent of their critical transactions touched an on-prem mainframe the tool could not see.
2. Standardize Tagging Before You Standardize Tools
Tags are the join key for everything that follows. If your AWS resources are tagged by environment and application but your on-prem assets are tagged by cost center and owner, no platform will give you "everything that belongs to the payments service." Pick a schema (environment, application, owner, criticality, data classification at minimum). Apply it on both sides. Audit it every month. This is unglamorous work. It pays back every week thereafter.
3. Collect Every Signal, Keep Each By Value
Pull in metrics, logs, flows, traces, and topology from everywhere. Then make real retention decisions: 30 days of full-fidelity logs, 90 days of aggregates, a year of metrics at one-minute granularity, and so on. The biggest cost trap in hybrid monitoring is keeping all logs at full fidelity for a year because nobody had the meeting about tiering.
4. Build Service Maps, Not Just Infrastructure Dashboards
A dashboard that says "Servers in AWS US-East-1: healthy" is decoration. A dashboard that says "Checkout Service: degraded, root cause: database read replica in us-east-1b, business impact: 12 percent of online orders" is operations. Service maps connect technical signals to business outcomes. And business outcomes are what get the budget renewed.
5. Cut Alert Noise Hard
A reasonable target for a mid-sized hybrid team is fewer than 50 actionable alerts a day across the whole estate. Most teams we see start at 500 to 2,000. You close that gap by consolidating alerts at the platform layer, suppressing during maintenance windows, grouping by dependency, and killing any threshold that has not paged a real incident in 90 days. More tactics in our guide to reducing alert fatigue.
6. Treat Cloud Bills As A Monitoring Signal
Cost is telemetry. A 30 percent month-over-month jump in AWS spend on a service that has not had a deployment is an incident. Pipe cloud cost data into the same platform as your performance metrics, alert on anomalies, and you will catch misconfigured auto-scaling groups and forgotten test environments before the CFO does. Nuvoco Vistas, a Motadata customer in manufacturing, brought infrastructure operations cost down by tying cost telemetry to performance telemetry in this way.
7. Automate The First Response
A hybrid stack throws off more alerts than any human team can triage. Automation closes the gap. Runbooks that ping a device before paging, restart a service before opening a ticket, or roll back a config change before calling the on-call. The metric to track is the share of alerts that auto-resolve before a human looks at them. A working stack lands at 30 to 50 percent.
8. Review The Stack Quarterly Against The Boundary
The hybrid estate moves. Workloads migrate. New SaaS gets adopted. An acquisition adds a third cloud. The monitoring stack has to keep up. Every quarter, walk through the boundary diagram, list every new workload, and check whether each one is in scope. If you find more than three gaps in a single quarter, your platform is falling behind your environment.
If you want to see how these practices look on one platform, you can book a 30-minute ObserveOps demo (no credit card needed). It runs against a sample hybrid environment, so the walkthrough mirrors what you would actually see in production.
Best Tools For Hybrid Cloud Monitoring
The market splits into three rough camps. Cloud-native APM platforms that grew into infrastructure. Network-monitoring incumbents that added cloud. And unified observability platforms that started with both in mind. Here is an honest read on the main options.
1. Motadata ObserveOps
ObserveOps pulls metrics, logs, flows, traces, and topology into one product, built on Motadata's DFIT deep learning framework. It runs on-prem, in private cloud, or in public cloud, with six deployment modes (single-box, distributed, multi-site, high availability, disaster recovery, and HA over WAN). Those modes matter when you have data-residency rules or remote sites that need local collection.
Why it fits hybrid in particular: native OTLP ingestion for traces, agentless cloud connectors for AWS, Azure, GCP, OCI, and Microsoft 365, plus MotaAgent for on-prem endpoints on Windows, macOS, and Linux. The triangulation of logs, metrics, and flows on one engine is the thing customers replacing two or three point tools tell us they care about most. Native integration with Motadata ServiceOps closes the loop from alert to ticket to resolution without a separate workflow tool in the middle.
Honest trade-off. ObserveOps is not the right pick if you only run in one public cloud and never expect to expand. The breadth of the platform is overkill for a pure-cloud shop. A native AWS or Azure tool will be simpler. ObserveOps earns its place when the environment is genuinely mixed.
Marketed customer outcomes from Motadata include 45 percent less downtime, 80 percent MTTR reduction, and 38 percent cost savings versus siloed tools. Named customers include Central Bank of India in banking and Nuvoco Vistas in manufacturing.
If you want to see how it handles a hybrid setup specifically, book a 30-minute ObserveOps demo. No credit card, and the walkthrough uses a live hybrid environment so you can compare directly against your own.
Pricing: subscription-based, modular, with monthly and annual options. A 30-day free trial is available.
2. Datadog
The cloud-native default. Strong APM. Good infrastructure metrics. Big integrations catalog. The on-prem story has improved but still feels like an addition, especially for network device monitoring. Best fit for cloud-heavy estates that need APM as the main lens.
Trade-off: pricing is famously module-by-module, and a full rollout for a mid-sized hybrid setup often lands at three to five times the cost of consolidated alternatives. Reviewers on G2 and Gartner Peer Insights flag this regularly.
3. Dynatrace
Deep APM with automatic dependency mapping (Smartscape) and AI-based root cause analysis (Davis). Strong on application observability. Weaker on classic network device monitoring and flow analysis, which can leave gaps on the on-prem side.
Trade-off: the host-based pricing model makes ephemeral cloud workloads expensive and hard to forecast. Several customers we have talked to budget annually and then come in 30 percent over because of autoscaling.
4. SolarWinds
The incumbent on the on-prem network side. Server and Application Monitor plus the wider SolarWinds Platform cover network and infrastructure well. The cloud side is okay but not native, and the architecture still feels stitched together for hybrid use cases.
Trade-off: legacy code paths, a UI that shows its age, and reputational baggage from the 2020 SUNBURST incident, which still comes up in procurement conversations.
5. LogicMonitor
SaaS-first, agentless-first, with strong out-of-the-box coverage and quick onboarding. A solid middle option if you do not want to deploy a platform on-prem but still need real coverage of on-prem network and infrastructure.
Trade-off: log management is functional but not the strongest piece. Log-heavy teams often pair LogicMonitor with a dedicated log platform, which puts you back into multi-tool territory.
How To Choose: A Short Decision Guide
If your environment is genuinely mixed and you want one platform instead of three, look at ObserveOps. If you are 90 percent cloud and APM is the main need, Datadog or Dynatrace will fit faster. If you are 90 percent on-prem with light cloud presence, SolarWinds or a similar incumbent is still defensible, with the trade-offs above. If you want fast SaaS onboarding and you can live with adding a log tool later, LogicMonitor is worth a shortlist spot.
Whatever you pick, the proof of concept matters more than the demo. Run it against your real boundary, with real alerts, for at least two weeks. A demo will not show you whether the platform actually links an on-prem flow anomaly to a cloud app slowdown. The POC will.
Where To Start
Three steps. In order.
First, draw the boundary diagram and the tagging schema this week. It does not need to be perfect.
Second, run a structured POC against two real production incidents you have already resolved. The platform should surface the root cause faster than your old stack did. If it cannot, it is not the platform.
Third, score the shortlist on five criteria with weights you set: signal coverage, correlation depth, deployment flexibility, alert noise reduction, and total cost over three years (not year-one list price).
If ObserveOps is on your shortlist, you can book a 30-minute demo that walks through a real hybrid environment and the four failure scenarios we see most. No credit card, and no sales-engineer follow-up for two weeks unless you ask for it.
The Real Lesson
The shift teams have to make is not from one tool to another. It is from monitoring environments separately to operating one environment that happens to be hybrid. Once that frame clicks, the tool choice gets easier and the alert noise gets quieter (in that order).
The honest trade-off is that consolidation takes work upfront. The boundary diagram. The tagging schema. The POC. The data-retention conversations. None of them are quick. Teams that try to shortcut by buying a platform first and figuring out the rest later end up with the same fragmentation problem on a new product.
The teams who get this right run leaner. Fewer tools. Fewer engineers paged at night. A clearer view of what their hybrid estate is actually doing. The platform makes that possible. The practice makes it stick. If you want to compare what your current stack shows you against what a unified one would, the 30-minute ObserveOps demo is the quickest way to find out.
FAQs
What Is Hybrid Cloud Monitoring?
Hybrid cloud monitoring is the unified collection of telemetry (metrics, logs, flows, traces, and topology) across on-prem infrastructure and one or more public clouds, treated as one environment. The point is to find and fix issues that cross the boundary without switching tools.
What Is The Best Monitoring Tool For Hybrid Cloud?
There is no single best tool. The right pick depends on the mix. Genuinely mixed estates get the most out of a unified platform like Motadata ObserveOps, which covers metrics, logs, flows, traces, and topology on one engine. Cloud-heavy teams often prefer Datadog or Dynatrace for APM depth. On-prem-heavy teams may stick with incumbents like SolarWinds. Run a POC before you commit.
How Is Hybrid Cloud Monitoring Different From Multi-Cloud Monitoring?
Multi-cloud monitoring covers two or more public clouds. Hybrid cloud monitoring covers public cloud plus on-prem (and often private cloud) infrastructure. Hybrid is the harder problem because you are bridging environments with very different telemetry models. Most platforms that handle hybrid handle multi-cloud as a subset.
What Are The Biggest Challenges In Hybrid Cloud Monitoring?
Three recur. Signal fragmentation, where each environment ships data into its own console. Alert noise, because every tool generates its own alerts with no correlation across tools. And compliance reporting, because audit data is scattered. The fix in all three cases is consolidating onto a platform that ingests every signal natively, not through brittle tool-to-tool integrations.
How Do I Reduce Alert Noise In A Hybrid Environment?
Consolidate alerts at the platform layer. Group by dependency rather than by source. Use anomaly detection instead of static thresholds for variable workloads. And retire any threshold that has not paged a real incident in 90 days. A reasonable target is fewer than 50 actionable alerts a day for a mid-sized team.
Does Hybrid Cloud Monitoring Cover Security?
Modern platforms ingest the signals that matter for security observability: audit logs, flow data, configuration drift, and anomaly detection across user and service behavior. They do not replace a dedicated SIEM for active threat hunting. But they cover the operational security visibility that overlaps with performance monitoring. Configuration compliance against CIS, GDPR, HIPAA, and SOX is usually a core feature.
Is Hybrid Cloud Monitoring Expensive?
It can be, especially if you stack three or four point tools. Consolidating onto one platform usually cuts total cost by 30 to 50 percent over three years, mostly through removed license overlap and less operational overhead. The trap is comparing year-one list prices, which favors the cloud-native tools. Compare three-year total cost including egress, data retention, and the engineering hours saved on tool integration.
Can I Run Hybrid Cloud Monitoring On-Premises?
Yes. Platforms like ObserveOps offer six deployment modes including fully on-prem, distributed, high availability, and disaster recovery. This matters for regulated industries where data residency or compliance rules stop monitoring data from leaving the country. SaaS-only platforms cannot meet these requirements.
Author
Jagdish Sajnani
Senior Content Strategist
Jagdish Sajnani is a B2B SaaS content strategist and writer. He has experience across different B2B verticals, including enterprise technology domains such as IT Service Management, AI-driven automation, observability, and IT operations. He specializes in translating complex technical systems into structured, engaging, and search-optimized content. His work improves product understanding, strengthens organic visibility, and supports B2B demand generation.