Introduction to Kubernetes Monitoring in 2026
Modern cloud-native applications rely on Kubernetes as their leading container orchestration platform.
The adoption of Kubernetes in 2026 has achieved remarkable heights, making it the primary operator of vital enterprise systems across financial technology and healthcare organizations.
Kubernetes environments continue to grow increasingly complex, and their dynamics are evolving, so monitoring has become an essential strategic practice.
The monitoring requirements for Kubernetes installations are expected to become more complex in 2026. Kubernetes cluster management exist in both hybrid and multi-cloud deployments. Applications now consist of thousands of short-lived containers.
Organizations must achieve immediate access to system data because this information provides essential benefits during debugging activities, as well as performance enhancements and security audits, and cost management practices.
The core monitoring approach for 2026 emphasizes intelligent and forward-thinking observation practices.
The addition of AI/ML technology enables observability platforms to detect anomalous patterns and anticipate failures while providing performance recommendation services.
Deep telemetry capabilities have been enhanced through the implementation of eBPF, alongside service mesh integrations that transform the event monitoring and response abilities of teams.
Core Aspects of Kubernetes Monitoring in 2026
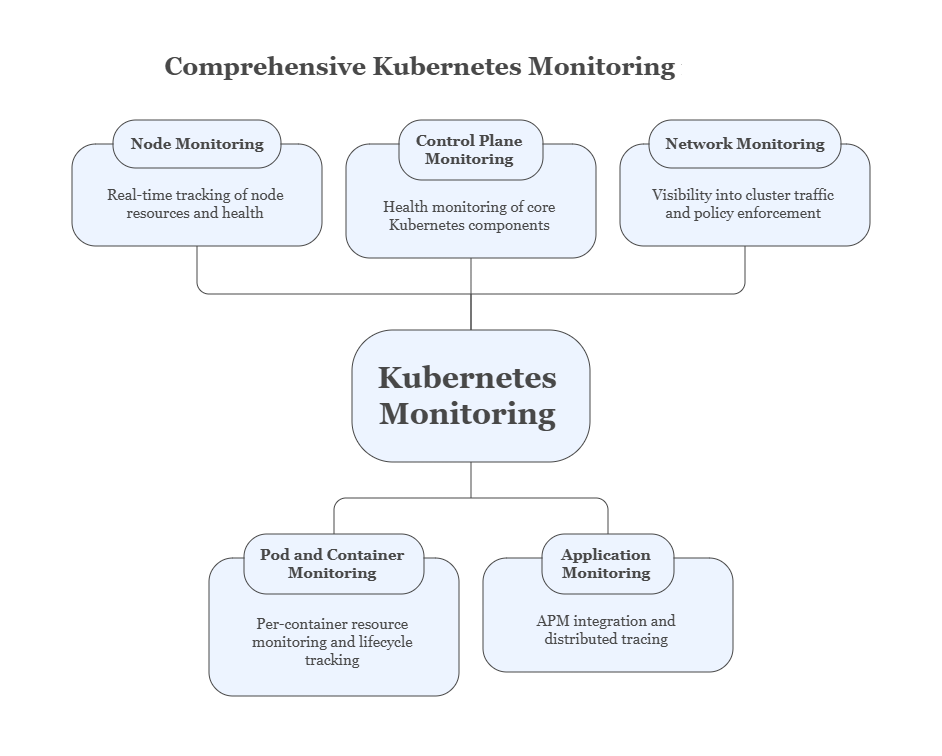
Node Monitoring
- Real-time tracking of CPU, memory, disk I/O, and network usage at the node level.
- Continuous health checks and availability monitoring of each node.
- Predictive scaling based on historical trends using AI-driven insights.
- Advanced kubelet metrics now expose granular details for precise monitoring.
Pod and Container Monitoring
- Per-container resource monitoring, highlighting inefficiencies and bottlenecks.
- Lifecycle event tracking, including restarts, crashes, and evictions.
- Centralized, real-time log aggregation enhanced with AI for noise reduction and pattern detection.
- Distributed tracing across containers within a pod provides deep contextual insight into request flows.
Control Plane Monitoring
- Health monitoring of core Kubernetes components, including the API server, etcd, and controller manager.
- Detailed metrics, such as API server request latency and throughput, are essential for operational insight.
- Anomaly alerts notify administrators of issues before they affect workloads.
Application Monitoring within Kubernetes
- APM tools now integrate natively with Kubernetes for context-rich monitoring.
- Distributed transaction tracing enables performance tuning across microservices.
- Business-critical metrics, such as latency, error rates, and throughput, are visualized within the Kubernetes context.
- Service mesh telemetry adds another layer of observability to application behavior.
Network Monitoring
- Visibility into internal cluster traffic and cross-cluster communication.
- Continuous monitoring of network policy enforcement and its effectiveness.
- Service-to-service communication paths are analyzed through service mesh data.
- Real-time detection of latency dropped packets and routing anomalies.
Key Technologies and Tools for Kubernetes Monitoring in 2026
Prometheus and Grafana
- Still the go-to stack for open-source monitoring.
- Rich query capabilities and a growing library of community dashboards.
- Seamless integration with Kubernetes components and third-party exporters.
eBPF-based Observability
- Enables kernel-level data collection with minimal overhead.
- Ideal for security, performance, and network monitoring use cases.
- Emerging tools like Cilium and Pixie use eBPF to provide low-latency, high-resolution observability.
Service Mesh Monitoring (e.g., Istio, Linkerd)
- Offers visibility into service interactions, retries, failures, and latency.
- Built-in telemetry includes metrics, logs, and traces without code changes.
- Enables monitoring of advanced traffic routing, mTLS, and circuit breaking.
AI-Powered Monitoring and Anomaly Detection
- Machine learning models identify outliers and trends across logs, metrics, and traces.
- Automated correlation of alerts reduces noise and improves incident response.
- Proactive recommendations optimize resource usage and detect regressions early.
Cloud-Native Observability Platforms
- AWS CloudWatch, Azure Monitor, and GCP Cloud Operations offer managed solutions.
- Tight integration with other cloud-native tools simplifies end-to-end observability.
- Considerations include cost, vendor lock-in, and compatibility with open standards.
Best Practices for Kubernetes Monitoring in 2026
1. Adopting a Comprehensive Observability Strategy
Modern organizations must discard traditional methods for collecting CPU and memory data. A comprehensive observability strategy must incorporate three essential components: logs metrics, and distributed traces.
Teams possessing these three components can detect both system occurrences and their fundamental causes.
Observing environmental events alongside environmental changes provides essential contextual information.
2. Implementing Automated Alerting and Notifications
The value of effective monitoring depends on prompt alert notifications, as not all alerts are equivalent.
Alert systems that understand context produce fewer disturbances by directly linking symptoms to their actual consequences.
Technology-enabled alerts examine the system structure and application status to generate relevant notifications, allowing teams to focus solely on critical events.
3. Centralized Log Management and Analysis
The process of log management becomes more complex as cluster scalability increases.
Log aggregation centralization between clusters and namespaces enables teams to perform log indexing and search operations efficiently.
Intelligent analysis solutions, coupled with automatic filtering, generate multiple valuable insights, thereby decreasing MTTR.
4. Utilizing Dashboards and Visualizations Effectively
A dashboard keeps its value only when designed for its intended audience.
Different perspectives exist among the teams of DevOps members, developers, and product managers, who require unique information views.
A dashboard structure that includes metrics and visual signals for each stakeholder allows them to track cluster health according to their responsibilities.
5. Integrating Monitoring with CI/CD Pipelines
Development lifecycle observability that shifts to the left side of the process helps achieve better product quality combined with reliable performance.
CI/CD pipelines benefit from health check additions and performance benchmark implementation, as well as anomaly detection, which enables teams to identify problems before they reach production.
6. Implementing Role-Based Access Control (RBAC) for Monitoring Data
View access cannot be granted to all employees for observability information.
Protective measures need to be established for sensitive monitoring logs and metrics.
RBAC implementation for monitoring dashboards and APIs helps secure compliance by enabling limited access to personnel who require it.
7. Regularly Reviewing and Tuning Monitoring Configurations
Clusters evolve rapidly, and so should monitoring configurations. What worked a few months ago might no longer be relevant.
Periodic reviews ensure that dashboards remain insightful, alerts remain accurate, and resources are not wasted on monitoring outdated metrics.
8. Cost Optimization for Monitoring Infrastructure
Storing every metric and log indefinitely is expensive. Organizations must find the right balance between data granularity and cost.
Strategies include tiered storage, establishing appropriate data retention policies, and utilizing aggregation techniques to minimize ingestion volumes without compromising critical insights.
The Future of Kubernetes Monitoring Beyond 2026
Expect even more innovative observability tools that learn from your environment and automatically tune their configurations.
These advancements are increasingly driven by collaborations with an AI Agent Development, which specializes in building autonomous monitoring agents that enhance performance, security, and resilience across Kubernetes clusters.
AI and ML Advancements
Expect even more innovative observability tools that learn from your environment and automatically tune their configurations.
Security + Observability Convergence
Monitoring will be tightly integrated with security tooling to support Security Operations (SecOps) initiatives.
The Rise of eBPF
eBPF adoption will increase, enabling unprecedented visibility into the kernel and user-space events.
Emerging Tech like WebAssembly (Wasm)
Wasm-based workloads will introduce new monitoring challenges and opportunities.
Open Observability Standards
Efforts like OpenTelemetry will gain traction for vendor-neutral instrumentation.
Conclusion
Kubernetes monitoring has become essential for every organization in 2026. The foundation of performance excellence and system reliability depends on complete observability through every layer, including nodes, application service meshes, and eBPF.
A proactive observability method powered by AI, enables organizations to scale confidently while facilitating faster innovation and preventing problems before they impact users.
The future development of Kubernetes monitoring techniques will accompany changes within the ecosystem while establishing better practices for contemporary infrastructure.