What Is Observability? The Complete Guide to Logs, Metrics, Traces, and Beyond
What is observability? Observability is the ability to understand what's happening inside your systems by examining the data they produce — logs, metrics, and traces. It answers not just "what broke?" but "why did it break?" and "what else might break next?"
Your monitoring dashboard says everything is green. Your users say the checkout page takes 12 seconds to load. That gap — between what your tools tell you and what's actually happening — is the problem observability solves.
Monitoring watches for known failure modes. It checks the boxes you defined in advance. Observability goes further. It gives you the raw material to investigate problems you didn't predict — the ones that show up at 2 AM in production when no runbook exists.
For teams running distributed systems, microservices, or hybrid cloud infrastructure, observability isn't optional. It's the foundation that makes everything else — incident response, capacity planning, SLO management — actually work.
Key Takeaways
Observability measures your system's internal state from external outputs (logs, metrics, traces). Monitoring tells you something is wrong. Observability tells you why.
The three pillars — logs, metrics, traces — are necessary but not sufficient. Modern observability also requires topology mapping, real user monitoring, and AI-driven correlation.
Observability doesn't replace monitoring. It extends it. Monitoring handles the known failure modes. Observability handles the unknown unknowns.
The biggest observability challenge isn't technology — it's data volume management. Without smart sampling, retention policies, and noise reduction, you'll drown in telemetry before you find the signal.
Start with instrumentation. If your systems aren't producing the right telemetry data, no observability platform can help you.
Observability pays for itself through faster incident resolution — teams with mature observability practices report 60-70% faster MTTR compared to monitoring-only approaches.
What Is Observability? A Definition That Works
Observability originated in control theory — the mathematical discipline of determining a system's internal state from its outputs. In IT, the concept translates directly: can you understand what's happening inside your infrastructure by analyzing the data it produces?
A system is "observable" when you can ask any question about its behavior and get an answer from the telemetry data it generates. Not just "is the CPU high?" — but "why is this specific API endpoint returning 500 errors for users in the EU region during peak traffic, and when did this start?"
That's the bar. If your current tooling can't answer questions you didn't anticipate, you have monitoring. You don't have observability.
The Three Pillars of Observability
Every observability discussion starts here — and for good reason. These are the data types your systems must produce:
Logs: Timestamped records of discrete events. Application errors, security events, configuration changes, user actions. Logs tell you what happened at a specific moment. They're essential for debugging but challenging to search at scale.
Metrics: Numerical measurements collected at regular intervals. CPU utilization, request latency, error rates, queue depth. Metrics tell you how the system is performing over time. They're compact, fast to query, and ideal for dashboards and alerting.
Traces: Records of a request's path through distributed services. A single user action might traverse an API gateway, three microservices, a message queue, and a database. Distributed tracing connects these interactions into a single timeline, showing where latency occurs and which service is the bottleneck.
Why the Three Pillars Aren't Enough
Here's what most "what is observability" articles miss: having all three data types doesn't automatically give you observability. You also need:
Correlation: The ability to connect a metric anomaly to the relevant logs and traces that explain it
Topology awareness: Understanding service dependencies so you can distinguish root cause from symptom
Real User Monitoring: Measuring actual user experience, not just server-side metrics
Context: Metadata like deployment versions, infrastructure changes, and team ownership
Without these, you have three separate data silos that happen to live in the same platform.
Observability vs Monitoring: Why the Distinction Matters
People use these terms interchangeably. They shouldn't.
Aspect | Monitoring | Observability |
|---|---|---|
Question type | "Is X working?" (yes/no) | "Why is X behaving this way?" (open-ended) |
Failure coverage | Known failure modes | Known and unknown failures |
Data approach | Pre-defined metrics and alerts | All available telemetry — logs, metrics, traces |
Investigation | Check dashboards, follow runbook | Explore data, correlate events, form hypotheses |
Architecture fit | Works for monoliths | Required for distributed systems |
Alert philosophy | Threshold-based | Anomaly-based with context |
The practical difference: Monitoring tells you your database response time crossed 200ms. Observability tells you it crossed 200ms because a specific query plan changed after yesterday's schema migration, affecting only customers on the EU shard, and correlates that with the deployment event at 3:47 PM.
Monitoring is a subset of observability. You need both. But monitoring alone can't handle the complexity of modern distributed systems.
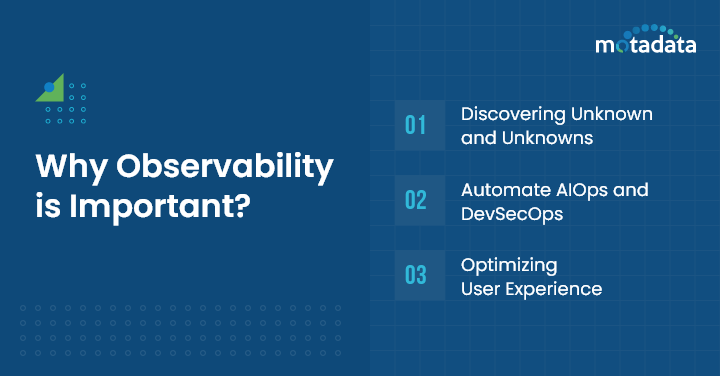
Why Observability Matters Now
Cloud-Native Architecture Changed the Rules
Monolithic applications are debuggable. One process, one server, one log file. Microservices architectures spread a single user request across dozens of services, each with its own runtime, language, and failure modes.
When something goes wrong, you can't just SSH into one server and grep the logs. You need correlated visibility across every service that touched the request. That's observability.
The Unknown Unknowns Problem
Monitoring checks for problems you anticipated. Observability surfaces problems you didn't.
A real example: an e-commerce team noticed a 15% drop in conversion rate. All monitoring dashboards were green — server metrics normal, error rates flat, response times within SLA. The observability platform revealed the issue: a third-party payment provider was silently timing out for mobile users on iOS 17, causing the checkout flow to hang without generating an error.
No monitoring rule would have caught that. The team found it by exploring trace data filtered by device type and payment step.
Downtime Costs Have Escalated
For enterprises, every minute of undetected degradation costs revenue, customer trust, and brand reputation. Teams with mature observability practices detect issues 5-10x faster than monitoring-only teams, because they can investigate freely instead of waiting for the right alert to fire.
How to Build an Observability Practice
Step 1: Instrument Your Systems
Observability starts with instrumentation — making your systems produce the right telemetry data. This means:
Application-level instrumentation: Add structured logging, custom metrics, and distributed tracing to your code. OpenTelemetry (OTel) is the industry standard for vendor-neutral instrumentation.
Infrastructure instrumentation: Deploy agents or use built-in integrations to collect metrics from servers, VMs, containers, and cloud services.
Network instrumentation: Capture flow data (NetFlow, sFlow) and SNMP metrics for network visibility.
Step 2: Define Your KPIs and SLOs
Before you start collecting everything, decide what matters. Define:
Service Level Objectives (SLOs): What uptime, latency, and error rate do your users expect?
Key metrics per service: What signals indicate a service is healthy vs. degraded?
Error budgets: How much unreliability can you tolerate before it impacts users?
SLOs turn observability from "collect everything" into "measure what matters" — which helps manage data volume and costs.
Step 3: Choose and Deploy Your Observability Platform
Evaluate platforms against these criteria:
Data type support: Can it handle logs, metrics, traces, and flows in a single platform?
Correlation capability: Can it connect a metric anomaly to the relevant traces and logs?
Scale: Can it handle your data volume without performance degradation or budget-breaking costs?
AI/ML features: Does it offer anomaly detection, intelligent alerting, and automated root cause analysis?
Integration breadth: Does it support your stack — cloud providers, container orchestrators, languages, frameworks?
User experience: Can engineers explore data intuitively, or does every investigation require custom queries?
Step 4: Establish Observability Workflows
The platform is a tool. The practice is what matters:
Incident response: When an alert fires, what's the investigation workflow? How do engineers access correlated data?
Post-incident review: How do you use observability data to understand what happened and prevent recurrence?
Proactive monitoring: How do you use anomaly detection and SLO tracking to catch degradation before users notice?
Step 5: Manage Data Volume and Cost
Observability data grows fast. A mid-size Kubernetes deployment can generate terabytes of telemetry per day. Without controls:
Sampling: Collect detailed traces for a percentage of requests (10-20%) and use head-based or tail-based sampling for the rest
Retention tiers: Hot storage (7 days) for active investigation, warm storage (30 days) for trends, cold storage (90+ days) for compliance
Aggregation: Pre-aggregate high-cardinality metrics to reduce storage while preserving trend visibility
Common Observability Challenges and Solutions
Challenge | Impact | Solution |
|---|---|---|
Data silos | Can't correlate across tools | Unified platform that ingests all telemetry types |
Alert noise | Engineers ignore alerts | ML-based anomaly detection with context |
Data volume | Cost overruns, slow queries | Smart sampling, retention policies, aggregation |
Manual setup | Slow time-to-value | Auto-discovery, pre-built dashboards, OTel integration |
Tool sprawl | Fragmented visibility | Platform consolidation with broad integration |
Skill gaps | Underutilized platform | Training, pre-built workflows, intuitive UI |
What IT Teams Should Also Understand About Observability
What's the relationship between observability and AIOps?
Observability provides the data — logs, metrics, traces from your entire stack. AIOps applies machine learning to that data to automate correlation, root cause analysis, and remediation. Think of observability as the foundation and AIOps as the intelligence layer built on top.
Do I need full-stack observability or can I start with one layer?
Start where the pain is. If application performance is the biggest issue, begin with APM and distributed tracing. If infrastructure visibility is the gap, start with metrics and log collection. The key is choosing a platform that can expand as you mature.
What is OpenTelemetry and why does it matter?
OpenTelemetry (OTel) is an open-source framework for generating, collecting, and exporting telemetry data. It matters because it's vendor-neutral — you can instrument once and send data to any observability platform. It's become the de facto standard for application instrumentation.
Observability reduces MTTR by giving engineers the data they need to investigate without waiting for additional data collection. Instead of "let me add logging and reproduce the issue," it's "let me query the traces from when this started." Teams with mature observability report 60-70% faster resolution compared to monitoring-only approaches.
How Motadata Delivers Full-Stack Observability
Motadata's AI-native observability platform unifies metrics, logs, flows, APM, and Real User Monitoring in a single console. Instead of toggling between tools to piece together what happened, your team gets correlated visibility across the entire stack — infrastructure, applications, and network.
What makes Motadata practical: AI/ML-powered anomaly detection that learns your environment's baselines, dynamic topology mapping with auto-discovery, and event correlation that connects related signals across domains. Teams typically see 90%+ noise reduction and significantly faster root cause identification.
If your team is spending more time investigating than resolving, request a demo to see how Motadata changes that equation.
FAQs
What is observability in simple terms?
Observability is the ability to understand what's happening inside your systems by analyzing the data they produce — logs, metrics, and traces. It goes beyond monitoring by letting you investigate unexpected problems, not just check for known failure modes. If monitoring is a smoke detector, observability is the fire investigation team.
What are the three pillars of observability?
Logs (timestamped event records), metrics (numerical performance measurements), and traces (request paths through distributed services). All three are necessary for full visibility, but modern observability also requires correlation across these data types, topology awareness, and real user monitoring to be truly effective.
How is observability different from monitoring?
Monitoring checks for known issues using pre-defined rules and thresholds. Observability lets you explore unknown issues by providing rich telemetry data you can query freely. Monitoring answers "is it working?" Observability answers "why is it behaving this way?" You need both — monitoring for known failure modes, observability for the unknown unknowns.
How much does observability cost?
Costs depend primarily on data volume — how much telemetry your systems generate and how long you retain it. Control costs with smart sampling (10-20% of traces), tiered retention (7-day hot, 30-day warm, 90-day cold), and metric aggregation. Platforms like Motadata that unify multiple telemetry types in one platform help reduce tool sprawl costs.
Do I need observability if I already have monitoring tools?
If you run a simple, monolithic application, monitoring may be sufficient. If you run distributed systems, microservices, hybrid cloud, or Kubernetes, you need observability. The deciding factor is complexity — when your infrastructure is complex enough that you can't predict every failure mode, monitoring alone isn't enough.
Author
Bhavyadeep Sinh Rathod
Senior Content Writer
Bhavyadeep Sinh Rathod is a Senior Content Writer at Motadata with 5+ years of content marketing expertise. He's passionate about crafting tech-focused content that captivates audiences and drives results. Apart from content, he has a deep interest in a variety of subjects like comedy, philosophy, geopolitics, sports, science, and spirituality.


