What Is Synthetic Monitoring? How It Works, Types, and Best Practices
A single second of delay in page load time can slash conversions by 7%. When your application goes down or crawls under load, you don't just lose traffic -- you lose revenue, trust, and search rankings. The challenge? Most teams only find out about performance issues after real users have already suffered through them.
Synthetic monitoring flips that script. It lets you catch problems before a single customer is affected.
Synthetic monitoring is a proactive testing technique that uses automated scripts to simulate user interactions with your applications, websites, and APIs. Instead of waiting for real users to encounter issues, it generates artificial traffic and runs predefined scenarios to detect performance bottlenecks, outages, and functionality errors before they impact your audience.
How Does Synthetic Monitoring Work?
Synthetic monitoring runs automated scripts -- often called synthetic transactions -- against your applications and websites from multiple locations, browsers, and devices. Here's how the process flows:
Script creation: Engineers define test scenarios that mirror critical user journeys. These scripts cover actions like page loads, login flows, form submissions, and API calls.
Scheduled execution: The monitoring platform runs these scripts at regular intervals (every 1, 5, or 15 minutes) from globally distributed testing nodes.
Data collection: Each test run captures key metrics -- response time, load time, availability, error codes, and transaction completion rates.
Threshold evaluation: Results are compared against predefined performance baselines. When metrics deviate beyond acceptable thresholds, alerts fire immediately.
Alert and diagnosis: Engineers receive notifications with diagnostic data, enabling them to investigate and resolve issues before real users are affected.
Because these tests run continuously on a fixed schedule, they don't depend on incoming traffic. You'll know about a 3 AM outage at 3:01 AM -- not when the first support ticket arrives at 9 AM.
Why Synthetic Monitoring Matters for Your Business
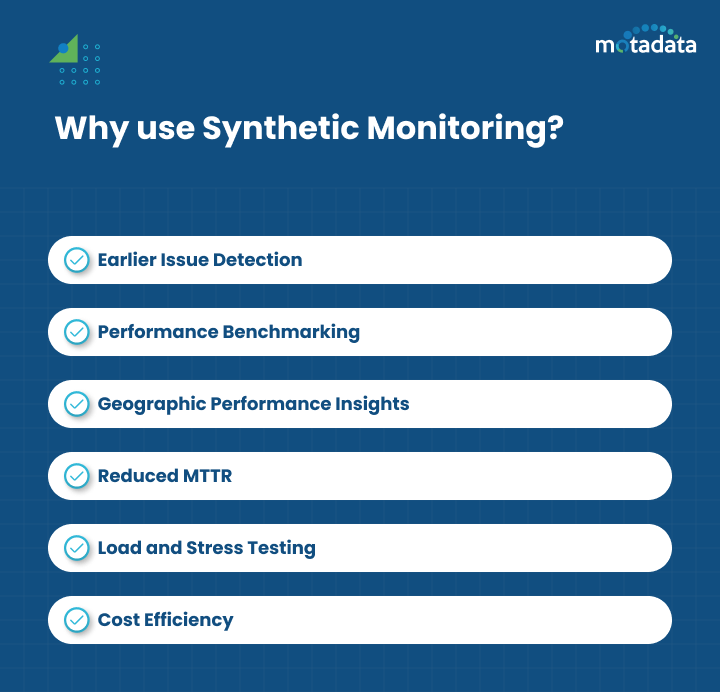
Organizations rely on synthetic monitoring for several critical reasons:
Proactive issue detection: You'll identify errors in application performance and feature functionality before they reach real users. That protects your brand reputation and keeps customers satisfied.
Performance benchmarking: Teams can measure performance against predefined baselines or competitor applications. Comparing current results with historical data reveals deviations and performance trends over time.
Geographic performance insights: Testing from multiple global locations uncovers regional performance discrepancies, including page load speed issues and network latency variations.
Reduced MTTR: Early detection means faster resolution. Teams can minimize downtime and reduce Mean Time to Resolution significantly.
Load and stress testing: Simulating thousands of concurrent users reveals how applications perform under heavy traffic, helping identify bottlenecks and validate scalability.
Cost efficiency: Downtime costs enterprises an average of $5,600 per minute. Proactively catching issues with synthetic monitoring prevents revenue loss before it happens.
Types of Synthetic Monitoring
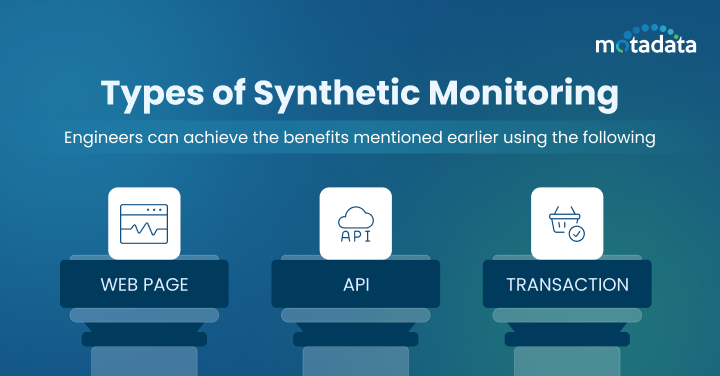
Three primary types of synthetic monitoring address different aspects of application performance:
Web Page Monitoring
This type tracks your web page's loading speed, content rendering, response time, and visual elements across browsers and devices. It catches issues like slow-loading pages, broken elements, and rendering failures that degrade user experience.
API Monitoring
Modern applications depend on internal and external APIs for core functionality. API monitoring validates response times, data accuracy, authentication flows, and error handling across your API ecosystem. It catches underperforming endpoints and integration failures before they cascade into user-facing problems.
Transaction Monitoring
For e-commerce and SaaS applications, transaction monitoring simulates complete user flows -- login, search, add to cart, checkout, and payment processing. It verifies that every step in critical business workflows completes without delays or errors, protecting revenue-generating paths.
Synthetic Monitoring vs. Real User Monitoring: How They Differ
Synthetic monitoring and Real User Monitoring (RUM) take fundamentally different approaches to performance visibility:
Aspect | Synthetic Monitoring | Real User Monitoring (RUM) |
|---|---|---|
Data source | Simulated scripts and artificial traffic | Actual user sessions and behavior |
Timing | Proactive (finds issues before users do) | Reactive (captures issues as users experience them) |
Coverage | Predefined scenarios and locations | All user interactions across all conditions |
Traffic dependency | Runs independently of real traffic | Requires active users to generate data |
Insight type | Short-term errors and availability gaps | Long-term performance trends and user patterns |
Implementation | Automated scripts on testing nodes | JavaScript injected into web pages |
Neither approach alone gives you the full picture. Synthetic monitoring catches issues during off-peak hours and before deployment, while real user monitoring reveals how actual users experience your application under real-world conditions. The strongest monitoring strategies combine both.
How to Analyze Synthetic Monitoring Data
Collecting data is only half the equation -- interpreting it drives action. Follow this approach to extract value from your synthetic monitoring results:
Establish baselines first. Understand your normal response times, load times, availability percentages, and error rates. Without baselines, you can't identify deviations.
Compare across dimensions. Evaluate application performance across locations, browsers, devices, and time periods. A page that loads in 1.2 seconds from your local data center might take 4.5 seconds from Southeast Asia.
Track failure patterns. Monitor failed transactions, timeouts, and recurring errors. A timeout that happens every Tuesday at 2 PM points to a scheduled process consuming resources.
Visualize trends. Use dashboards and visualization tools to spot gradual performance degradation that raw numbers might hide. A response time creeping up 50ms per week won't trigger alerts but will eventually impact user experience.
Implementing Synthetic Monitoring: A Practical Guide
Getting started with synthetic monitoring doesn't require deep technical expertise. Follow these steps:
Choose the Right Monitoring Platform
Select a tool that aligns with your monitoring goals and budget. Look for platforms that offer multi-location testing, support for web, API, and transaction monitoring, intuitive script creation, and robust alerting. A platform with AI-native capabilities can automatically detect anomalies and reduce alert noise.
Define Your Critical User Journeys
Map out the user paths that matter most to your business. Prioritize revenue-generating flows (checkout, signup, payment), high-traffic pages (homepage, product listings), and core functionality (login, search, data retrieval). Start with 5-10 critical scenarios and expand from there.
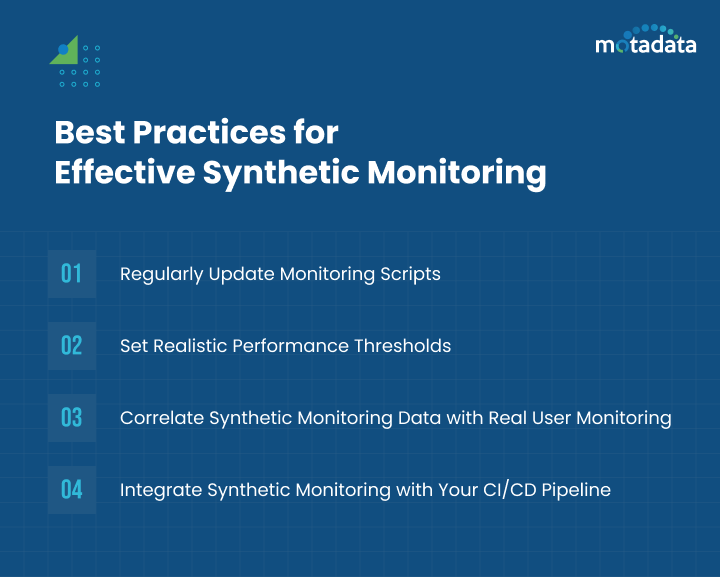
Set Realistic Performance Thresholds
Establish baselines from historical data and set alert thresholds that reflect actual user expectations. Overly strict thresholds generate false alarms that lead to alert fatigue. Overly loose thresholds let real problems slip through unnoticed.
Integrate with Your CI/CD Pipeline
Embed synthetic monitoring into your deployment pipeline to catch performance regressions before they reach production. Automated performance checks during code deployments identify issues early, reducing the cost and complexity of fixes.
Common Challenges and How to Overcome Them
Synthetic monitoring delivers significant value, but teams should be aware of these challenges:
Script maintenance: As applications evolve with new features and UI changes, monitoring scripts need updates. Integrate script maintenance into your CI/CD pipeline to automate updates when code changes.
Coverage limits: Synthetic tests cover predefined scenarios, not every possible user path. Prioritize critical flows and complement with RUM for full coverage.
Geographic accuracy: Testing nodes may not perfectly reflect real-world conditions in every region. Use a monitoring platform with broadly distributed global testing points.
Dynamic content: A/B tests, personalized content, and live data can cause scripted interactions to produce inconsistent results. Design scripts that account for content variability.
Limited real-world context: Since synthetic tests don't capture actual user behavior, pair them with RUM to fill visibility gaps across diverse devices and network conditions.
People Also Ask
Is synthetic monitoring active or passive?
Synthetic monitoring is an active monitoring approach. It proactively sends simulated traffic and test scripts to your applications rather than passively waiting for real user data. This active approach means you can detect issues 24/7, even when no real users are accessing your application.
Can synthetic monitoring replace real user monitoring?
No. Synthetic monitoring and RUM serve complementary purposes. Synthetic monitoring excels at proactive detection, baseline testing, and off-hours coverage. RUM captures the full spectrum of real user experiences. The most effective monitoring strategies use both together.
How often should synthetic monitoring tests run?
Testing frequency depends on the criticality of the application. Mission-critical applications typically run tests every 1-5 minutes. Less critical services may run every 15-30 minutes. Higher frequency means faster detection but also higher resource consumption.
What's the cost of not having synthetic monitoring?
Without synthetic monitoring, you rely on real users to discover performance issues. This means longer outage detection times, higher MTTR, revenue loss from downtime, and damaged brand reputation. For enterprises, undetected outages can cost thousands of dollars per minute.
Catch Performance Issues Before Your Users Do
Modern applications are complex -- spanning multiple services, APIs, cloud regions, and device types. Waiting for users to report problems isn't a strategy; it's a liability.
Motadata's AI-native observability platform delivers unified synthetic monitoring with intelligent alerting, automated root cause analysis, and global testing coverage. It simulates user activity across browsers, web, mobile, and transaction flows to catch bottlenecks before they impact customer experience.
With Motadata, you don't just monitor -- you stay ahead.
Start your free trial of Motadata and see how AI-native synthetic monitoring transforms your application performance strategy.
---
Author
Arpit Sharma
Senior Content Marketer
Arpit Sharma is a Senior Content Marketer at Motadata with over 8 years of experience in content writing. Specializing in telecom, fintech, AIOps, and ServiceOps, Arpit crafts insightful and engaging content that resonates with industry professionals. Beyond his professional expertise, he is an avid reader, enjoys running, and loves exploring new places.


