How to analyze the flow data?

Motadata enables analysis of the network flow through Flow Explorer. It is a fast and large-scale network flow processing tool that enables the visual representations of flow datasets effortlessly through a Sankey diagram.

Go to the Menu, Select Flow Explorer . The Flow Dashboard screen is now displayed.

The flow analysis in Motadata AIOps could be done in one of the following ways:

  • Preset Dashboards: Multiple inbuilt dashboards are available on the flow analytics screen. These represent important data sets such as Top 5 Conversation and Top 5 Protocols in graphical form.
  • Flow Explorer: This tool can help you visualize the flow for all the devices sending their flow data to Motadata AIOps.

Overview

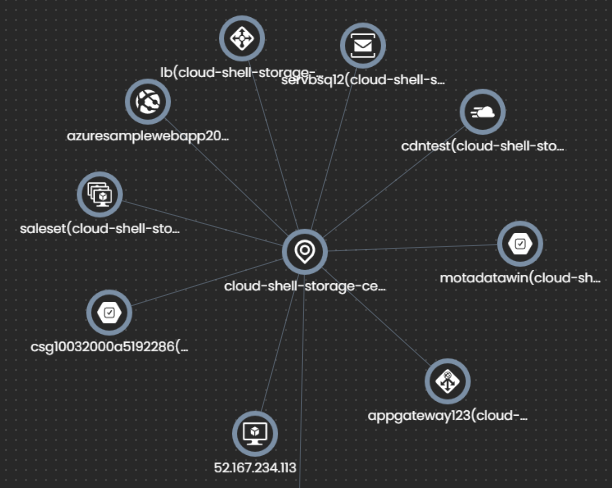
A visual representation of the network infrastructure helps you find the relationship between different elements of your network which in turn helps you to gain a better understanding of the same. This customizable visual representation of your architecture is achieved in Motadata through a Topology map.

Current networks are large, dynamic, and complex with ever-changing components. Under these circumstances, it becomes difficult to achieve optimum performance and network health to ensure business continuity. A comprehensive view of the network then becomes essential and a network topology map can provide this.

Topology maps are dynamic in nature to reflect the current state of your system without having to make manual changes in the network topology when the components of your infrastructure change. The topology reflects the latest links and device status subject to the timely run of the topology scanner.

These maps depict the relationship between the various infrastructure components including switches, routers, firewalls, virtual devices, and cloud services.

These real-time topology maps can be used to visualize complete IT infrastructure, locate the root cause of the issue quickly and efficiently and help you decide on a fix for the same.

The protocols supported for creating a topology map of a network device in Motadata are:

  • Layer 2 protocols
    • Cisco Discovery protocol
    • Link Layer Discovery protocol
    • Switch Port Mapping protocol
  • Layer 3 protocols
    • Open Shortest Path First protocol
    • Border Gateway protocol
    • Intermediate System to Intermediate System protocol

The protocols supported for creating a topology map of a virtual device in Motadata are:

  • Hyper-V
  • VMware
  • Citrix Xen

Network observability through Flow analysis

Understanding the internal state of networks is an important component of managing overall performance and reliability of your infrastructure. You cannot manage the overall software environment and user experience effectively unless you are able to manage the performance of its network.

Flow analysis helps you align resources to support business results and gain credibility by making data-driven decisions.

You can make better business decisions by studying the flow data of your network:

  • Monitor network bandwidth usage at a granular level and identify users with maximum bandwidth usage.
  • Trace the conversations between internal and external endpoints.
  • Analyze traffic patterns over months, days or minutes by filtering out data for any network element.
  • Enhance bandwidth capacity before outages occur.

Network observability has assumed even more importance in recent years due to the increase in the complexity of networking architectures. In the past, networks were relatively simple in nature. They were usually mapped to a specific location such as a single data center and their configurations did not change constantly.

In contrast, modern networks often span multiple data centers and/or clouds.

By providing continuous visibility into networks, as well as helping teams to map the network state to the organisational business contexts, such as availability and performance guarantees, network observability allows an organisation to handle the complexity of modern networks and ensure that their network supports their business expectations.

Overview

A major use-case of AIOps is Network observability, which in turn could be defined as analyzing the metrics in a network to understand what is happening inside it, and how the internal state of the network impacts business objectives and the user experience.

One of the ways to achieve this observability is by analyzing the flow of your network. This includes monitoring overall network bandwidth usage, identifying users, applications, protocols, and IP address groups that consume most bandwidth, analyzing their traffic patterns, and more.

This enhanced visibility into your network’s applications, hosts, and conversations enables you to proactively manage your network to reduce outages, solve problems faster and ensure efficient and cost-effective operations.