Topology Scan
A topology scanner can be used to set up the topology maps for network devices on the Topology scan.

A topology scanner can be used to set up the topology maps for network devices on the Topology scan.
The agent-based setup consists of two main components at a high level:
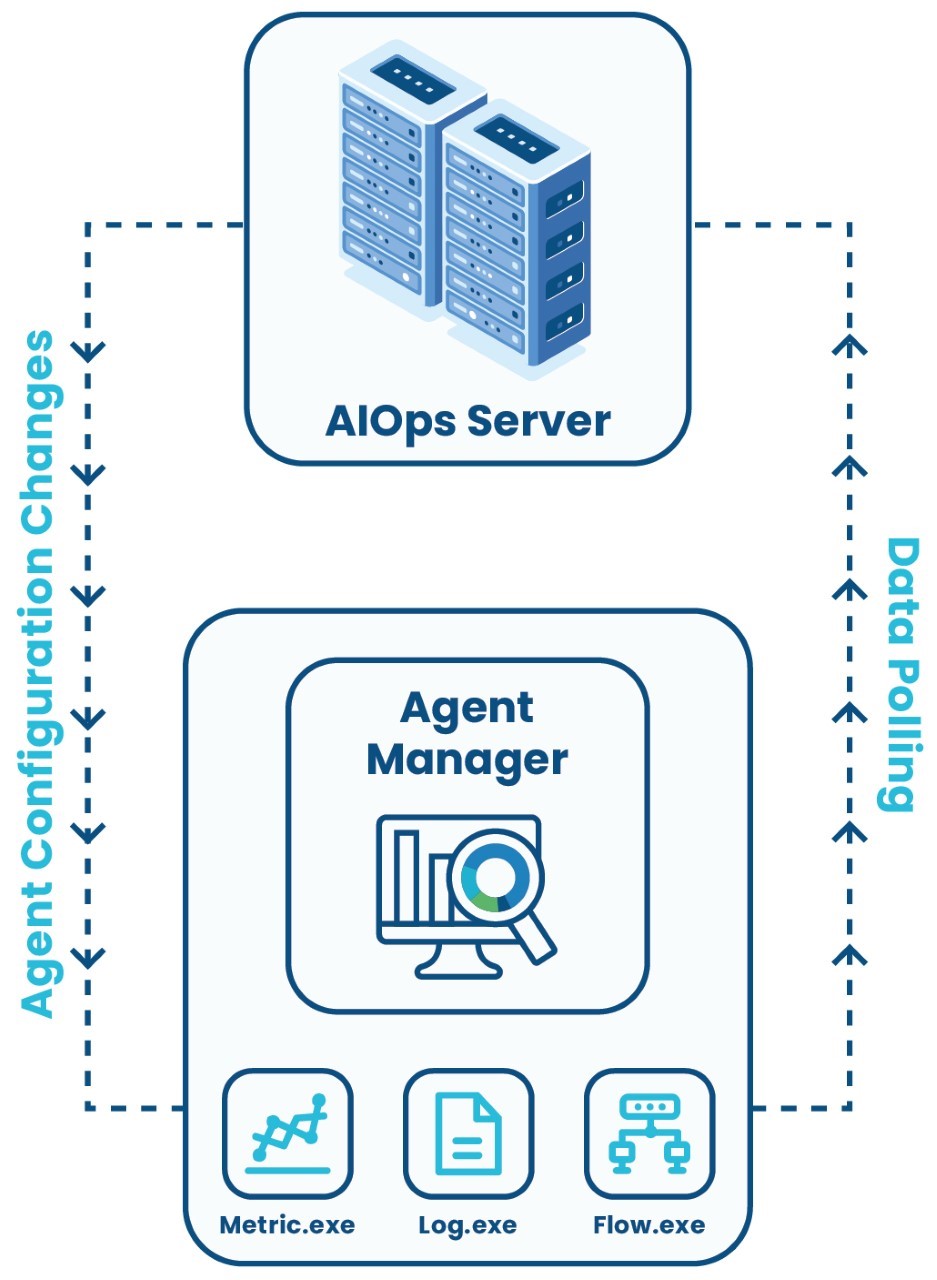
Let us discuss the two major components in further detail.
In Agent-based Monitoring, you can install a software called “agent” on a device, whether Linux-based or Windows-based so that Motadata AIOps can monitor the device through the agent. The agent installed on the device polls the data and sends it to Motadata AIOps on the main server for monitoring.
It is recommended that the agent be installed on not more than X devices.
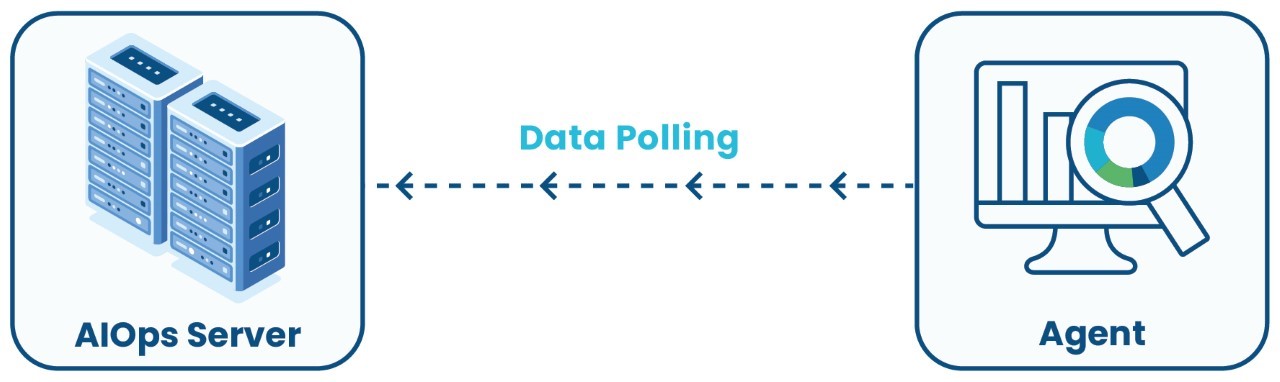
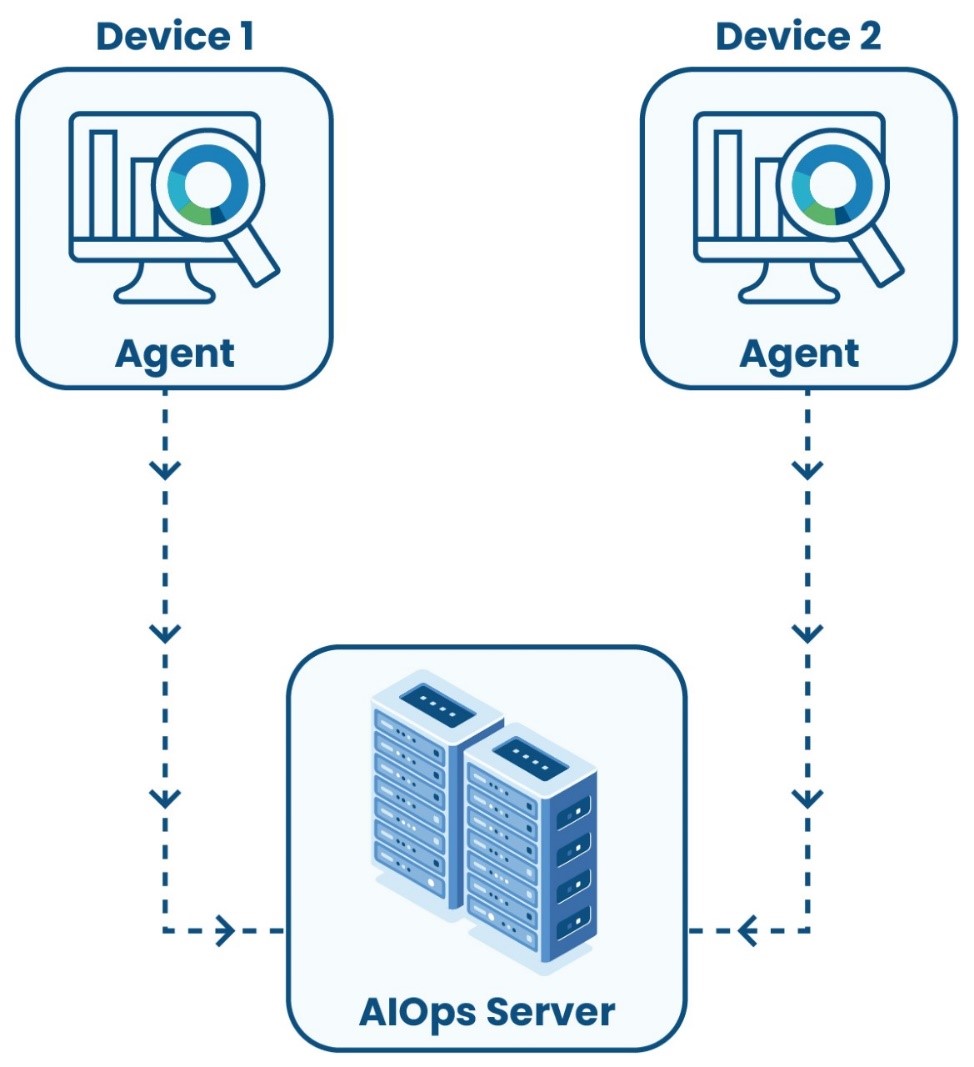
Motadata’s Agent-based monitoring establishes communication between the Agent and AIOps Server to start monitoring the device with the agent. Agents are programs that run on remote machines and send the data to the master AIOps server. The Agent constantly monitors the devices and sends the required data at a specific time interval to the AIOps server.
Once the agent is installed on a device, it is registered as an agent-monitored device on the AIOps server. The device must have a unique hostname to be registered for monitoring as AIOps uses the hostname of a device to identify it.
The agent allows you to collect and process real-time metrics from the device as the agent has a polling interval of only 1 second.
In case the communication link between the agent and the Motadata AIOps is lost, the monitoring data won’t be lost as it will be stored in the agent for up to X hours.
Monitor the entire infrastructure by eliminating performance issues.
You simply need to install an agent in your device to start monitoring the data. No authentication is required in this case.
Quickly access the needed information from the system, contributing to improved customer satisfaction.
Even if the IP address of a device is variable, data monitoring won’t stop as the agent is physically installed on the device.
Motadata allows you to run rediscovery for monitors to discover specific instances within these monitors for monitoring.
To explain this further, let us take some examples.
Go to the Main Menu, Select Settings ![]() . After that, go to Monitoring
. After that, go to Monitoring ![]() .Select Rediscover Settings. The interface to rediscover the instances within a monitor now displayed.
.Select Rediscover Settings. The interface to rediscover the instances within a monitor now displayed.
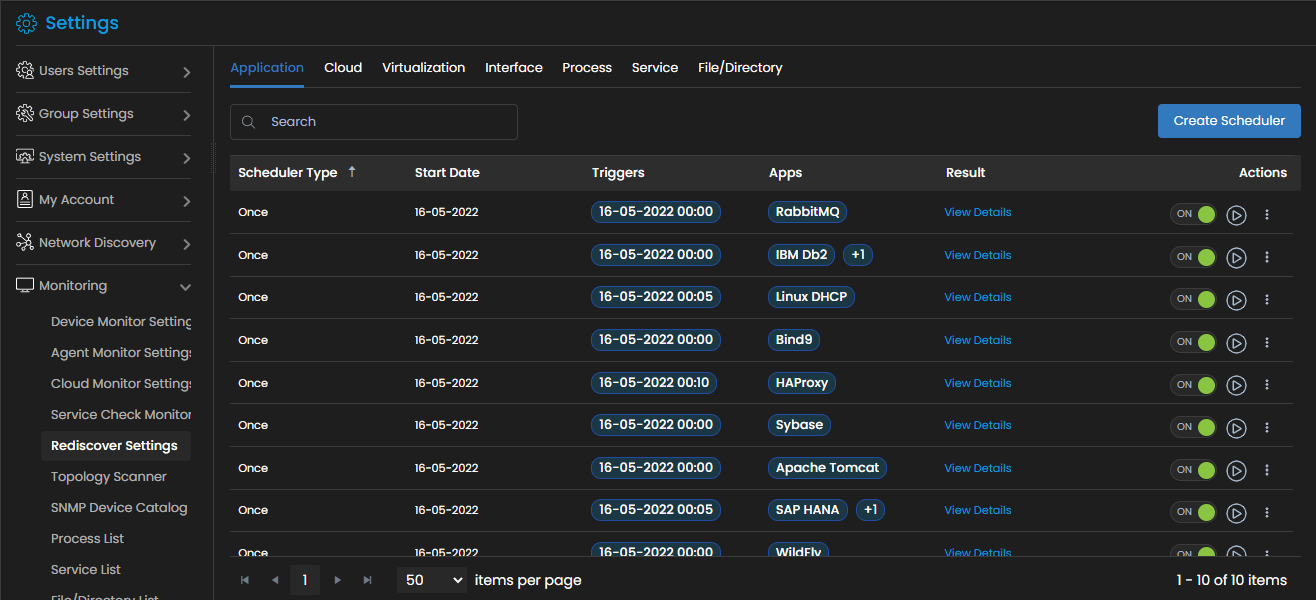
Select the following tab as per the instance you want to discover:
Here, you can configure a scheduler to run for rediscovery.
The following details for the created schedulers are now available to view under each tabs:
| Scheduler Type | The frequency at which the scheduler runs. |
| Start Date | The start date at which the scheduler runs. |
| Triggers | The start time at which the scheduler runs. |
| Monitors | The monitor for which the scheduler runs. |
| Result | The details of the run of scheduler and hence the discovered instances can be viewed here by clicking on the View Details button. |
| Actions | The following actions are available to be taken on any scheduler
|
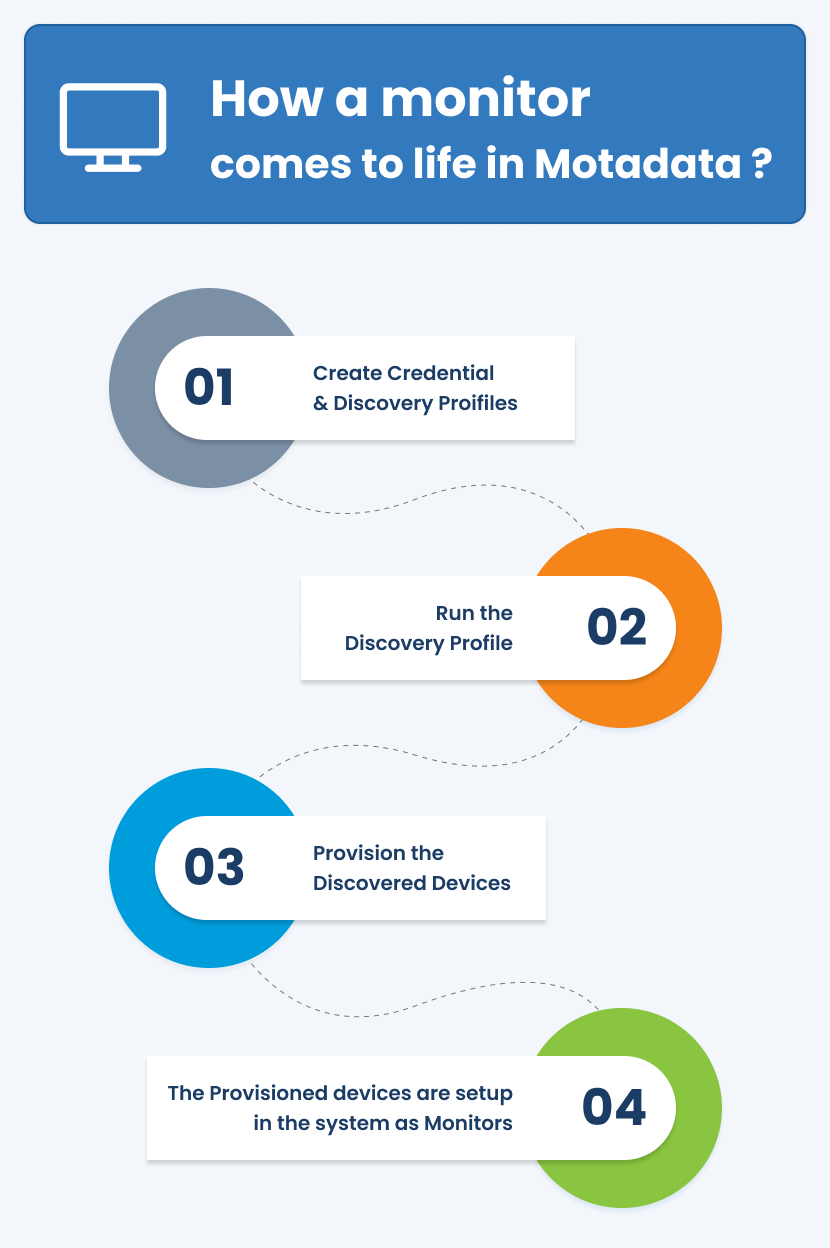
A Monitor is an IT infrastructure component discovered and subsequently provisioned in Motadata for the purpose of monitoring. The monitor facilitates judging the real-time state of the system and generates insights into its performance.
At the application level, a monitor is any entity that is provisioned by a Motadata user after running a discovery. Motadata keeps track of the various performance metrics for an IT infrastructure at the monitor level. The data polling for the metrics is done by Motadata at the monitor level.
The analysis and the insights provided by Motadata via any of its multiple features, be it, Topology, Metric explorer, Log explorer, or Alerts and Policies is done by using the values of the metrics collected at the monitor level.
Let us understand how a monitor is created in Motadata.
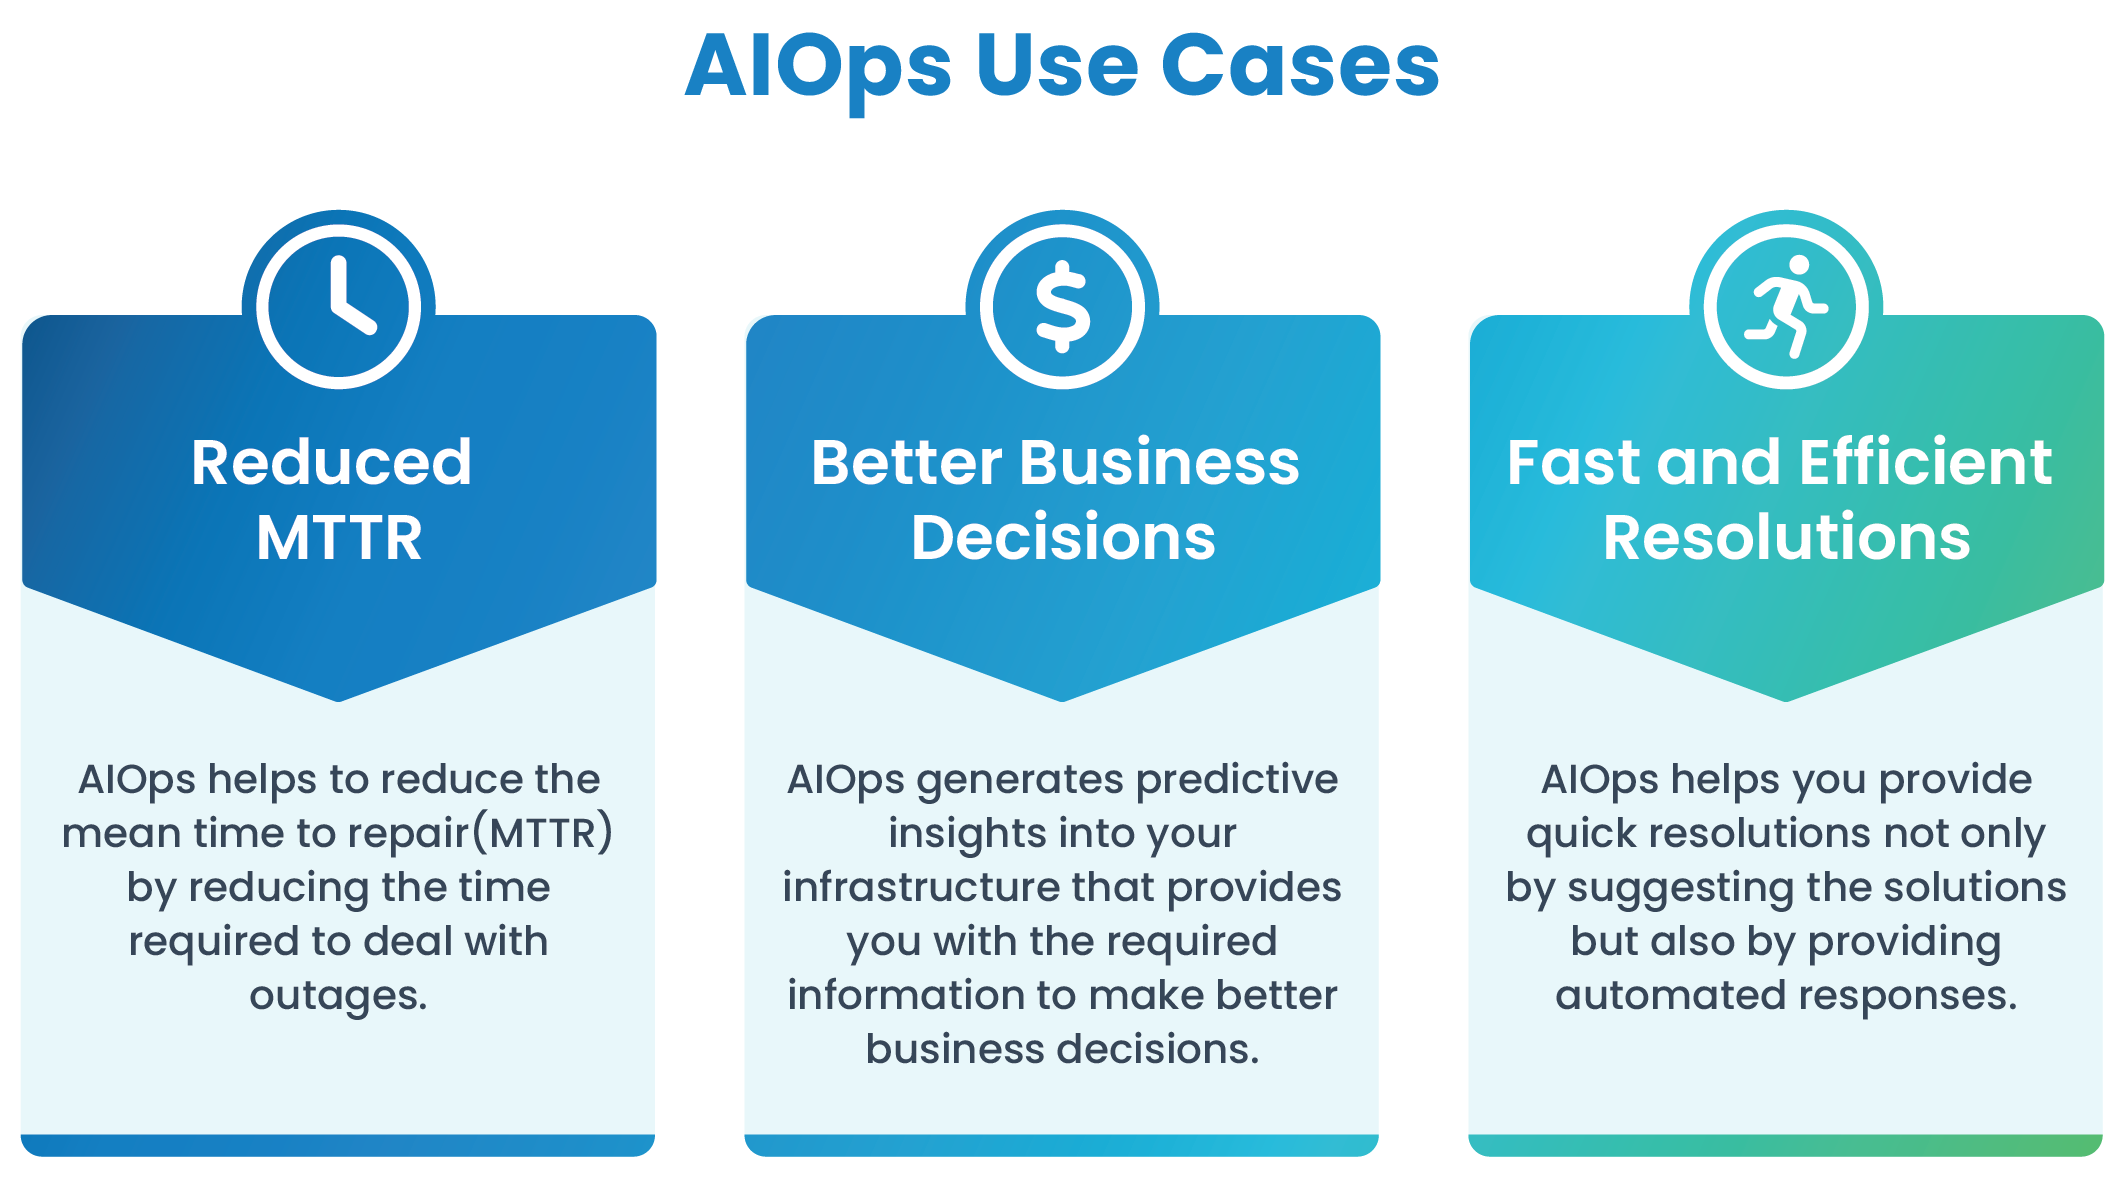
The key capabilities and benefit of AIOps is that it gives DevOps, SRE and ITOps teams the speed and agility they need to detect incidents early in order to ensure the uptime of critical services and the delivery of an optimal customer experience. It’s been hard for these teams to accomplish this due to the evolution of IT infrastructures — moving from static and predictable physical systems to software-defined resources that change and reconfigure on the fly. This demands an equally dynamic technology to deal with these challenges and AIOps is the answer to these challenges.
"There is no future of IT operations that does not include AIOps. This is due to the rapid growth in data volumes and pace of change(exemplified by rate of application delivery and event-driven business models) that cannot wait on humans to derive insights."
AIOps helps IT professionals in three major areas:
Go to Main Menu, Select Dashboard ![]() . The default dashboard screen is displayed.
. The default dashboard screen is displayed.
Select ![]() on the top right of the screen above the dashboard to display the options available for a dashboard:
on the top right of the screen above the dashboard to display the options available for a dashboard:
Select ![]() on the top right of any widget to display the options available for a dashboard:
on the top right of any widget to display the options available for a dashboard:
The modern IT infrastructure is complex and generates massive sets of data from multiple sources present in the infrastructure. Imagine all of this data at one place and unorganized. Would you be able to use this data effectively?
Would you rather have this data organized and presented you in a way that is not only easy on your eyes, visually stimulating but also presented effectively such that you are able to make efficient business decisions?
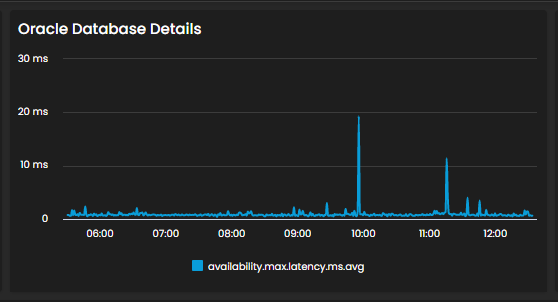
Look at the picture below. Even though the data here is presented in an organized manner, you are not able to make sense of the collected data and make business decisions simply based on raw data, whether organized or unorganized.
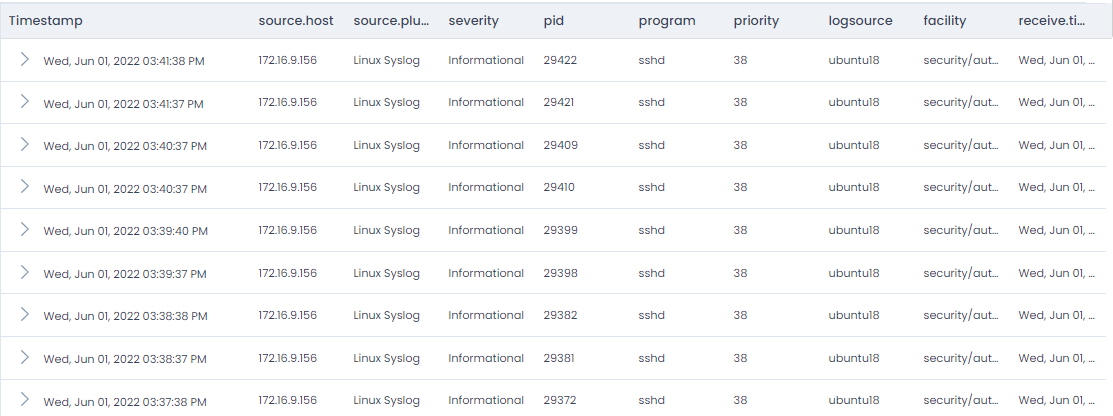
The data collected from the multiple sources in infrastructure needs to be presented in a manner that’s meaningful, and easy to understand such that it enables efficient decision making while enabling you to learn the state of your system and applications faster and allowing quick troubleshooting.
Now, let’s look at a couple of more images.
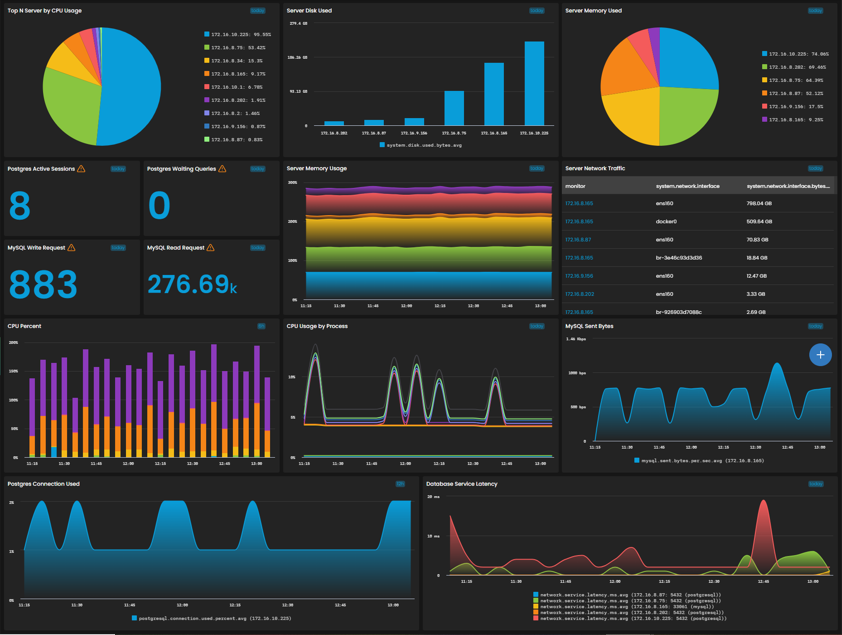
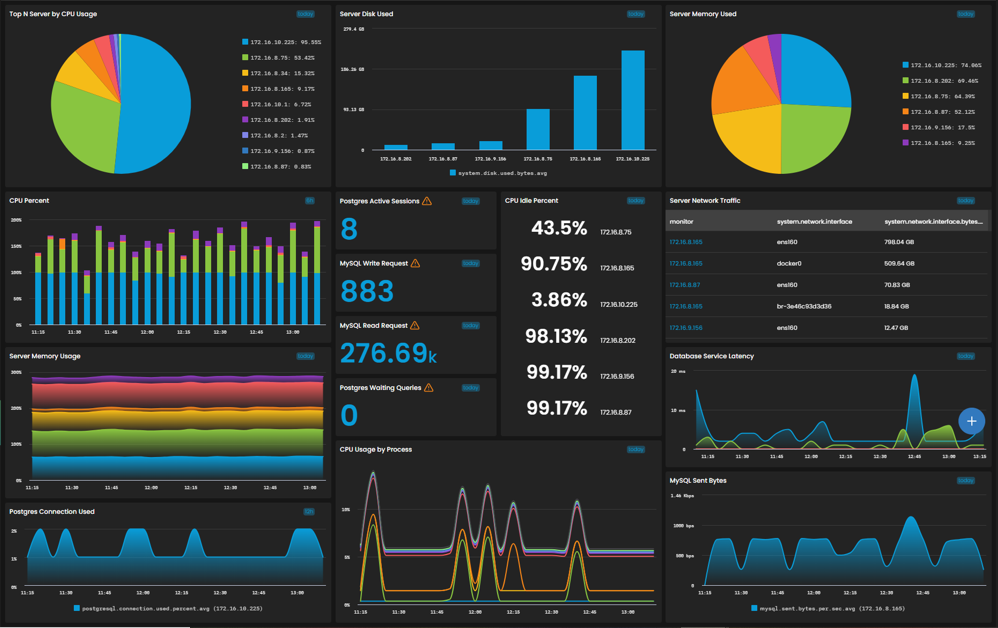
This image depicts a dashboard showing server details on widgets effective for visually tracking, analyzing, and displaying key performance metrics that enables you to learn the health status of your infrastructure in just a single glance.
The dashboard in Motadata consists of multiple widgets that can be selected, configured, and positioned on the go to best meet your requirement. The widgets display the data in the form of various graphs such as a pie chart, bar diagram, or sometimes even as a simple list, and so much more. Additional information can also be obtained by hovering the mouse cursor over the diagrams on the widget.
Motadata allows you to create customized dashboards and at the same time also provides multiple pre-configured dashboards to visualize the metrics that are most useful to the users. You can select a monitor from any of the widgets on the dashboard to view details related to that monitor.
Using Motadata dashboards you can:
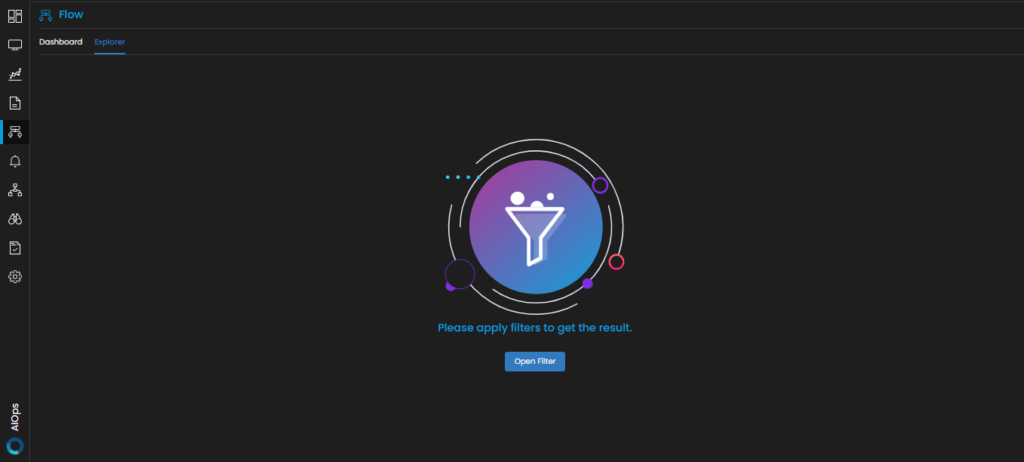
Flow explorer is a tool that enables you to graphically visualize the flow data for all the devices sending flow to Motadata AIOps server. Flow explorer provides consistent visibility into your network allowing you to judge essential infrastructural requirements, make business-driven decisions, and ensure efficient and cost-effective operations based on the network flow data presented to you.
Go to Menu, Select Flow Explorer ![]() . After that, Select Explorer. The Flow Explorer tool is now displayed.
. After that, Select Explorer. The Flow Explorer tool is now displayed.
Let us consider an example to understand how to use the flow explorer.
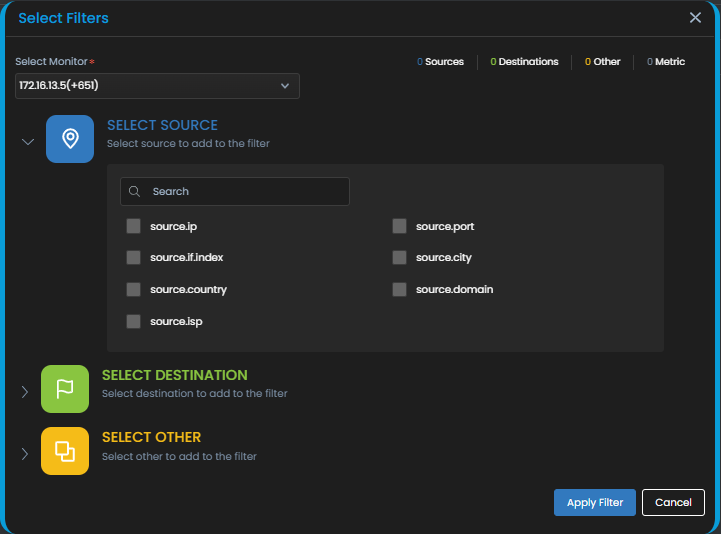
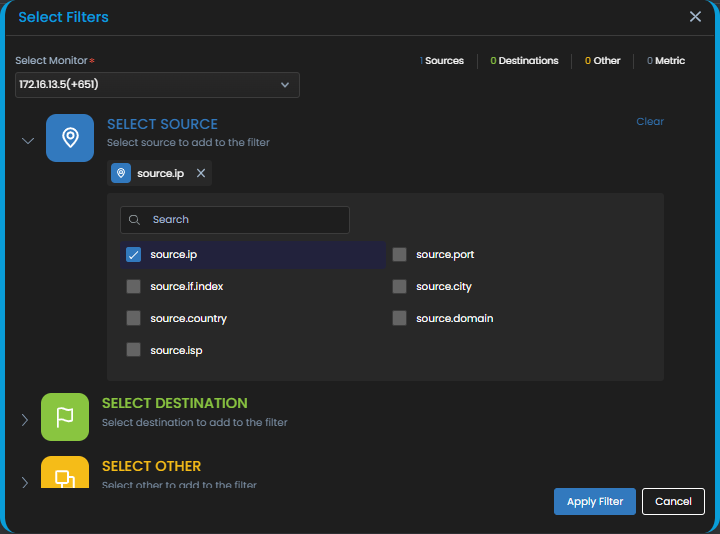
We have a flow forwarder device, 10.20.40.97 that sends flow details to the Motadata console. This device stores the flow details of source IPs in the range 192.168.0.1 – 192.168.0.5. These devices communicate with a wide range of destination IPs. They communicate via destination port 443 using the communication protocol TCP.
Now, let us see how we can visualize this information in flow explorer.
Select the ![]() button to start.
button to start.
A pop-up asking to enter the filter inputs is displayed. We then go ahead and enter the inputs as per our example:
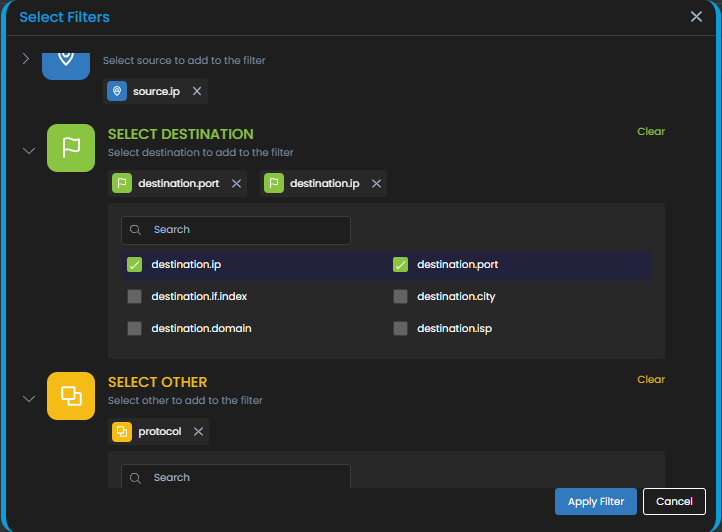
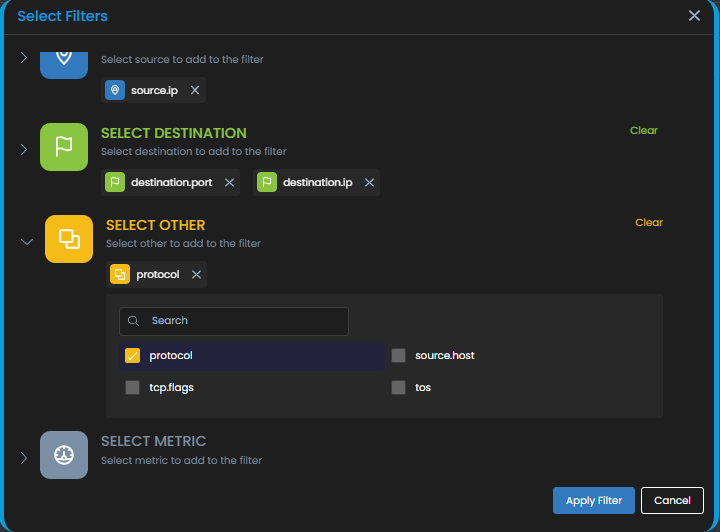
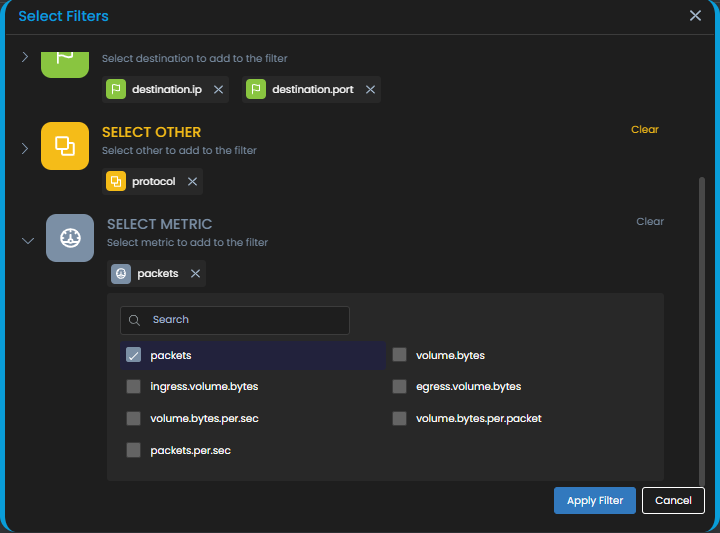
Select Apply Filter to create the Sankey chart representation of the flow data based on the inputs you selected.
Select Cancel if you do not wish to create the Sankey chart representation.
The Sankey chart representation in this case will be as follows:
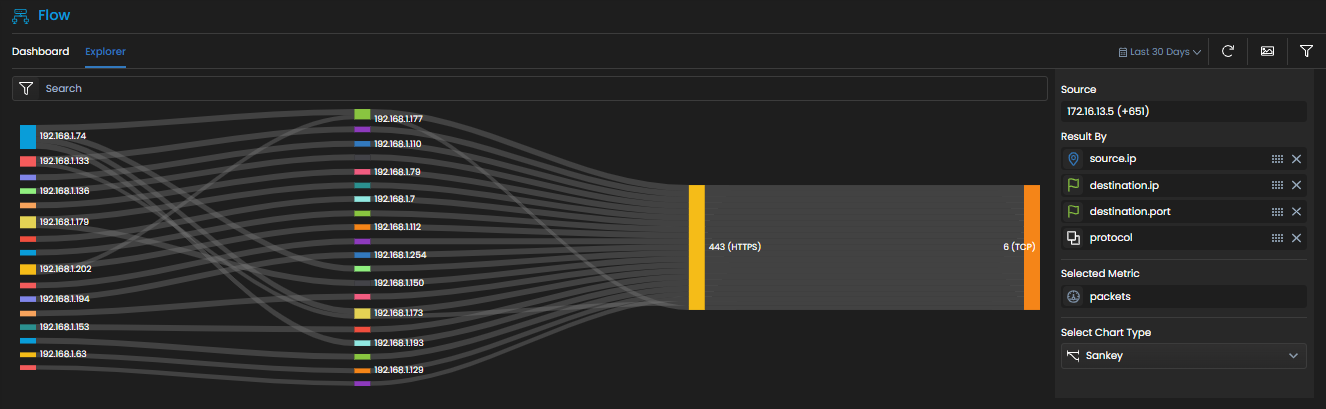
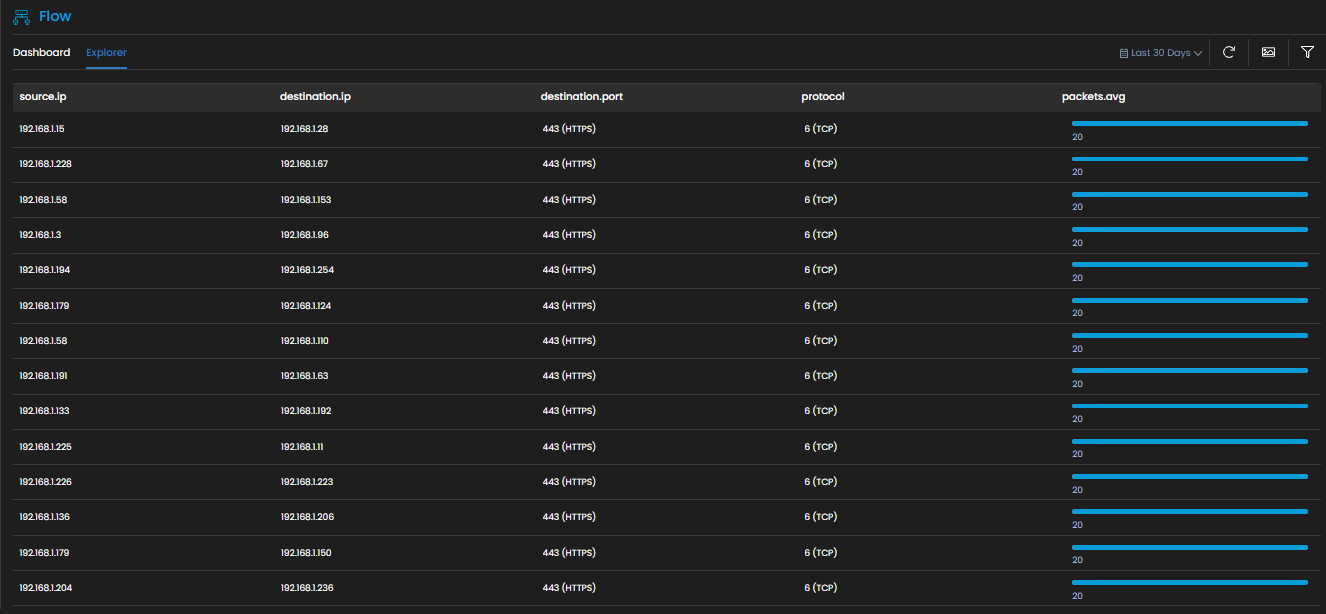
You can also view the list of values for all the fields you selected to create the diagram. Each record in this list represents a link between the source and the destination in the diagram you created.
This list can be viewed below the Sankey diagram as seen in the following picture.
In order to view flow data of a device in flow explorer, the device must be configured to push the data to Motadata AIOps server. If you do not configure your device to send data, the Flow explorer is not able to populate the relevant flow data.
The device forwarding the flow data must be configured to send the data to port 2055 of your Motadata console.
Select the Event Source Select the source(s) for which you want to display the flow data on the dashboard.
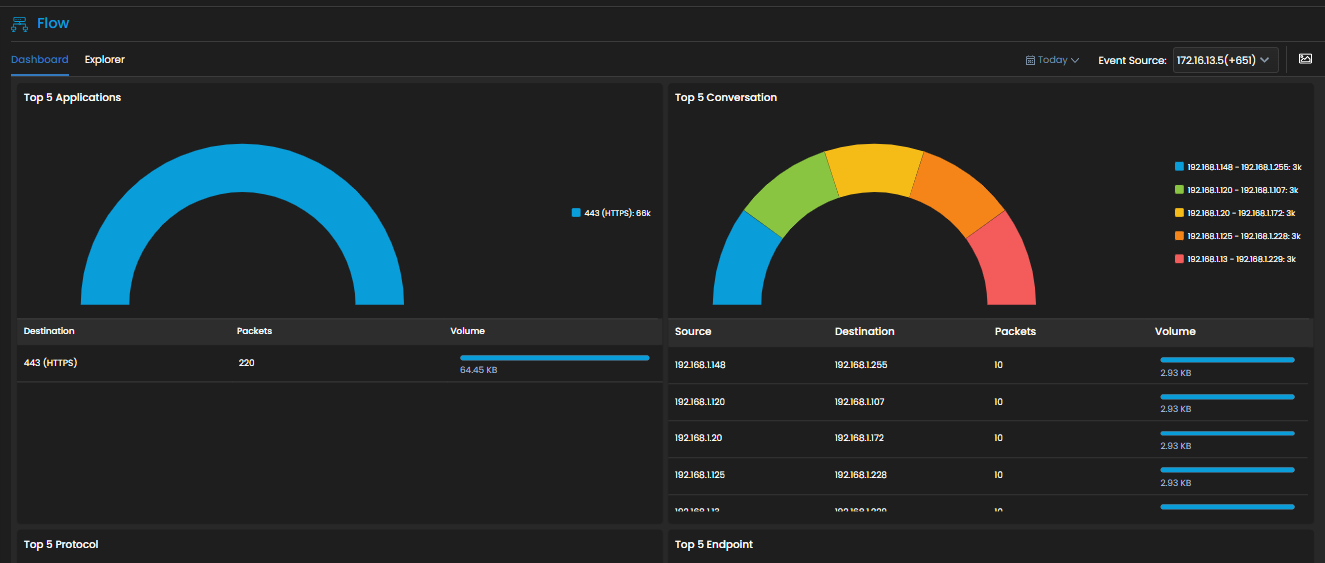
Click on the Event Source drop-down at the top-right of the screen above the dashboard. The list of all the devices for which flow data is being sent to Motadata AIOps can be seen in the dropdown. Select the devices for which you want to display the data on the dashboards as per your requirement from the drop-down.