How to view and analyze the logs?

Overview

Once you have configured the logging source, the logs are then available in the log explorer for you to view and analyze. Log explorer acts as a comprehensive tool to analyze the logs and troubleshoot the issues, assess them quickly enabling you to fix the issues in your infrastructure.

Go to Menu, Select Log Explorer . The Log explorer is now displayed.

Intelligent categorization of logs

Log explorer classifies the logs in your infrastructure intelligently so that you can easily locate the logs you need.

This classification is done based on the Type and the Group of the logs in your infrastructure.

  • TypeThe logs are classified based on the type of source of the logs, i.e., Platform, application, or the device from which the log is generated. For example, some of the categories are as follows: Linux, Windows, and Firewall.
  • GroupThe logs are classified based on the category of logs they belong to. For example, some of the categories are as follows: Linux Syslog, Microsoft IIS Log, and Windows EventLog.

This categorization of logs is available in the log explorer on a panel beside the Main menu. You can click on any category under Type or Group based on your requirement to reveal the sub-category that might be present under it until you find the log source at the lowest level. You can select this log source to reveal the log details on the Log Search screen.

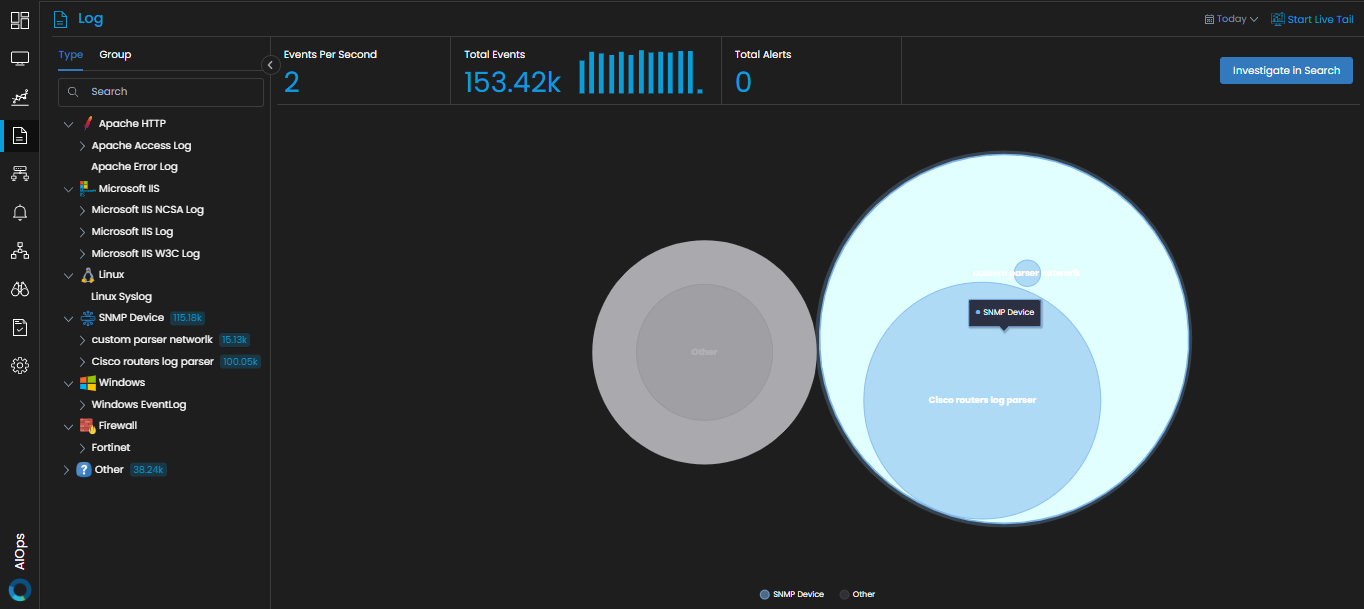
Graphical representation of log count based on the log type

The log explorer main screen shows a graphical representation depicting the classification of logs based on their Type and the count of log events for each type. This graphical representation is in the form of circles to make the classification of logs and the log counts easy to comprehend with a quick view.

Each circle represents a log type in the graph. There are two important points to understand these graphs.

  • The larger the diameter of the circle, the higher the count of log event messages for that particular log type.
  • A circle within a circle represents the hierarchy of the log types. The inner circle is a sub-category of the outer circle.

A few important details related to log events can be seen on the log explorer screen:

  • Events per second: The number of log events per second being sent to the Motadata log explorer from multiple entities in your infrastructure.
  • Total Events: The total number of log events being sent to Motadata log explorer from multiple entities in your infrastructure.
  • Total Alerts: The total number of active log alerts in your infrastructure.

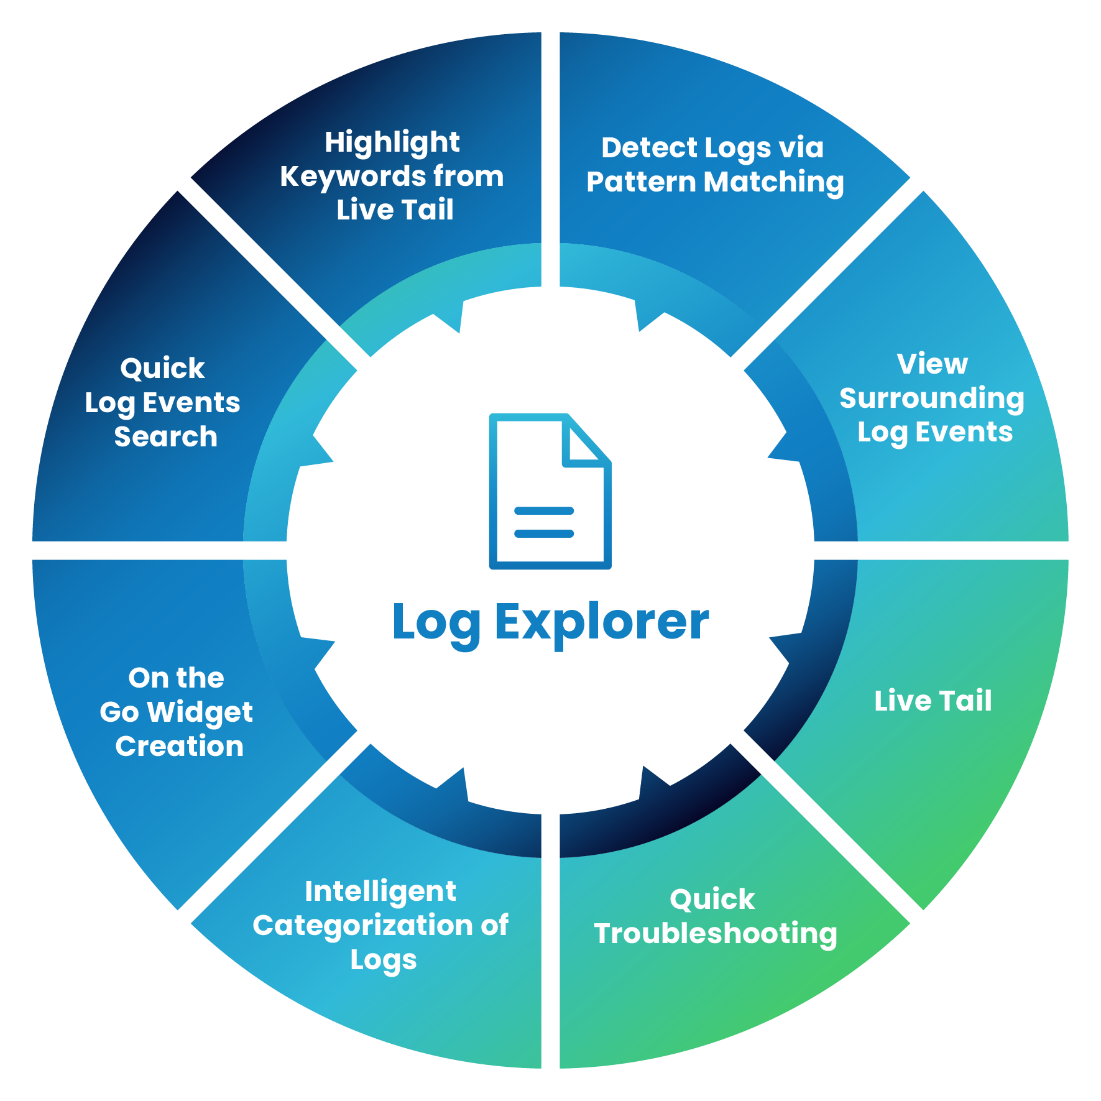
Advanced Log Investigation

For detailed investigation and search of particular log events, we can use one of the multiple log investigation features available in the Log Explorer.

This can majorly be divided into two categories:

  • Log Search
  • Log Analytics

Log Management

Overview

Metrics do not answer everything about your network infrastructure. Metrics help you answer ‘What’ while logs are all about the ‘Why’.

Modern Infrastructure can generate thousands of logs per minute which turns the large volumes of log data available messy and difficult to make sense of. Hence, it becomes essential to have all the log data available at a centralized location but even then, it would be very difficult to find a particular value from millions of lines of code generated from all the devices in your network infrastructure.

Also, it would be very difficult and expensive to store and analyze such huge volumes of data.

Motadata Log explorer does all the above for you and much more so you don’t just make sense of the data but also make intelligent decisions based on the log analysis.

  • Dynamically parse and visualize millions of lines of log data with out-of-the-box inbuilt parsers.
  • View the live tail of the logs being generated in real-time.
  • View the surrounding logs related to a certain log event with just one click.
  • Identify specific logs through machine learning powered pattern matching for logs.
  • Search and highlight required keywords from the live tail.
  • It makes life easier by collecting, processing and centralizing logs into a log explorer.
  • Allows quick troubleshooting and reduces context switching by easily identifying logs through intelligent categorization of logs.
  • Allows to create widgets on the go for specific log data that you wish to view repeatedly.

How to delete a Monitor?

Overview

Motadata AIOps allows you to delete a monitor. Once deleted, the monitor will not be available for further use in the system.

Go to Menu, Select Settings . After that, Go to Monitoring . Select Device\Cloud\Agent\Service Check Monitor Settings based on the monitor you want to delete.

Navigate to the monitor you want to delete. Under the Actions tab, select to display the dropdown menu as displayed below.

Select Delete from the drop-down menu. A pop-up to confirm the deletion of the monitor is displayed as follows:

Select Yes to delete the monitor from the system.

Select No if you do not wish to delete the monitor from the system.

Edit Monitor Details

Overview

Motadata AIOps allows you to edit certain values of a monitor from the Monitoring Settings console.

Go to Menu, Select Settings . After that, Go to Monitoring . Select Device\Cloud\Agent\Service Check Monitor Settings based on the monitor you want to edit.

Navigate to the monitor you want to edit. Under the Actions tab, select to display the dropdown menu as displayed below.

How to edit the Monitor details?

Select Edit from the drop-down menu. A pop-up displaying the details of the monitors is displayed as shown in the picture below.

You can edit the monitor fields as required.

Select the Reset button to erase all the current field values, if required.

Select the Update Monitor button to save the changes you have made to the monitor fields.

Configuring a Monitor Maintenance Window

Overview

Motadata AIOps is equipped with a feature that allows you to identify if a particular monitor is under maintenance. Once you mark the monitor as under maintenance, the monitor is turned off for further surveillance.

Go to Menu, Select Settings .After that, Go to Monitoring . Select Device\Cloud\Agent\Service Check Monitor Settings based on the monitor you want to indicate under maintenance.
Navigate to the monitor you want to indicate under maintenance. Under the Actions tab, select to display the dropdown menu as displayed below.

Turning Maintenance ON/OFF

  • Select On Maintenance to indicate that maintenance is underway for a monitor. This will change the status of the monitor from Enable to Maintenance .
    This means the monitor is no longer under surveillance by Motadata.
  • Select Off Maintenance to indicate that the maintenance is no longer running for a monitor. This will change the status of the monitor from Maintenance to Enable .
    This means the monitor is once again under surveillance by Motadata.

How to schedule Maintenance window for a monitor?

Motadata allows you to create a maintenance schedule for a monitor which would allow the maintenance to be run either once or multiple times at specified time intervals in the future.

Navigate to the monitor to schedule its maintenance. Under the Actions tab, select to display the dropdown menu as displayed below.

Select Schedule Maintenance to display a scheduler pop-up as shown below.

Fill in the details in the pop-up to create a scheduler. The following parameters are present in the pop-up:

On Maintenance

  1. Start Date: Select the date at which the maintenance is scheduled to start.
  2. Hours: Select the time at which the maintenance is scheduled to start.

Off Maintenance

  1. Start Date: Select the date at which the maintenance is scheduled to end.
  2. Hours: Select the time at which the maintenance is scheduled to end.

Scheduler Type

  1. Once: Select this field to schedule the maintenance only once.
  2. Daily: Select this field to schedule the maintenance to run daily.
  3. Weekly: Select this field to schedule the maintenance to run on a weekly basis. You can even schedule the maintenance on multiple days of the week in the selected time period.
    1. Days: Select the days of a week when the maintenance will run.
  4. Monthly: Select this field to schedule the maintenance to run on monthly intervals. You can schedule the maintenance to run on specific months and dates in the selected time period.

    1. Months: Select the months when the maintenance will run in the selected time period.
    2. Dates: Select the dates when the maintenance will run in the selected time period.

Select Schedule once all the details are filled out. The Maintenance Schedule is now set up as per the specified parameters.

Custom Monitoring Fields

Overview

Suppose you need to add a custom monitoring field with a fixed value against the monitors, you can create a field of your own to do so. This field can be used for grouping or tagging purposes to filter out certain monitors as per your requirement.

For example, There are multiple monitors located at a particular location. You can add a custom field at the monitor level to mention the location of monitors. You can create a custom field with a fixed value and assign the field to all the monitors discovered from that particular location. The field is then available to view against these monitors on the Monitor Screen as well as the Device/Agent/Cloud/Service Monitor Settings Screen.

Go to Menu, Select Settings . After that, go to Monitoring . Select Custom Monitoring Field. The screen to manage the custom monitoring fields is now displayed.

Custom Monitoring Field Screen

The fields displayed on the screen:

Field Name The name of the custom field.
Actions Select to display permissible actions for the Custom Monitoring Fields. The following actions are available:

  • Edit Custom Monitoring Field: Select this button to edit the custom monitoring field.

You can then add this field against a monitor in the Device/Agent/Cloud/Service Check Monitor settings. Select the Edit option. After that click on 
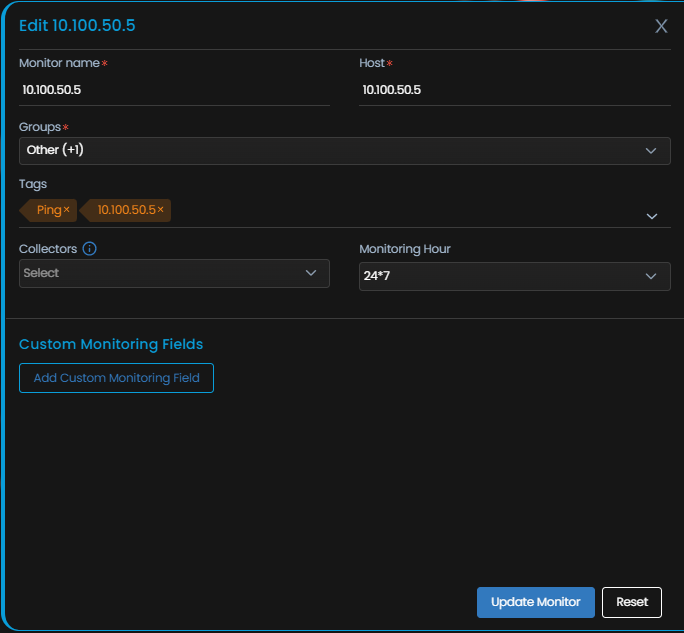
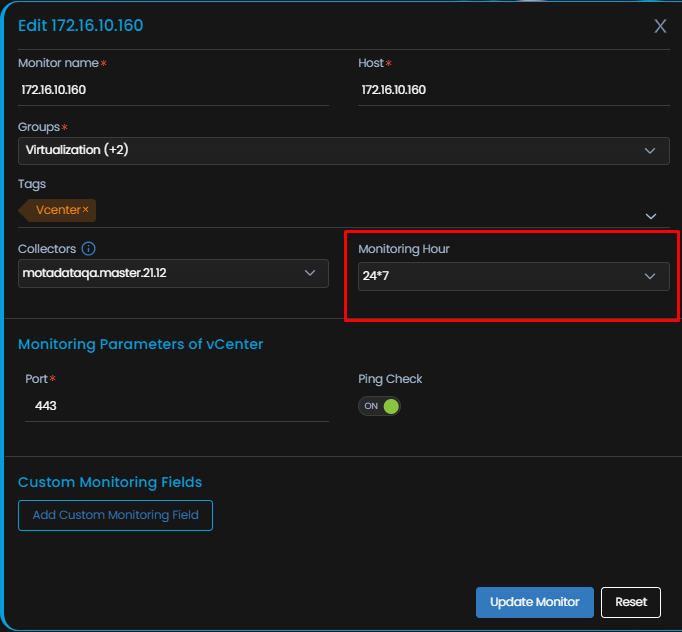
to add the custom field to the selected monitor.

Configure the Monitoring Time-period

Overview

By default, Motadata is in an active monitoring state 24*7, that is, Motadata carries out data-polling all the time.

But you may not want the monitoring to be done all the time or be notified with alerts outside of your business hours. Motadata takes care of this by allowing you to configure the active monitoring hours in which the data polling is done.

Go to Menu, Select Settings . After that, go to Monitoring . Select Monitoring Hour. The screen to change the monitoring hours of Motadata AIOps is now displayed.

Click on the button. The screen asking for your inputs to configure a new monitoring hour is displayed.

  • Enter the Monitoring Hour Name.
  • Select the time and days as per the monitoring window you want to configure.

Select the Reset button to erase all the current field values, if required.

Select to create the monitoring hour as per your requirement.

A monitoring hour is now created.

How can Configuring the Monitoring hour be useful?

    • Changing the monitoring hour for particular monitor(s):
      • There might be a case where you want a monitor to be monitored during a specific time period. You can create a monitoring hour accordingly.
      • The monitoring hour you just created has to be assigned to the monitor using the Edit monitor option from Device/Cloud/Agent/Service Check Monitor Settings.
      • Select Monitoring Hour to assign the monitor hour to the monitor selected.

  • Changing the monitoring hour in bulk for multiple devices:
    • There might be a case where you want multiple monitors to be monitored during a specific time period. You might even want all the monitoring to be done at a time period totally different from the default time. You can create a monitoring hour accordingly.
    • The monitoring hour you just created has to be assigned to the monitors using the bulk update option. Navigate to Device/Cloud/Agent/Service Check Monitor Settings.
    • Select all the monitors to which you want to assign the monitoring hour using the check-box in front of the monitor.
    • Select Monitoring Hour to assign the monitor hour in bulk to all the monitors selected.

File and Directory Monitoring

Overview

Motadata enables you to monitor a file or a directory from a monitor (in this case, the monitor would be a server, whether virtual or non-virtual).

The metrics related to a file or a directory can be made available for monitoring by adding its path to the File/Directory Monitor Settings and then running discovery through Rediscover Settings.

Go to Menu, Select Settings . After that, Go to Monitoring . Select File/Directory Monitor Settings to display the list of all the processes in the system.

File/Directory List

The File/Directory Monitor Settings displays the following fields:

Path The path of the file/directory that can be monitored.
Type Indicates whether the path belongs to a File or a Directory.
OS Type The type of operating system to which the File or the Directory belongs. This is further categorized into the following:

  • Windows
  • Linux
  • IBM AIX
  • HP-UX
  • Solaris
Actions Select to display permissible actions on the File/Directory. The following actions are available:

  • Edit File/Directory: Select this button to edit the file/directory.
  • Delete File/Directory: Select this button to delete the file/directory.


How to add a new File or Directory for monitoring?

Select the 
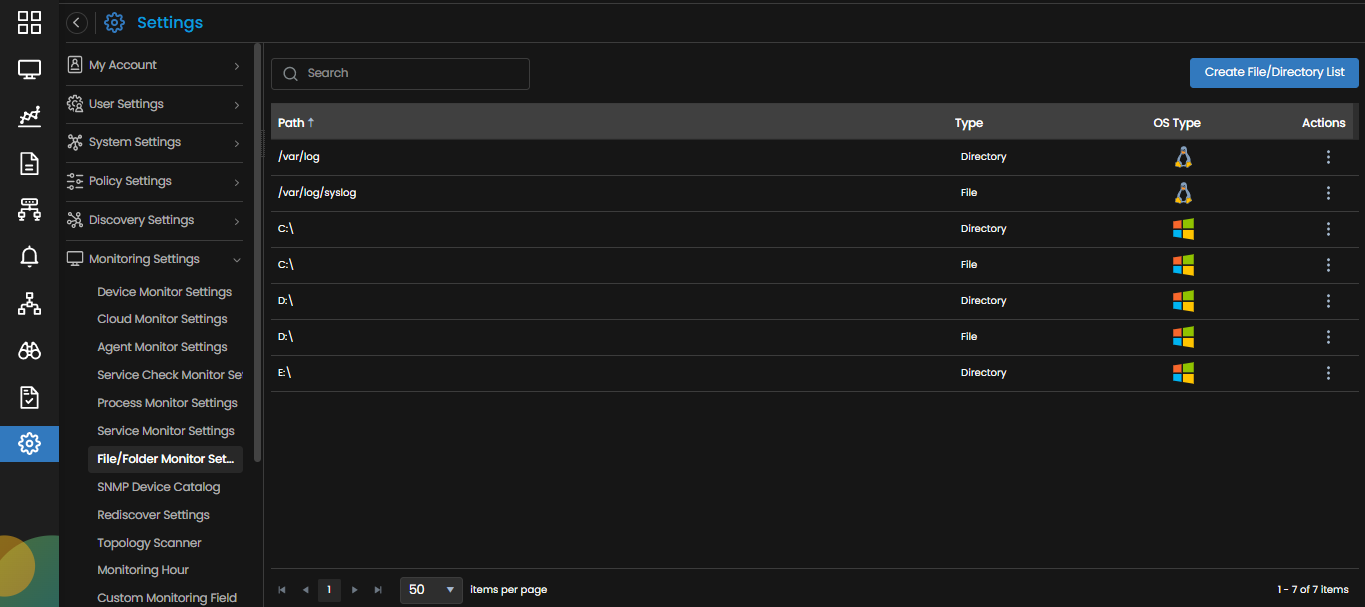
button. A new entry is created in the File/Directory list.

Enter the following details to add a File/Directory for monitoring:

  • Path: Enter the path of the directory or the file that you want to monitor.
  • Type: Select whether you want to monitor a File or a Directory.
  • OS Type: Select the operating system of the monitor to which the file or the directory belongs.

Select to add the path to the list for monitoring.

Select if you do not wish to add the path to the list for monitoring.

Service Monitor Settings

Overview

The Service Monitor Settings is a pre-loaded repository of all the generic services that might be present in a monitor (in this case, the monitor would be a server, whether virtual or non-virtual).

In order to monitor a service that may or may not be available in this list, you can use Rediscovery. The metrics related to that service are then available for monitoring.

This list of processes along with the list of services enables Motadata AIOps to discover the applications present in monitors at the time of rediscovery.

Go to Menu, Select Settings . After that, Go to Monitoring . Select Service Monitor Settings to display the list of all the processes that are pre-configured in the system.

Service List

The Service List displays the following fields:

Service The name of the service that can be monitored.
Application Type The type of application to which the service belongs.
OS Type The type of operating system to which the service belongs. This is further categorized into the following:

  • Windows
  • Linux
  • IBM AIX
  • HP-UX
  • Solaris
Actions Select to display permissible actions on the service. The following actions are available for each service:

  • Edit Service: Select this button to edit the name, application type, and OS type of the service.
  • Delete Service: Select this button to delete the service from the system.


How to add a new service for monitoring?

Motadata allows users to add a service to the existing service list in case a certain service that you need to monitor is not already present in the service list in the system.

Select 
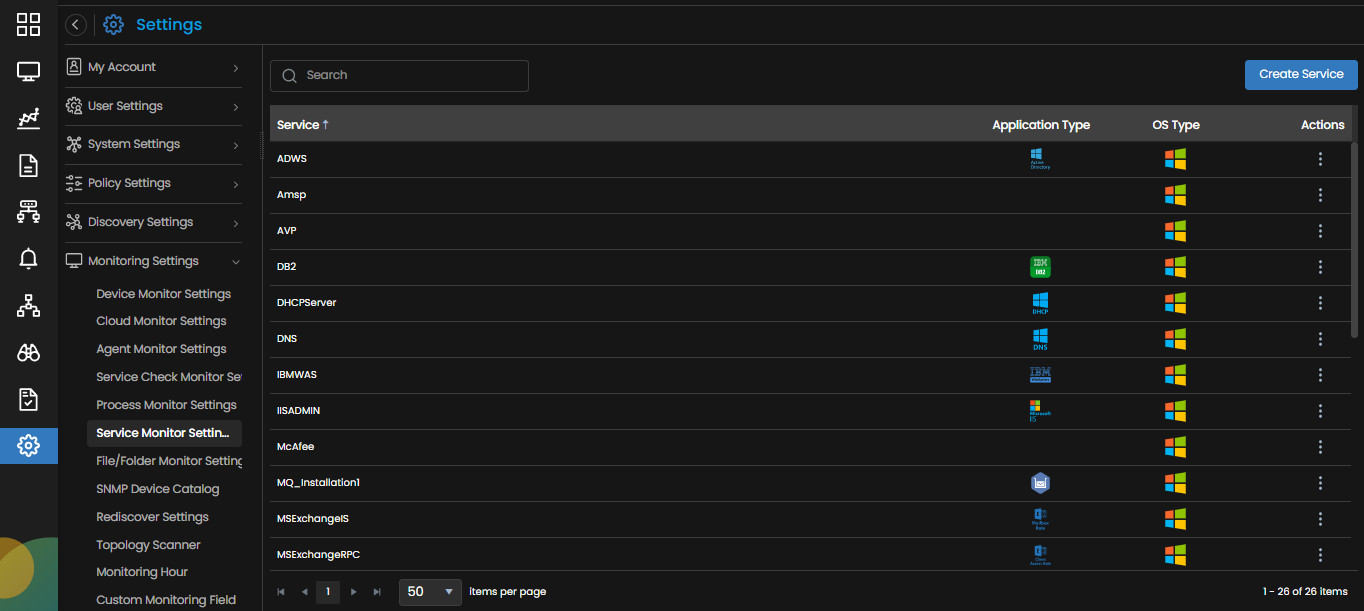
present above the list of services. A new entry is created in the service list.

Enter the following details to create a new service:

  • Service: Please enter the name of the new service you want to add to Motadata. This is the name of the service as present in the actual server which is set up as monitor.
  • Application Type: Select the application type to which this service belongs from the drop down.
  • OS Type: Select the OS to which this service belongs from the drop down.

Select to add this service to the service list.

Select if you do not wish to add this service to the service list.

Process Monitoring

Overview

The Process Monitoring Settings is a pre-loaded repository of all the generic processes present in a monitor(In this case the monitor will be a server, whether virtual or non-virtual).

In order to monitor a process that may or may not be available in this list, you can use Rediscovery. The metrics related to that process are then available for monitoring.

This list of processes along with the list of services enables Motadata AIOps to discover the applications present in monitors at the time of rediscovery.

Go to Menu, Select Settings . After that, Go to Monitoring . Select Process Monitor Settings to display the list of all the processes that are available in the system.

Process List

The Process List displays the following fields:

Process The name of the process that can be monitored.
Application Type The type of application to which the process belongs.
OS Type

The type of operating system to which the process belongs. This is further categorized into the following:

  • Windows
  • Linux
  • IBM AIX
  • HP-UX
  • Solaris
Actions

Select to display permissible actions for the process. The following actions are available for each process:

  • Edit Process: Select this button to edit the process name, application type, and OS type of the process.
  • Delete Process: Select this button to delete the process from the system.


How to add a new process for monitoring?

Motadata allows users to add a process to the existing process list in case a certain process that you need to monitor is not already present in the pre-loaded process list in the the system.

Select present above the list of processes. A new entry is created in the process list.

Enter the following details to create a new process:

  • Process: Please enter the name of the new process you want to add to Motadata. This is the name of the process as present in the actual server which is set up as monitor.
  • Application Type: Select the application type to which this process belongs from the drop down.
  • OS Type: Select the OS to which this process belongs from the drop down.

Select to add this process to the process list.

Select if you do not wish to add this process to the process list.