Linux

Overview

Get metrics from Linux server to monitor its performance.

Prerequisites

Linux

Metrics Description Type
system.network.in.bytes.rate Rate
system.overall.memory.free.bytes The amount of free space available in RAM on your host. Bytes
system.load.avg15.min The average system load over fifteen minutes. (available for Linux only) Percentage
system.cpu.type
system.swap.memory.free.bytes The amount of free swap space. Bytes
system.swap.memory.used.percent The percentage of used swap memory in your system. Percentage
system.vendor The name of the vendor for the monitoring device String
system.load.avg1.min The average system load over one minute. (available for Linux only) Percentage
system.network.udp.connections The total number of UDP connections. Count
system.load.avg5.min The average system load over five minutes. (available for Linux only) Percentage
system.blocked.processes The number of blocked processes in the system. Count
system.opened.file.descriptors The number of file descriptors used by a particular process. Count
system.cache.memory.bytes The amount of the RAM used as cache memory. Bytes
system.swap.memory.provisioned.bytes Bytes
system.disk.io.time.percent The percentage of time spent reading or writing to the disk Percentage
system.network.tcp.connections The total number of TCP connections. Count
system.virtual
system.cpu.cores The number of CPU cores on your host. Count
system.os.name The name of the operating system on your host. String
system.os.version The version of the operating system on your host. String
system.context.switches.per.sec The number of context switches per second. Rate
system.disk.capacity.bytes The capacity of the disk. Bytes
system.network.tcp.retransmissions The count of lost or damaged packets that were resent over the network. Count
system.buffer.memory.bytes The amount of the RAM used as buffer memory. Bytes
system.swap.memory.used.bytes The amount of used swap space in your system. Bytes
system.cpu.interrupt.percent The percentage of time the CPU has spent servicing hardware interrupts
system.memory.available.bytes The amount of free RAM. Bytes
system.interrupts.per.sec The number of CPU interrupts per second. Rate
system.overall.memory.used.bytes The amount of used space in RAM. Bytes
system.disk.io.ops.per.sec The number of read-write operations per second on the device. Rate
uptime
uptime.sec The time for which the system has been available. Seconds
system.swap.memory.free.percent The percentage of free swap space out of the total swap space. Percentage
system.disk.io.bytes.per.sec The amount of bytes transferred per second in I/O operations to and from the disk. Rate
system.network.bytes.rate The number of bytes sent/received for a device per second. Rate
system.disk.io.queue.length The queue length of IO requests issued to your device. Count
system.memory.installed.bytes
system.cpu.percent The percentage of a CPU being utilized at a particular instance. Percentage
system.disk.free.bytes The total amount of free disk space available on a system. Bytes
system.memory.used.bytes The total amount of used RAM on a system. Bytes
system.memory.free.bytes The total amount of free RAM space on a system. Bytes
system.overall.memory.used.percent The percentage of used RAM out of the total RAM. Percentage
system.model The model of the device. String
system.running.processes The total number of running processes in the system. Count
system.cpu.user.percent The percentage of time the CPU spent running user space processes. Percentage
system.memory.free.percent The percentage of free RAM out of total RAM. Percentage
system.disk.free.percent The percentage of free disk space out of the total disk space in the system. Percentage
system.processor.queue.length The number of threads that are delayed in the processor ready queue and are waiting to be executed. Count
system.cpu.io.percent The percentage of time the CPU spent waiting for IO operations to complete. Percentage
system.disk.used.percent The percentage of used disk space out of the total disk space on a system. Percentage
system.network.error.packets The total number of error packets in a network. Count
system.threads The total number of CPU threads. Count
system.name The name of the device. String
system.disk.used.bytes The total amount of used disk space on a system. Count
system.network.out.bytes.rate
system.memory.used.percent The percentage of used RAM out of total RAM. Percentage
system.overall.memory.free.percent
system.cpu.kernel.percent The percent of time the CPU spent running the kernel. Percentage
system.cpu.idle.percent The percentage of time the CPU has spent idle. Percentage

Linux CPU Core

system.cpu.core The number of CPU cores on the host. Count
system.cpu.core.idle.percent The percentage of time a particular CPU core has spent in idle state. Percentage
system.cpu.core.percent The percentage of a CPU core being utilized at a particular instance. Percentage
system.cpu.core.user.percent The percentage of time a given CPU core has spent in user mode Percentage
system.cpu.core.kernel.percent The percentage of time a given CPU core has spent in kernel mode Percentage
system.cpu.core.io.percent The percentage of time a given CPU core has spent waiting for I/O to complete Percentage
system.cpu.core.interrupt.percent The percentage of time a given CPU core has spent servicing the interrupts. Percentage

Linux Directory

system.directory.files The number of files in a directory Count
system.directory.owner The owner of the system directory String
system.directory.mode.owner The file access mode for a user who is an owner of particular directory. String
system.directory.mode.group The file access mode for a group that has access to a particular directory String
system.directory The name of the directory String
system.directory.creation.time The time at which the directory is created. String
system.directory.modified.duration.minutes The duration since the directory was last modified. Seconds
system.directory.size.bytes The size of the directory. Bytes
status String
system.directory.last.modified.time The time at which the directory was last modifed by a user String
system.directory.dirs Count
system.directory.mode.others The file access mode for all other users that are not owner of the directory. String

Linux Disk

system.disk The name of the particular disk. String
system.disk.write.ops.per.sec The writing operations performed on the disk per second. Rate
system.disk.time.percent The percentage of time spent doing I/O operations on the disk. Count
system.disk.bytes.per.sec The bytes transferred doing I/O operations to and from the disk per second. Rate
system.disk.ops.per.sec The I/O operations per second on the disk. Count
system.disk.read.ops.per.sec The reading operations per second to the disk. Count
system.disk.read.bytes.per.sec The bytes transferred per second reading from the disk. Count
system.disk.write.bytes.per.sec The bytes transferred per second writing to the disk. Count
system.disk.queue.length The queue length of IO requests issued to your device. Count

Linux file

system.file.size.bytes Total size of the file Byte
system.file.last.modified.time The time at which the file was last modified. String
system.file.modified.duration.minutes Duration since the file was last modified. Minutes
system.file.mode.owner The file access modes for the file if the permission group is ‘owner’. String
system.file The path and the file name of the file String
system.file.creation.time The time at which the file was created String
system.file.owner The user that created the file. String
system.file.mode.group The file access modes for the file if the permission group is ‘group’ String
system.file.mode.others The file access modes for the file if the permission group is ‘others’ String
status The status of the file whether it is available or not. The value is ‘Up’ if the file is available and ‘down’ if the file is not available. String

Linux Network Interface

system.network.interface Name of the interface. String
system.network.interface.in.bytes.rate Bytes transferred per second to the network interface. Rate
system.network.interface.out.bytes.rate Bytes transferred per second out of the network interface. Rate
system.network.interface.bytes.rate Bytes transferred per second in or out of the network itnerface. Rate

Linux Process

system.process.memory.used.percent The percentage of RAM allocated for use by a process. Count or percentage?
system.process.virtual.memory.bytes The total amount of virtual memory used by a process. Byte
system.process.handles The number of handles used by a process. Count
system.process.user The name of the user that started the process. String
system.process.cpu.percent The CPU utilization of a process. Percentage
system.process.uptime.sec The total time in seconds for which the process is running. Seconds
status The status of the process. The value is ‘Up’ if the process is available for monitoring and ‘down’ if the process is not available for monitoring. String
system.process.memory.used.bytes The total space used in a RAM by a process. Byte
system.process.uptime The total time for which the process is in runnning state. String
system.process.threads The number of threads used by this process. Count
system.process.command The command to identify the status of the process. String
system.process.io.bytes.per.sec The bytes transferred per second doing I/O operations to or from the disk for a process. Rate
system.process The name of the process. String
system.process.id The process Id. Count
system.process.destination.port The destination port to which the process communicates. String
system.process The name of the process. String
system.process.source.ip The source IP from which the process communicates. String
system.process.destination.ip The destination IP to which the process communicates. String
system.process.source.port The source port from which the process communicates. String

Windows

Overview

Get metrics from Microsoft Windows Server to monitor its performance.

Prerequisites

Windows

Metrics Description Type
system.network.output.queue.length the number of network packets in the output packet queue. Count
uptime.sec Count
system.network.out.packets.per.sec the number of packets being transferred out of the device per second. Count
system.disk.io.write.bytes.per.sec The bytes transferred per second writing to the disk. Rate
system.cpu.idle.percent The percentage of time a CPU has spent in the idle state. Percentage
system.disk.used.bytes The total amount of used disk space on a system. Bytes
system.memory.free.percent The percentage of free RAM out of total RAM. Percentage
system.serial.number The serial number of the device. String
system.logical.processors the number of logical processors on the device CPU. Count
system.virtual No’, if the system is not virtual. ‘Yes’, if the system is virtual. String
system.cache.memory.bytes The amount of the RAM used as cache memory. Bytes
system.disk.io.time.percent The percentage of time spent reading or writing to the disk. Percentage
system.os.name The name of the operating system on the device. String
system.disk.io.write.ops.per.sec The writing operations per second to the disk. Rate
system.network.bytes.per.sec The number of bytes per second sent or received for a device. Rate
system.memory.used.percent The percentage of used RAM out of the total RAM. Percentage
system.model The model of the device.
system.disk.io.bytes.per.sec The amount of bytes transferred per second in I/O operations to and from the disk. Rate
system.memory.available.bytes The amount of free RAM. Count
system.cpu.interrupt.percent The percentage of time the CPU has spent servicing hardware interrupts Percentage
system.network.out.bytes.per.sec The number of bytes per second being sent out of an interface. Rate
system.memory.used.bytes The total amount of used RAM on a system. Bytes
system.network.error.packets The total number of error packets in a network. Count
system.cpu.description The description of the CPU. String
system.os.service.pack The service pack of the operating system. String
system.interrupts.per.sec The number of CPU interrupts per second. Rate
system.memory.committed.bytes The amount of committed virtual memory on the RAM. Bytes
system.disk.free.percent The percentage of free disk space out of the total disk space in the system. Percentage
system.disk.used.percent The percentage of used disk space out of the total disk space on a system. Percentage
system.network.tcp.connections The total number of TCP connections. Count
system.context.switches.per.sec The number of context switches per second. Rate
system.disk.io.read.ops.per.sec The number of read operations per second from the disk. Rate
system.disk.capacity.bytes The capacity of the disk. Bytes
system.cpu.type The type of the CPU. String
system.vendor The vendor name of the device. String
system.name The name of the system. String
system.threads The number of threads used by this process. Count
system.processor.queue.length The number of threads that are delayed in the processor ready queue and are waiting to be executed. Count
system.disk.free.bytes The total amount of free disk space available on a system. Bytes
system.memory.installed.bytes Bytes
system.disk.io.ops.per.sec The number of read-write operations per second on the device. Rate
system.disk.io.idle.time.percent The percentage of time the CPU was idle while having pending disk I/O requests. Percentage
system.memory.free.bytes The total amount of free RAM space on a system. Bytes
system.pages.per.sec The number of pages per second written or read to the disk Rate
uptime
system.disk.io.read.bytes.per.sec The number of bytes transferred per second while reading from the disk. Rate
system.cpu.user.percent The percentage of time the CPU spent running user space processes. Percentage
system.cpu.percent The percentage of a CPU being utilized at a particular instance. Percentage
system.pages.faults.per.sec The number of page faults per second. Rate
system.network.tcp.retransmissions The count of lost or damaged packets that were resent over the network. Count
system.os.version The version of the operating system. Count
system.physical.processors The count of physical processors on the system. Count
system.running.processes The count of running processes on the system. Count
system.disk.io.queue.length The queue length of IO requests issued to your device. Count
system.cpu.cores The number of CPU cores on your host. Count
system.non.paged.memory.bytes The space allocated as non-paged memory on the RAM. Bytes
system.paged.memory.bytes The space allocated as paged memory on the RAM. Bytes
system.network.in.packets.per.sec the number of packets per second transferred into a device. Rate
system.network.in.bytes.per.sec Bytes per second transferred into a device. Rate

Windows Cluster

windows.cluster.online.resource.groups This monitor returns the number of online cluster resource groups on this node. Count
windows.cluster.offline.resource.groups This monitor returns the number of offline cluster resource groups on this node. Count
windows.cluster.rhs.restarts This monitor returns the number of resource host subsystem process (rhs.exe) restarts. Count
windows.cluster.rhs.processes This monitor returns the number of running resource host subsystem processes (rhs.exe). Count
windows.cluster.network The name of the network. String
windows.cluster.ip The IP address of a Windows cluster Count
windows.cluster.online.resources The count of online resources in a Windows cluster Count
windows.cluster.sent.messages.per.sec The cluster messages sent per second over the network. Rate
windows.cluster.online.groups The number of online cluster resource groups on this node. Count
windows.cluster.node.network The name of the node network. String
windows.cluster.networks String
windows.cluster.nodes The count of nodes in a Windows cluster. Count
windows.cluster.sent.messages The count of messages sent over the network in a Windows cluster. Count
windows.cluster.resource The count of resources in a Windows cluster. Count
windows.cluster.quorum.resource The name of the quorum resource in a Windows cluster String
windows.cluster.disk.used.bytes The space used out of the allocated space to the Windows cluster. Bytes
windows.cluster.offline.resources The count of offline resources in a Windows cluster Count
windows.cluster.node The name of the node on the windows cluster. String
windows.cluster.outstanding.messages The count of outstanding messages in cluster MRR. Count
windows.cluster.quorum.type String
windows.cluster.quorum.path The path where the quorum is located on the cluster String
windows.cluster.disk.capacity.bytes The space allocated to the windows cluster on the disk Bytes
windows.cluster.disk.free.bytes The free space out of the allocated windows cluster space on the disk. Bytes
windows.cluster.disk.used.percent The percentage of space used out of the allocated space to the Windows cluster Percentage
windows.cluster.network The name of the network. String
windows.cluster.unacknowledged.message.queue.length The count of messages that have been sent over the cluster but no acknowledgment has been received for the same. Count
windows.cluster.normal.messages.per.sec Count
windows.cluster.normal.message.queue.length Count
windows.cluster.network.received.bytes.per.sec The bytes transferred into a Windows cluster per second. Rate
windows.cluster.network.received.bytes The amount of bytes transferred into a Windows cluster network. Bytes
windows.cluster.network.sent.bytes The amount of bytes transferred out of the Windows cluster network. Bytes
windows.cluster.network.sent.messages.per.sec The count of messages sent out of the windows cluster network per second. Count
windows.cluster.network.reconnects The number of attemps made to reconnect to the cluster network. Count
windows.cluster.unacknowledged.messages.per.sec Count
windows.cluster.urgent.messages.per.sec Count

Windows Cluster Disk

windows.cluster.disk.volume.owner.node The owner node of the disk volume. String
windows.cluster.disk.volume.state String
windows.cluster.disk.volume.type The type of the disk volume.’Physical Disk’ if the disk volume is a physical disk. ‘Virtual Disk’ if the disk volume is a virtual disk. String
windows.cluster.disk.volume The name of the disk volume. String
windows.cluster.disk.volume.file.system The file system of the disk volume. String
windows.cluster.disk.volume.label The label of the disk volume. String
windows.cluster.disk.volume.used.percent The percentage of disk volume used. Percentage
windows.cluster.disk.volume.used.bytes The amount of used space in the disk volume. Bytes
windows.cluster.disk.volume.free.bytes The amount of free space in the disk volume. Bytes
windows.cluster.disk.volume.capacity.bytes The total capacity of the disk volume Bytes
windows.cluster.disk.volume.cluster.shared True’ if the disk volume is shared with other nodes. ‘False’ if the disk volume is not shared with other nodes. String

Windows CPU Core

system.cpu.core This metric is used to identify the core. String
system.cpu.core.user.percent The percentage of CPU core being utilised by the user. Percentage
system.cpu.core.percent The percentage of CPU core being utilised. Percentage
system.cpu.core.interrupt.percent The percentage of time the CPU core has spent servicing hardware interrupts. Percentage
system.cpu.core.idle.percent The percentage of time the CPU core has spent idle. Percentage

Windows Directory

system.directory The path of the directory. String
system.directory.last.access.time The time when the directory was last accessed. String
system.directory.last.modified.by The user that last modified the system directory. String
status Up’ if the directory is available for monitoring. ‘Down’ if the directory is not available for monitoring. String
system.directory.files The number of files present inside the directory. String or count?
system.directory.dirs String
system.directory.creation.time The time of the directory creation. String
system.directory.last.write.time The time when write operation was last performed on the directory. String
system.directory.size.bytes The size of the directory Bytes
system.directory.owner The owner of the directory. String

Windows Disk

system.disk The label of the disk volume.
system.disk.volume The label of the disk volume. String
system.disk.read.bytes.per.sec The bytes transferred reading from the disk per second. Rate
system.disk.write.bytes.per.sec The bytes transferred writing to the disk per second. Rate
system.disk.bytes.per.sec The bytes transferred doing I/O operations to and from the disk per second. Count
system.disk.write.ops.per.sec The writing operations performed on the disk per second. Count
system.disk.write.time.percent The percentage of time taken while writing to the disk. String
system.disk.queue.length The queue length of IO requests issued to your device. String
system.disk The label of the disk volume. String
system.disk.read.ops.per.sec The reading operations performed on the disk per second. Rate
system.disk.ops.per.sec The I/O operations per second on the disk. Rate
system.disk.read.time.percent The percentage of time taken while writing to the disk. String
system.disk.time.percent The percentage of time spent doing I/O operations on the disk. String
system.disk.volume The label of the disk volume. String
system.disk.volume.free.bytes The amount of free disk space. Bytes
system.disk.volume.used.bytes The amount of used disk space. Bytes
system.disk.volume.capacity.bytes The capacity of the disk. Bytes
system.disk.volume.used.percent The percentage of used disk space out of the total disk space on a system. Percent
system.disk.volume.free.percent The percentage of free disk space out of the total disk space on a system. Percent

Windows File

system.file The name and path of the file. String
system.file.creation.time The time at which the file was created String
system.file.last.access.time The time at which the file was last accessed. String
system.file.owner The user that created the file. String
system.file.last.write.time The time at which the last writing operation was performed on the file. String
system.file.last.modified.by The user that last modified the file. String
system.file.size.bytes Total size of the file Bytes
system.file.directory The name of the directory to which the file belongs. String
status The status of the file for monitoring. The value is ‘Up’ if the file is available and ‘down’ if the file is not available. String

Windows Service

system.service.display.name The display name of the service. String
system.service The system service.
system.service.description The description of the service. String
system.service.status The status of the service. String
system.service.startup.type Auto’ if the service starts running on system startup. ‘Manual’ if the service has to be manually started by the user. String
status The status of the service for monitoring. The value is ‘Up’ if the file is available and ‘down’ if the file is not available. String

Windows Process

system.process The name of the process String
system.process.handles The number of handles used by a process. String or Count?
system.process.memory.used.bytes The total space used in a RAM by a process. Bytes
system.process.io.bytes.per.sec The bytes transferred per second doing I/O operations to or from the disk for a process. Rate
system.process.uptime The total time for which the process is in runnning state. Count
system.process.io.ops.per.sec The count of I/O operations to or from the disk for a process. Count
system.process.threads The number of threads used by this process. Count
system.process.cpu.percent The CPU utilization of a process. Percentage
status The status of the process. The value is ‘Up’ if the process is available and ‘down’ if the process is not available. String
system.process.virtual.memory.bytes The total amount of virtual memory used by a process. Bytes
system.process.name The name of the process. String
system.process.id The process Id. Count
system.process.command The command to identify the status of the process. String

Windows Task Scheduler

windows.scheduler.task The name of the task. ?
windows.scheduler.running.tasks The count of the runnings tasks. Count
windows.scheduler.failed.tasks The count of the tasks in failed state Count
windows.scheduler.task.enabled True’ if the task is enabled. ‘False’ if the task is disabled. Count
windows.scheduler.task The name of the task. String
windows.scheduler.task.last.runtime The time at which the task started its last run. String
windows.scheduler.task.next.runtime The time at which the task will start its next run. String
windows.scheduler.task.state The state of the task. The possible values are : ‘Unknown’, ‘Disabled’, ‘Queued’, ‘Ready’, ‘Running’. String
windows.scheduler.task.status.code The status code of the task String
windows.scheduler.task.result.code The code of the end result of the task. Count
windows.scheduler.task.state.code “The state code of the task. The possible values and their meaning are: 0 State = ‘Unknown’, 1 State = ‘Disabled’, 2 State = ‘Queued’, 3 State = ‘Ready’, 4 State = ‘Running’ Count
windows.scheduler.task.missed.runs The count of the missed task runs. Count
windows.scheduler.task.result The description of the end result of the task String

Windows Network Interface

system.network.interface The name of the interface String
system.network.interface.in.bytes.per.sec Bytes transferred into an interface per second. Count
system.network.interface.output.queue.length the number of network packets in the output packet queue for an interface. Count
system.network.interface.in.packets.per.sec the number of packets transferred into an interface per second. Count
system.network.interface.out.packets.per.sec the number of packets transferred out of an interface per second. Count
system.network.interface.bytes.per.sec The number of bytes sent or received for an interface per second. Count

Log Search

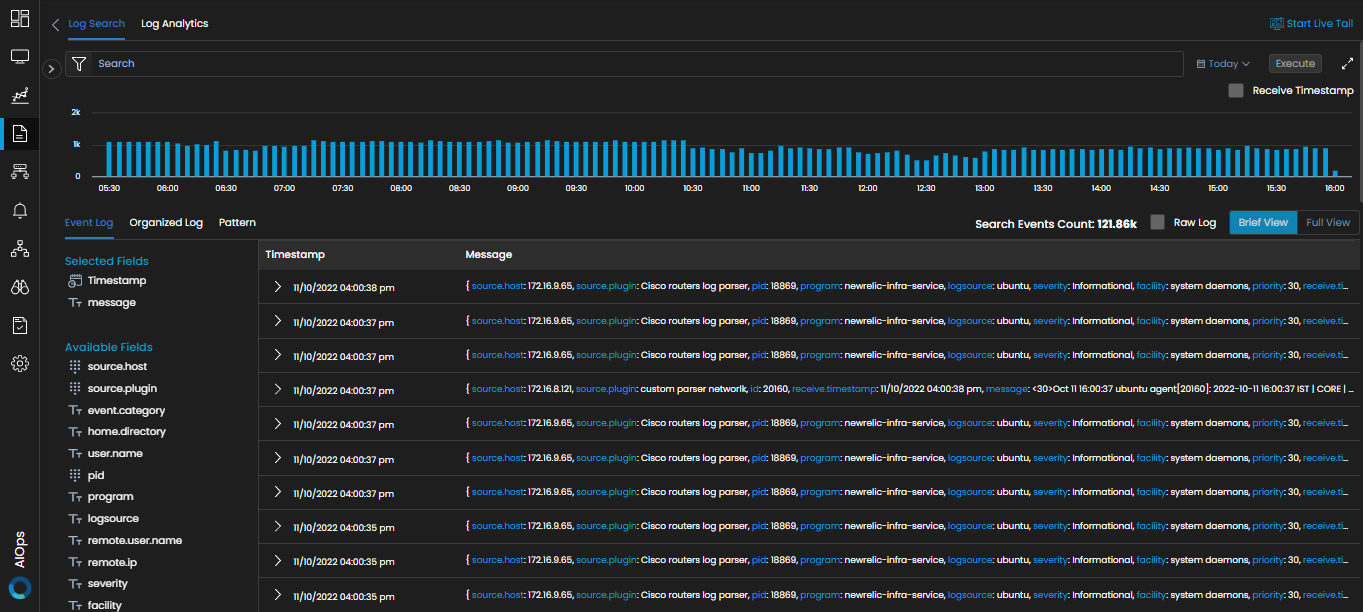
Go to Menu, Select Log Explorer . After that, select . The screen to search and view the log details is now displayed.

Overview

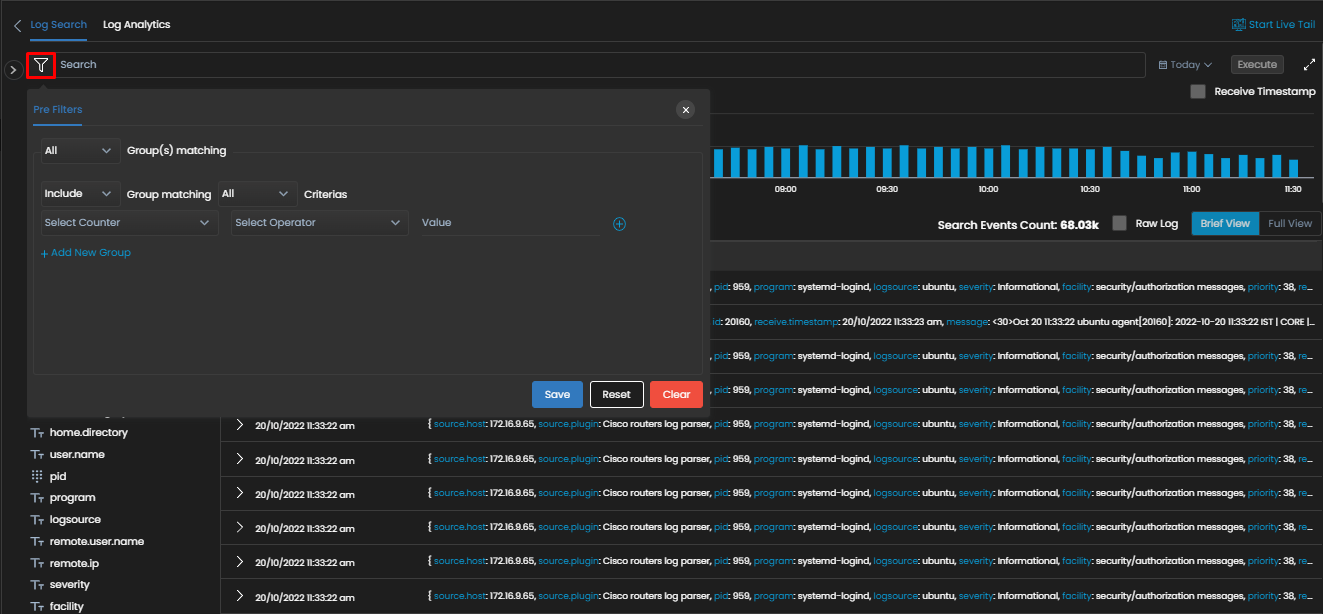
The log search feature enables you to narrow down to the exact log event that you wish to view and analyze. You can set a pre-filter condition to filter out the log data to the values you desire to view. Select to set the filter condition as per your requirement.

For example, you can set a filter condition to view all the logs from a particular source host for a specific time period by providing appropriate filter conditions. You can then view and analyze the log events you have searched.

  • Count of Log events

The bar graph at the top of the Log Search screen represents the count of log events received at various times during the day. You can move the cursor over each instance of time in the bar graph to get more details about the log event.

To understand other elements of the log search, navigate to the list of tabs present below the bar graph. Select Event Log to start with.

  • Event Log

This tab enables you to view the details of the live log events in your infrastructure.

The timestamp of the log events and the message associated with the event are displayed on this tab by default. You can add more fields from the list of available fields to view the details of that field for each log event. Suppose you want to view the log message along with the host generating these messages, you can simply add the source.host field from the list of Available Fields to the list of Selected Fields.

Go to the list of Available Fields. Hover the mouse cursor over the field that you want to add in the Event Log. Select present beside the field. This would move the field from the list of Available Fields to the list of Selected Fields.

Select the Raw Log checkbox to show the unparsed version of logs in the Message column as received in Motadata AIOps.

  • Organized Log

This tab shows all the parsed data from logs in an organized manner. For each log event, the details of all the available fields are shown in a tabular manner. This view helps us to skim through the log event data and gather the relevant information easily with just a single view.

  • Pattern ***** Content Not Uploaded*****

Other key elements available on the log search screen are as follows:

  • By default, the log events for the current day are shown on the screen. This means the log events generated on the current day are shown by default. For example, if the current date is 1st January and the time period is selected as Today, then the log events generated on 1st January are shown on the screen.
  • Select the Receive Timestamp checkbox to retrieve the log data based on the time it was received by Motadata AIOps instead of the time the log data was generated. For example, if the current date is 1st January and the time period is selected as Today, then the log events received by Motadata on 1st January are shown on the screen.
  • You can also view the historical log events by changing the time period as required. Click on the button at the top-right corner of the screen to do so.

Log Ingestion

In order to explore your logs in Motadata, you need to configure a logging source to send the logs to Motadata AIOps. This can be done in one of two ways:

  • Configuring log source through agent
    The configuration to receive logs from servers and applications can only be done through agent set up. The configuration for the same is done at the time of agent installation.
  • Direct ingestion of logs to Motadata
    The process to receive logs from network devices, wireless devices and virtual devices is done through direct ingestion from the source. The logs from these sources should be forwarded to the Motadata server on the port number ‘XYZ’. The logs are then available for you to explore and analyze in the log explorer.