We all have heard the term ‘observability’ in discussions related to business optimization and system performance, but exactly “what is observability?”
Observability is a crucial concept that many businesses are adopting in today’s time to track their internal processes and improve performance.
The concept came into practice a long time back and has gained significant traction in recent times, especially for distributed IT systems.
Today, there is a lot of competition in the market. Thus, to have a competitive edge over their peers, businesses must look into flaws and outdated systems and optimize them as per the latest technology trends.
Businesses with complex system architectures find it really hard to discover the root cause of a failure across different environments.
However, with observability, businesses can systematically track and measure the current state of their internal processes, identify flaws, and prevent failures across diverse environments.
Let us learn more about the observability concept, its importance, and its challenges.
Further, we will highlight the criteria that one must keep in mind when selecting a good observability tool.
What is Observability?
Observability is a concept that allows businesses to measure the current state of their systems depending on the metrics, traces, and logs collected.
It provides a clear picture of the internal processes of the systems and issues across diverse environments.
Further, it makes it easier to detect the root causes of a failure that is difficult to pinpoint in a complex network without the right tools.
Today, many businesses use cloud services to run daily operations which results in increased flexibility and efficiency.
But at the same time, it becomes difficult for organizations to discover the issues in real-time, especially in uniquely distributed and dynamic system architecture.
Hence, to effectively monitor and troubleshoot the applications, businesses must leverage observability.
It offers greater control over distributed and complex networks, making it easier to manage such systems.
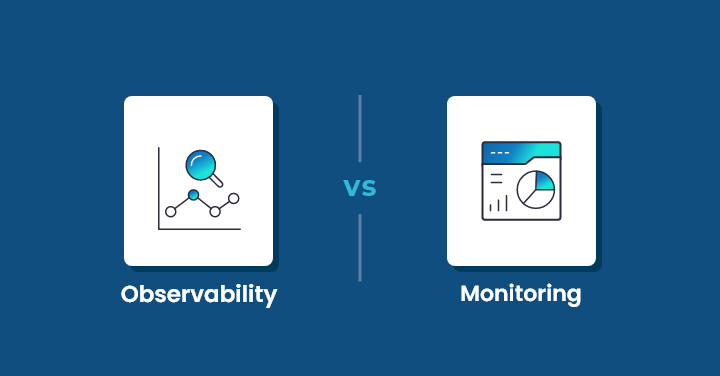
What is the Difference Between Monitoring and Observability?
Most people get confused and consider monitoring and observability similar.
But, it is not true as they both are different concepts. Observability is a wider concept with monitoring being a part of it.
In monitoring, you can access all the data via a dashboard where you receive notifications and alerts related to the system issues that can be viewed anytime later.
For example, if the response time of your application falls below the set threshold, you will receive an alert update about the issue.
This way you can monitor the issues and fix them before any user raises a complaint.
In simple terms, with monitoring, businesses can reduce their downtime and deliver better user experience.
However, this approach is not suitable in the case of dynamic and complex cloud-native environments.
Predicting what kind of issues may occur is a bit difficult to implement with a monitoring approach.
The observability platform, on the other hand, provides comprehensive data from the logs, metrics, and traces which help discover the root cause for a failure.
Remember, the higher the observability level means the faster you can find the root cause by receiving a notification about an issue.
You can track when and what went wrong in the network application by looking into the logs and metrics.
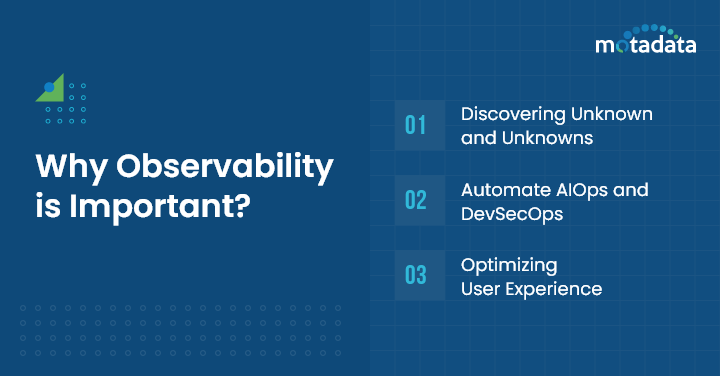
Why Observability is Important?
Observability offers better visibility and clarity into ongoing operations by collecting data from logs, metrics, and traces for examination.
Based on the data analysis, team members can quickly detect and identify issues and failures within a system.
This proactive monitoring helps reduce downtime and minimizes the impact on users.
It helps you find out the root cause of a broken connection, slow speed, network failure, or any other issue responsible for affecting your performance.
Teams may be proactive in resolving problems before they affect users by receiving alerts about them by adapting observability solutions.
The concept will further enable organizations to deliver quality results faster by:
1. Discovering Unknown and Unknowns
The monitoring approach is limited to tracking known and unknown issues which is not a big issue as the environment is less dynamic.
But with observability, you might be able to track issues that you might have never thought of and how they are affecting your performance on a large scale.
The modern cloud environment is complex and basic monitoring is not enough to fulfill your needs.
You will require a more sophisticated approach like observability monitoring that will help discover and address “unknown unknowns” issues and fix them before they reach out to users.
2. Automate AIOps and DevSecOps
For IT operations (AIOps) and DevSecOps lifecycle, observability solutions can be highly beneficial.
Many businesses are adapting cloud-native architecture and looking for ways to integrate AIOps—using artificial intelligence.
AI is enabling businesses to automate different tasks, such as application security and monitoring, constant delivery of services, faster incident response, measuring SLOs, and more.
If we combine observability solutions and AIOps, businesses will be able to predict issues faster based on the outcomes and remediate them in real time.
With less issues, businesses will be able to deliver better user experience and satisfy customer needs.
3. Optimizing User Experience
With network observability, businesses are able to understand what areas are causing issues in the network or can impact your business.
With clear visibility into each section, businesses can optimize their conversions, prioritize decisions, and make adjustments to meet their business goals.
Additionally, you can identify issues before your users do and create better user experiences.
Challenges of Implementing Observability
Observability can be beneficial for your business in different ways but remember it is a bit difficult to use.
In fact, it has always been difficult but changing technology and cloud complexities have made it an urgent issue.
It is no easier to track issues in data created by applications, especially in the case of containerized application environments.
It is extremely difficult to interpret and keep up with the flow of information.
There are a few more cases of observability challenges as described below.
1. Data Silos
Many businesses use agents and disparate monitoring tools to get insights into their web applications and operations.
But these practices at times create challenges in comprehending the interdependencies among various applications, cloud services, and digital channels.
2. Volume and Velocity
AWS, Azure, Kubernetes, and Google Cloud Platform are a few platforms and technologies that generate massive amounts of data at a rapid pace.
Also, the data generated comes in various forms which is quite challenging to track and analyze.
Additionally, there are a few cloud environments that use several technologies for smooth working.
With huge data, complexities, speed, and varieties, businesses find it challenging to track the issue and require advanced tools as it is not a simple task.
3. Manual Configuration
In some cases, IT resources are forced to spend more time on setting up observability rather than gaining insights from the observability data collected and taking action.
4. Time-consuming Troubleshooting
In an attempt to troubleshoot and find the source of issues, teams from applications, operations, and different sections are called in to speculate and attempt to make sense of telemetry and come up with solutions resulting in time wastage.
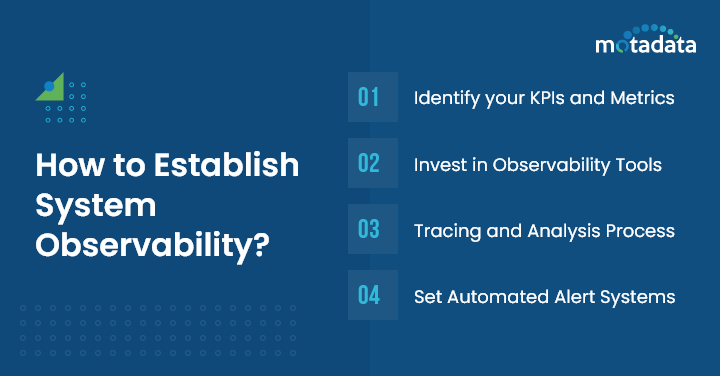
How to Establish System Observability?
Establishing system observability is essential to comprehend and maximize the functionality of your IT infrastructure.
In order to do so organizations use different open-source instrumentation tools or adopt an observability solution.
1. Identify your KPIs and Metrics
First and foremost make a checklist of your important KPIs and metrics, including resource usage, response time, error rates, etc. that provide better insights into the health and performance status.
By defining these indicators, you can better concentrate on components that are crucial for achieving business goals.
2. Invest in Observability Tools
Once you have the checklist in hand, you will require observability tools to collect data from several system components and run an analysis.
You can also implement instrumentation, i.e., add an agent for collecting data and metrics.
3. Tracing and Analysis Process
Once you have all the data in hand, the next step is to monitor and track the paths of transactions as they move through a system.
You can identify bottlenecks and errors by tracking the movement of each request and transaction.
4. Set Automated Alert Systems
With automated alert systems, businesses will get notifications in real-time updating about potential issues.
As a result, they’ll be able to respond and resolve issues faster.
In short, with observability, your IT team will gain valuable insights into the internal processes and system behavior that will eventually help improve overall performance.
What Are Three Pillars of Observability and Why Do They Fall Short?
The three key pillars of the observability concept are logs, metrics, and distributed traces that might help you achieve your business goals.
1. Logs
These are human-readable text records of events that took place in specific time durations.
An essential component of an observability solution is keeping an eye on exceptions and errors in logs.
The insights available in the logs cannot be easily tracked using APIs or databases.
2. Metrics
Metrics are numerical values with attributes that represent how well a particular system component is doing.
A range of sources, such as cloud platforms, infrastructure, and external sources, can provide metrics.
Using these measures, businesses can easily identify patterns and track changes in systems or services over time.
3. Traces
Traces demonstrate how each service connects and tracks every transaction as they move through applications.
They further provide clear visibility into the requests and responses across different services that help comprehend the system behavior.
Some businesses only rely on raw telemetry data to track issues as a few cloud services do not provide log data.
But raw telemetry data doesn’t provide a complete picture of system operations.
Similarly, merely having access to all three key pillars in hand won’t be enough to obtain true environment observability.
Hence, it is essential to invest in observability that provides both back and front-end perspectives of your applications and infrastructure.
For instance, you run an e-commerce store and want to manage its observability.
You can track the metrics, i.e., the server response time and usage, but it won’t reveal the root cause of the spike on the server response time during peak hours.
Similarly, in the case of logs, you can capture all the data and transactions, but sifting through logs can be time-consuming and challenging.
Tracing is best when you need to discover the cause of the delay in the payment process.
It is easier to detect the cause in the case of individual transactions, but on a large scale discovering the issue impacting numerous users might not be visible right away.
You can only truly claim to have fulfilled the purpose of observability once you are able to use telemetry data as well which will eventually improve end-user experience and achieve business goals.
What Are the Criteria for Selecting a Good Observability Tool?
To select the right observability tool, you must look out for several factors as mentioned below.
1. Supports Integration
It is essential to make sure that the chosen observability tool supports the existing stack or else all the observability efforts will go in vain.
Do check if they support the container and messaging platform as well as languages in your environment.
2. User-friendly
Make sure that the observability tool is easy to use or else you might find difficulty in incorporating them.
Also, a non-friendly tool will hinder the success of your observability initiative.
3. Visualize Aggregated Data
Another thing that you must not miss out on is to check if your observability tools present insights in simple formats.
4. Supports Machine Learning
Cross check if the tool uses machine learning models as it helps automate all the data processing and curation processes.
Machine learning models help discover and respond to anomalies and other security issues more quickly.
5. Provides Data in Real-time
To help teams comprehend a problem, its effects, and potential solutions, your observability tools should deliver pertinent insights in real-time through dashboards and reports.
6. Modern Event-handling Methods
Efficient tools for observability ought to gather applicable data from various operating environments, stacks, and technologies.
Also, it must be capable enough to distinguish important signals from background noise and provide a good context for appropriate decision-making.
How Motadata Empowers IT Teams With Observability?
If you run a business and have complex architecture or distributed IT systems, you must invest in observability solutions.
The latest technologies, microservices, and cloud services have made the systems more complex, and discovering every single issue with monitoring tools is not possible.
However, Observability goes beyond traditional monitoring and allows teams to discover what and when went wrong, i.e., helps you find the root cause for failure.
You can find several companies online that offer observability solutions at a good price.
Motadata is a popular platform that offers various tools and solutions for better business outcomes.
Network observability is one of its solutions that allows businesses to resolve network challenges in real-time.
It provides end-to-end visibility into the systems, log data, and network performance.
With access to detailed insights, businesses can even identify anomalies before the user faces the negative impact.
The tool further allows you to capture all critical metrics, logs, traffic usage, etc., and troubleshoot issues quickly.
With this approach, you can get a better understanding of your entire system and detect anomalies faster.
It even uses machine learning models for your hybrid infrastructure that help track all the delayed response time in traffic, communication between services, and anomalies.
Additionally, with the Motadata Network Observability Solution, you can keep good track of application usage patterns using this robust solution.
Another benefit of investing in a Motadata Network observability solution is you can auto-discover the new components and set custom alerts for loss of availability.
Be it on-premises, private, or public cloud, the observability tool will help monitor every single section of your IT infrastructure with its cutting-edge technologies.
You can download it for a 30-day free trial with a click.
Remember the concept of observability stands on the three key pillars – logs, metrics, and distributed traces that can help you achieve business goals and eventually improve end-user experience.
It does come with various challenges but can still help improve your team productivity, lower downtime, deliver better customer experience, and encourage innovation across all teams.
FAQs:
Observability refers to the ability to monitor and understand the internal states of a system based on external outputs like logs, metrics, and traces.
While monitoring checks for known issues, observability helps in understanding complex, unexpected behaviors by providing deeper system insights.
Logs, metrics, and traces are the three pillars enabling comprehensive visibility into system performance.
It helps quickly detect, troubleshoot, and resolve issues, ensuring smooth operations in dynamic, cloud-native environments.
It enables faster incident resolution and proactive performance improvements through real-time data insights.