Network Monitoring Dashboard: Features, Criteria, and Tips
Today, more than 95% of professionals use networks for communications, file transfer, and other business operations.
The more a business is dependent on the latest technologies and practices, the more complex their network will be.
So, no matter whether you run a small company or a large organization, with modern networking, chances are high that administrators might face network issues with the management of complex networks.
However, by incorporating a network monitoring dashboard, administrators and engineers can gain clear visibility into the different network components and metrics in real time.
Network performance monitoring dashboards are centralized platforms designed to provide a unified view of the network metrics and components for quick monitoring and tracking health status and security breaches.
It combines all the metrics, data, and visualizations in a single place for evaluation and response time to network events.
Additionally, the platform comes with the ability to forecast trends and identify problems at an early stage.
The real-time insights provided by the platform make it easier for IT teams to identify and resolve potential bottlenecks and anomalies.
Further, it helps troubleshoot issues faster and reduce downtime resulting in the delivery of optimal performance and business continuity.
Another benefit that comes with the network monitoring dashboard design is it reduces costs related to downtime and emergency fixes.
By detecting the potential issue and troubleshooting at an initial stage, businesses have to no longer spend extra costs on repairing and recovering the damages.
Let us dig deeper into the tool and check the network monitoring dashboard features, examples, and criteria to look for when selecting a network monitoring dashboard.
Features and Capabilities of a Network Monitoring Dashboard
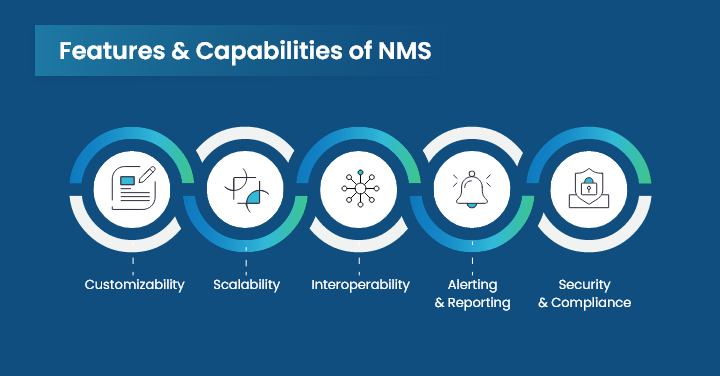
Here are some of the essential features and capabilities of a Network Monitoring Dashboard that make it a great choice for many businesses and engineers.
1. Customizability
The network monitoring dashboard customizability feature allows users to personalize their dashboard and monitor particular network components by adding their own custom elements.
Further, a user can resize, rearrange, or remove the elements as per their need and choice.
The customizability feature enables users to focus more on metrics essential to them and facilitates effective capacity planning.
For example, the intuitive drag-and-drop feature makes it easier to arrange charts and other data visuals as per their preference.
2. Scalability
A scalable network monitoring dashboard enables users to monitor their complex networks across multiple data centers, regardless of their locations.
It allows network mapping over the entire environment and easy management of large networks.
From netflow traffic analyzer to server monitoring dashboard, all the functionalities are available in a network monitoring dashboard that helps enhance its scalability.
This further helps the dashboard support network expansion without any issues.
For example, you run a multinational corporation with different branches in different geographical locations.
Now, some day an employee reports an issue of slow internet connectivity from a remote site updating about the impact on productivity.
By having a scalable network monitoring dashboard, your team can monitor hundreds of devices and diverse protocols without having any issues.
3. Interoperability
The interoperability of the dashboard is improved by its smooth interaction with the existing network monitoring technologies.
This interoperability feature makes it easier to keep track of all web applications and network traffic in real-time.
For example, the integration with different protocols, including SNMP (Simple Network Management Protocol), syslog, and others provides a network monitoring dashboard unified view and metrics for measuring network performance.
4. Alerting and Reporting
The real-time alert feature helps notify users about network performance issues and ensure quick response to breaches and other concerns.
With a proactive and customizable alert option, organizations can set predefined threshold limits and get quick updates on identifying issues.
Further, insightful reports preserve a historical log of key performance indicators, which facilitates efficient root cause analysis and is useful for long-term optimization.
5. Security and Compliance
When creating a network monitoring dashboard, security and privacy should be given high priority.
Cybercrime is increasing day-by-day which is why it has become essential to invest in a tool that comes with advanced security features and measures.
Network monitoring dashboards that support security measures like encryption, access controls, and tools for monitoring compliance can always protect the privacy of their data and networks.
Criteria for Choosing a Network Monitoring Dashboard
Choosing the right tools and technologies that complement your architecture and monitoring goals is essential to creating a successful network monitoring dashboard.
Examining the =features, capabilities, and compatibility of various tools is crucial because there are a lot of options accessible.
Here are a few factors and considerations that the user should take into account when choosing a network monitoring dashboard, such as:
1. Network Size and Complexity
Effective bandwidth utilization and monitoring requires customizing the dashboard to the size and complexity of the particular network.
By selecting a scalable dashboard, you can avoid the headache of having to migrate to a new system as your network expands and ensure that your network monitoring capabilities are future-proofed.
So, make sure to choose a dashboard that is capable of handling hundreds of devices, tracking traffic patterns, and the performance of complex networks.
Make sure that it is compatible with the tools, metrics, and protocols required for efficient monitoring.
Further, it is essential to ensure that the dashboard tailors with the network infrastructure’s capacity planning needs and requirements.
The availability and performance of the network are directly improved by selecting a dashboard that corresponds with the size and complexity of the network.
This customized strategy has a major effect on your network’s overall performance.
2. Network Goals and Objectives
Another key factor to look for in the network monitoring dashboard is that it aligns with the performance metrics, objectives, and goals.
Optimizing the dashboard to align with the objectives of the network guarantees efficient infrastructure and network functioning.
So, in order to deliver the best application performance, make sure that the chosen one is capable enough to fulfill your objectives.
It will further enhance your network security, bandwidth monitoring, and real-time device information.
Additionally, choosing a suitable option will enhance network management by identifying any issues and resolving them before they become disruptive.
3. Budget and Resources
A crucial factor to take into account when selecting a network monitoring dashboard is the cost.
No doubt, network monitoring software aids in efficient resource allocation and budget planning.
However it is possible to optimize resource use by comprehending network traffic patterns.
Effective network monitoring solution also assists in efficient budget management through their insights.
Analysis of historical data helps decision-makers make well-informed choices about resource investments.
Real-time performance indicators help with resource allocation optimization by making it easier to identify potential network problems.
So, analyze the dashboard’s cost-effectiveness taking into account both the original outlay and ongoing upkeep.
Look for a solution that meets your financial limits and offers a respectable return on investment.
4. User Experience and Satisfaction
By proactively fixing issues and boosting satisfaction, proactive network performance management guarantees the best possible user experience.
Enhancing customer happiness requires figuring out the underlying reasons for performance problems.
Reliable access is ensured by efficient network monitoring technologies, which provide a consistent user experience across applications.
These objectives can be met with the help of the network performance monitor, which optimizes performance of applications and offers real-time data.
To track if a tool offers better user experience, go through the case studies, reviews, and user testimonials to get more clarity.
Other users’ positive comments show that the dashboard has a history of living up to customer expectations.
Conclusion
With the growing businesses and large-scale networks, it has become essential to invest in a tool like Motadata that provides real-time visibility into the different components, control, and safeguards the functionality and health of your network.
It provides innovative dashboards with a range of measured indicators that are distinct from the norm.
It also displays the metrics from all of the network architecture’s monitored devices, services, and metrics.
The network monitoring dashboard is the best choice for businesses of any size as it comes with various features and customization options.
By building an efficient network monitoring dashboard, you can track the performance, availability, and security of your network infrastructure.
It is an ongoing process that calls for thorough planning, consideration of industry best practices, and a dedication to constant development.
With its help, you can gain a holistic view of all components, and discover and troubleshoot bottlenecks promptly.
Further, professionals can make well-informed decisions that result in better network performance, less downtime, and overall increased reliability by carefully considering the above-listed criteria.
Take full control of your network performance. Gain real-time visibility, detect bottlenecks instantly, and keep your infrastructure running at peak efficiency with Motadata’s intelligent monitoring dashboards. Try Motadata Network Monitoring Now!
FAQs
How often should I update or refresh my network monitoring dashboard?
It is best to update on a regular basis but the frequency must also depend on the requirements of your company. For example, there are a few firms that demand daily or weekly updates, so set automated settings that will automatically refresh or update your events on a timely basis. You can even set alerts for your important events that need to be attended to right away. Identifying network problems and enhancing overall performance can all be accomplished by routinely checking and updating your dashboard.
How can I share or export my network monitoring dashboard with others?
You can find several solutions in the market that come with functionalities that allow users to export or share network monitoring dashboard performance or network visualizations quickly without any hassle. Sharing options include embed codes, links, emails, and export templates. For particular people or groups, certain tools even enable customization. You can even go through the documentation or directly get in touch with the customer service team for instructions on exporting or sharing the dashboard.
How can I troubleshoot or fix any issues or errors with my network monitoring dashboard?
The alert option set in the system will provide notifications updating about the errors and issues in the network components. You can go through these options to identify and troubleshoot issues or check your data sources and ensure they are working fine. If you’re still having trouble, contact technical support or look it up in the documentation. To take advantage of the most recent enhancements and bug fixes, keep the dashboard and all of its components updated.
Author
Motadata Team
Content Team
Articles produced collaboratively by our engineering and editorial teams bear the collective authorship of Motadata Team.


