Imagine one night you receive a notification from your team member that a critical production problem has caused chaos in your application.
There is a sudden drop in sales as customers are unable to access the application and reporting issues relating to the same.
Now, when you reach the office to fix the issue, you demand the team to run through all the files.
But, when the team members try to go through all the log files, they find that you have access to only a few event records as all the files are scattered, metrics are confusing as well as traces are difficult to track down. Hence, you face the struggle to find the actual cause of the production issue.
Now, what if you had invested in the concept of observability?
Observability is not just a simple term, but a whole concept that consolidates all your logs, metrics, and distributed tracing systems into one place for quick analysis and troubleshooting.
This practice allows DevOps teams to discover the root cause of failure, measure the internal processes’ health status, identify flaws, and take corrective actions.
By examining the logs and data, you may determine what went wrong with the application and when, having an effective observability system in place allows DevOps teams to solve issues more quickly, maximize performance, and provide better user experiences.
In fact, observability solutions can be very helpful for the DevSecOps lifecycle and IT operations (AIOps).
Let us learn more about the concept of observability, its three pillars, and best practices for each pillar.
The Observability Pillars
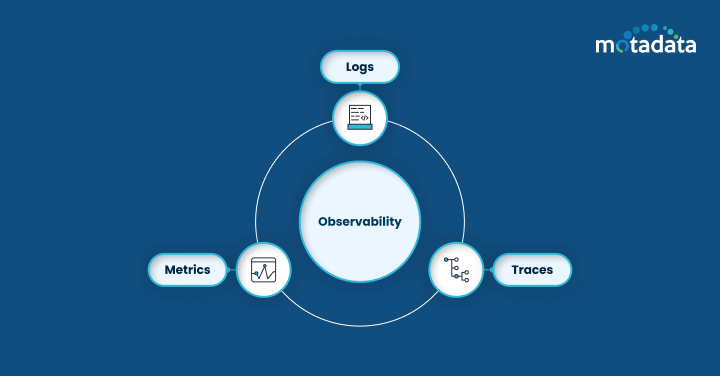
The observability concept works on three pillars, i.e., logs, metrics, and distributed traces, using which any organization can better maintain its performance and achieve its goals.
Logs
These are event records stored by organizations in plain text for future reference and analysis.
These include information about every event that occurred in a specific period.
With a centralized log management system, businesses can view all the events and errors collected from different sources in one place and timely analyze as well as troubleshoot issues.
Further, the log formatting standards like JSON, make it simpler for system administrators and coders to analyze all the log data programmatically.
By employing these right tools, businesses can track all the issues and anomalies in real time.
Metrics
Metrics are attributes-based numerical values that show how well a specific system component is performing.
For example, application metrics include error rates, throughput, and response time.
With the help of these metric insights, businesses can track how well a software application is performing and serving its purpose.
Similarly, the infrastructure metrics include memory usage, CPU usage, network latency, and more responsibility for monitoring the health and performance of each hardware and software component.
Business metrics are another example used by organizations to monitor key objectives and outcomes of a business.
It is easier to prioritize monitoring efforts when you know which key metrics are most important for the system’s stability and success.
Also, you can even set alerts based on predefined thresholds or patterns in metrics that help proactively identify and resolve problems before they escalate.
Traces
With distributed tracing, IT professionals can easily visualize how each service is connected with one another and how the flow of requests moves through the entire application.
With the help of these insights, users gain clear visibility and a better understanding of pathways, requests, transactions, and responses, which help in better application performance management.
By tracing each and every component, the user can quickly identify the bottlenecks and latency issues in real-time time, further helps in performance optimization and improving user experience.
Best Practices for Each Pillar
Here are a few DevOps best practices that must be followed for each pillar –
Logs:
1. Choosing the right log management tool – There are several open-source and commercial log management tools available in the market that one can choose from for logging monitoring.
Depending on your budget and scalability requirements, try to invest in a tool that meets your needs. Open-source log management solutions and flexible and can be easily customized but demand more maintenance.
On the other hand, commercial log management tools come with a wide range of features and support services but are a bit pricey in comparison to other tools.
2. Log Rotation Policy Enforcement – By setting up log rotation policies, organizations can better manage the disk spaces and avoid issues.
With regular rotation and log archiving, businesses can prevent log files from taking up too much of disk space and maintain better system performance.
3. Leverage log analysis tools – Investing in some of the best log analysis tools will provide better visibility into big data, help identify trends and anomalies in real-time as well as troubleshoot issues faster.
These tools include pattern recognition and anomaly detection features that save time and allow businesses to take preemptive actions before the problem escalates.
Metrics:
1. Define ownership and documentation – Assign DevOps teams or individual responsibility for each metric with complete ownership and documentation. With this practice, you can ensure better clarity and consistency across the organization.
2. Standardize metric collection – Set standardized practices that address the purpose of metrics, naming format, and classification which will help team members gain more clarity into the processes.
Further, standardizing metric collection makes it easier for DevOps to compare different metrics, analyze, and troubleshoot issues.
3. Dashboards and Visualizations – Using the dashboards and data visualization, DevOps can easily monitor the different metrics, their trends, issues, and abnormalities in real time.
Thus, allowing them to take the right action at an early stage and prevent the issue from escalating any further.
Traces:
1. Select a distributed tracing solution – Choose from a wide range of distributed tracing solutions but make sure to invest in the one that integrates well with your existing tools.
Compare the different sets of tools depending on their ease of integration, scalability as well as compatibility criteria for smooth operations.
2. Identify critical service calls – It is essential to identify the important service calls and transactions that play a key role in system performance.
By tracing these functionalities, businesses can use resources as efficiently as possible and optimize performance as well as user experience.
3. Utilize trace data for analysis – Transaction and Service call tracing helps in incident management.
IT Teams gain clear visibility into the flow of requests that help identify the root cause of potential issues and bottlenecks in the systems.
Further, with the help of these insights, businesses can work on failure points and prevent losses.
Putting it all Together
The three pillars of Observability, i.e., logs, metrics, and traces have their own roles and functionalities.
Each of these pillars when used together can help provide a comprehensive picture of your system’s health and enable teams to strategize an action plan accordingly.
With logs, users can keep an account of events that happened at a specific period which can be used for troubleshooting.
With metrics, users can analyze the trends and patterns as well as measure resource utilization across the entire system.
Lastly, the trace data provides a clear path of how the transactions and requests move through the system.
Together, they help teams uncover problems, comprehend system behavior, and make better decisions that raise dependability and performance.
An observability pipeline is a stream processing engine that ensures all data is gathered efficiently, processed, and transformed into insightful data which is later presented to the stakeholders in a visual manner for quick analysis and decision-making.
Observability pipelines enable cost-effective management of observability data for enterprises, as well as regulatory compliance.
It provides a centralized platform for addressing issues and responding to them.
Without a robust observability pipeline, teams may find it difficult to efficiently monitor and manage complex systems.
There are several observability tools in the market you can choose from, but we recommend Motadata.
Motadata is a unified platform that collects data from multiple sources, consolidates in one place, eliminates silos, and provides a holistic view of the entire system or application.
Utilizing Motadata’s capabilities, enterprises may guarantee the dependability of their systems and applications, improve performance as well as increase operational efficiency.
Here’s why Motadata is worth mentioning:
Motadata is a unified platform best known for the AI-driven observability approach and comprehensive solutions.
Using this robust observability platform, organizations capture all critical metrics.
monitor log files, and trace all transactions in real-time. Businesses that have access to these comprehensive insights are even able to spot anomalies before they negatively affect users.
Here are a few more reasons that make Motadata stand out, including:
1. Unified Platform
It is an all-inclusive solution that allows organizations to manage their logs, metrics, and traces all from a single platform.
Thus, it eliminates the need to invest in different tools and solutions and simplifies monitoring configuration.
2. Streamlined Workflows
You may automate a number of tasks with Motadata, including gathering, analyzing, and alert creation.
As a result, DevOps engineers may focus on more strategic tasks rather than spending their efforts on time-consuming monitoring jobs.
Basically, with this automation, you can save significant time and effort.
3. Actionable Insights
You can efficiently correlate data from many sources with the help of Motadata.
Through the integration and analysis of logs, analytics, and traces, you may more effectively determine the root cause of problems.
Thus, giving you the ability to decide and act appropriately to solve issues quickly.
Benefits of Effective Observability
With observability, the Ops team can gain quick insights into the internal state of a system and ensure smooth operations.
Here are a few additional benefits of effective observability:
1. Faster incident resolution
Software bugs or performance bottlenecks are bound to happen in a system but with an effective observability strategy, you can address issues at a much earlier stage.
Further, the solution helps team members gain detailed visibility into the system and identify the root cause of the problem.
These insights help reduce mean time to resolution (MTTR) as well as downtime, leading to a better customer experience.
2. Proactive problem identification
With observability, team members can monitor and identify problems in system performance in real-time.
Thus, they can prevent the issue from escalating and causing any negative impact on users.
Early problem identification helps the team take proactive measures in real time.
3. Improved application performance
Teams can learn how their applications are functioning by utilizing observability data.
This allows team members to find problem areas and maximize resource usage, resulting in smooth operations and a more seamless user experience.
4. Enhanced development velocity
Through observability data, Development teams can learn a lot about how their code performs during the production period.
Based on these insights, teams may pinpoint areas of development and make well-informed decisions. As a result, development methods become more effective, and iteration cycles accelerate.
5. Greater confidence in deployments
Rolling out upgrades or new code in a production environment can be unsettling since unanticipated problems could cause service interruptions.
However, teams that have implemented good observability are well aware of how their systems operate in various scenarios.
The early identification and resolution of any faults lessens the tension associated with deployment and boosts confidence when making system modifications.
FAQs
Monitoring is essential to observability in a DevOps system. Monitoring facilitates the collection of all real-time data, which is then examined and analyzed to improve company processes. Thus, you can fix the issue with your service or interface before it impacts users.
Automation is essential to observability because it streamlines data collection, processing, and alerting procedures. By automating observability in their DevOps processes, team members can identify threats and issues at an early stage, proactively resolve issues, and enable faster response time.
By providing details on the behavior and performance issues of the system, observability—which includes logging and monitoring—can enhance security. Logs, analytics, and other data can be monitored by teams to spot anomalies or suspicious activity that may indicate a security concern.