Editor’s Note
This blog explores how modern observability platforms are transforming IT operations beyond traditional monitoring. As enterprises seek better visibility, faster resolution, and improved performance, several next-generation tools are emerging as strong alternatives to SolarWinds. Here’s an in-depth look at the top platforms shaping the future of unified observability.
Introduction
Every IT leader understands the ripple effect of a single disruption. A server slows down, dashboards light up, and tickets start piling up faster than teams can respond.
Gartner estimates the average cost of IT downtime at over $5,600 per minute, and studies reveal that 65% of incidents are still detected by end users before the IT team is aware.
This reactive cycle reveals a deeper challenge. Today’s IT infrastructures are complex, hybrid, and dynamic. Systems run across clouds, data centers, and edge networks, each generating massive amounts of telemetry data. Traditional monitoring tools like SolarWinds, built for simpler architectures, can no longer keep pace.
In 2025 and beyond, visibility alone is not enough. Organizations need observability, the ability to understand the health, behavior, and performance of systems in real time through continuous data correlation and insight. Observability enables teams not just to detect incidents but to predict, contextualize, and resolve them before they disrupt users.
That’s where modern SolarWinds alternatives come in. These new-age observability platforms combine analytics, visualization, and intelligence to provide full-stack visibility and operational clarity across networks, applications, and infrastructure.
Challenges with Traditional Monitoring Tools
Legacy monitoring solutions like SolarWinds once defined how IT teams tracked system performance. They were reliable for static infrastructures but struggle in today’s distributed, cloud-native environments.
Here are the major challenges that push enterprises toward unified observability platforms.
1. Fragmented Monitoring Ecosystems
Traditional monitoring tools often operate as isolated modules, network, server, and application monitoring exist in separate silos. Each requires its own license, setup, and maintenance, creating complexity and data fragmentation.
When incidents occur, engineers must jump between dashboards to correlate metrics manually, delaying response times and increasing operational costs.
Modern observability platforms consolidate metrics, logs, traces, and events into a single pane of glass. This unified visibility drastically improves mean time to detect (MTTD) and mean time to resolve (MTTR) while reducing overhead.
2. Reactive Operations Instead of Proactive Insight
Legacy systems detect symptoms, high CPU usage or packet loss, but rarely explain why they occurred or what could fail next. Without cross-correlation or anomaly detection, teams remain reactive, often discovering issues after users are affected.
Observability tools bring proactive intelligence. By analyzing telemetry data in context, they identify root causes and detect patterns that signal future risks, allowing teams to address potential failures before they escalate.
3. Alert Fatigue and Manual Escalations
Static thresholds in traditional tools trigger repetitive or low-priority alerts, overwhelming teams and diluting focus. Modern observability solutions employ intelligent correlation and event grouping, reducing redundant alerts and allowing engineers to concentrate on high-impact incidents.
4. Limited Automation
Older monitoring tools often stop at detection. They can identify an issue but lack automated remediation capabilities. Every response requires manual triage, extending downtime and adding administrative burden.
In contrast, next-generation observability platforms integrate contextual automation—enabling predefined responses or guided troubleshooting through workflows and runbooks.
5. Cloud and Container Blind Spots
Traditional systems were built for static infrastructures. In today’s world of containers, Kubernetes clusters, and multi-cloud environments, they struggle to maintain visibility. Ephemeral workloads appear and disappear quickly, leaving monitoring gaps.
Modern observability platforms solve this with auto-discovery and real-time topology mapping, ensuring complete coverage across cloud, hybrid, and on-premises environments.
In essence, legacy monitoring tools tell you what happened, but not why, and certainly not how to prevent it. Observability provides the missing context, enabling teams to move from reactive monitoring to proactive system intelligence.
The Shift Toward Unified Observability
To address these challenges, organizations are embracing Unified Observability, a holistic approach that integrates telemetry from across the entire IT ecosystem into a single intelligent framework.
- Observability offers deep, real-time visibility into systems by correlating metrics, logs, traces, and events. It helps teams identify dependencies, performance bottlenecks, and potential risks across layers.
- Automation and analytics enhance this by detecting anomalies and surfacing actionable insights.
- Together, they create a continuous feedback loop where data drives decisions, and decisions drive stability and optimization.
Unified Observability eliminates silos between tools and teams. Instead of multiple systems reacting independently, enterprises gain one intelligent platform that observes, analyzes, and acts seamlessly, reducing downtime and improving performance across hybrid infrastructures.
What Defines a Modern SolarWinds Alternative?
Modern IT environments demand observability platforms that do far more than generate dashboards. The best SolarWinds alternatives share these key capabilities:
- Unified Visibility: Bring all, metrics, logs, and traces—into one view for full-stack monitoring.
- Intelligent Analytics: Correlate events automatically to uncover root causes faster.
- Scalability: Support complex hybrid and multi-cloud environments with elastic data ingestion.
- Actionable Insights: Move beyond raw data to deliver contextual analysis and guided resolutions.
- Custom Visualization: Provide clear, intuitive dashboards for different user roles.
These capabilities empower IT teams to not just watch systems but to understand their behavior and continuously improve performance. The best SolarWinds alternatives transform data noise into actionable intelligence.
Top 7 SolarWinds Alternatives for Unified Observability
Choosing the right SolarWinds alternative is not about replacing one tool with another, it’s about evolving to a smarter, more connected ecosystem.
Today’s observability platforms unify visibility across networks, applications, databases, and cloud environments while offering flexibility, scalability, and automation.
Whether your goal is to eliminate blind spots, simplify monitoring, or enhance performance management, these seven tools represent the top choices of redefining enterprise observability.
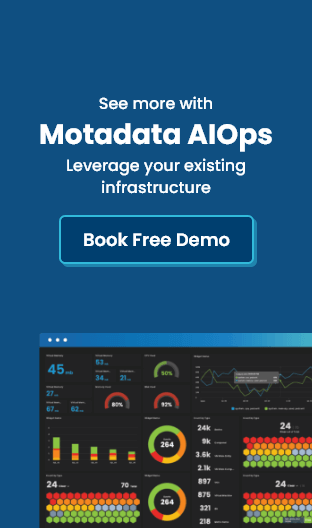
1. Motadata Unified Observability Platform
When leaders compare SolarWinds alternatives, one question always comes up: which platform actually gives a complete, dependable view of everything happening across the IT environment? Motadata Unified Observability Platform is built to answer that question clearly.
It brings every part of IT performance together, so decision makers can see what matters without sorting through scattered tools or inconsistent dashboards.
Instead of relying on multiple systems that limit visibility, Motadata centralizes how networks, servers, applications, databases, and cloud environments are monitored.
Why Teams Leaders Prefer Motadata Over Solarwinds
Get a quick side-by-side look at performance, and operational efficiency.
This helps organizations move away from reactive problem solving and toward a more predictable, steady operational rhythm. Leaders gain the confidence that comes from seeing the full picture and knowing their teams can respond quickly and effectively.
For enterprises running across on-prem, hybrid, and multi-cloud environments, Motadata offers a unified observability approach that removes complexity rather than adding to it. Thus for decision makers juggling between Motadata vs Solarwinds, the former offers reliable insights, helps reduce unnecessary delays, and supports smarter planning across the entire technology landscape.
Why It Stands Out
- Delivers unified observability across networks, applications, databases, and infrastructure
- Connects related insights clearly so teams can identify issues faster and understand service impact
- Enables full-stack visibility across on-premises, hybrid, and multi-cloud environments
- Provides leadership-ready dashboards that highlight performance, risks, dependencies, and trends
- Offers cost efficiency through consolidated licensing and reduced reliance on multiple standalone tools
Best For: Enterprises seeking a single-pane-of-glass observability platform that strengthens reliability, simplifies operations, supports hybrid growth, and offers a more strategic SolarWinds alternative.
2. Datadog
Anyone who has worked in fast-moving cloud environments knows how quickly things can break when systems scale faster than visibility. That is exactly where Datadog earned its reputation.
With more than 600 integrations and a strong presence in cloud-native setups, Datadog has become one of the most recognized SolarWinds alternatives for unified observability.
Teams rely on Datadog because it brings real-time clarity to distributed applications, microservices, and modern cloud stacks. Its dashboards make it easier to understand changing performance patterns, especially in environments where new services appear almost daily.
Highlights
- 600+ integrations across AWS, Azure, GCP, Kubernetes, and SaaS platforms
- Real-time dashboards that give unified visibility across services
- Watchdog’s anomaly detection helps teams catch unusual patterns
- Highly suited for microservices and container-driven architectures
Shortcomings
- Usage-based pricing can rise quickly as data grows
- Full functionality often requires multiple add-ons
- Dashboards can feel overwhelming at enterprise scale
Best For: Cloud-native teams and DevOps organizations that want instant, full-stack visibility along with strong alerting and visualization.
3. Dynatrace
If you have ever managed a complex enterprise environment, you know how hard it is to keep up with changing dependencies.
Dynatrace built its value around solving exactly that. It automatically discovers services, and helps teams understand how everything connects behind the scenes.
This makes Dynatrace one of the most reliable SolarWinds alternatives for organizations that operate at scale and cannot afford long investigation cycles. When uptime and user experience are non-negotiable, Dynatrace brings the level of depth enterprises expect.
Highlights
- Complete end-to-end observability from infrastructure to code
- Automated anomaly detection and root cause analysis
- Dynamic topology mapping for visual clarity
- Unified analysis of metrics, logs, and traces
Shortcomings
- Higher cost relative to other platforms
- Learning curve for new users
- Best suited for strong infrastructure setups
Best For: Large enterprises that want intelligent, automated observability with consistent insights across complex digital ecosystems.
4. New Relic
Most engineering leaders have used New Relic at some point in their careers, especially for application performance monitoring. It has long been a trusted choice for teams that want a clean, detailed view of how their applications behave in real time.
New Relic continues to stand out as a SolarWinds alternative because of its unified data model and the flexibility it offers across dashboards and performance insights. It is particularly strong for teams that want precise visibility into how their applications impact end users.
Highlights
- Strong APM with deep performance insights
- Unified telemetry for metrics, logs, and traces
- Highly customizable dashboards
- Usage-based pricing that is easy to start with
Shortcomings
- Costs increase with higher data volumes
- Initial configuration can take time
- Less automation than some AI-driven platforms
Best For: Engineering and DevOps teams focused on application performance, real-time debugging, and improving user experience.
5. LogicMonitor
Anyone who has managed large networks or data center environments knows the value of tools that get the basics right without unnecessary complexity.
LogicMonitor is exactly that kind of platform. It delivers reliable, hybrid infrastructure visibility and is widely appreciated for its simplicity and consistency.
Its automatic discovery and clean dashboards make it a practical SolarWinds alternative for organizations that want clear visibility without deep customization or complex onboarding processes.
Highlights
- Strong visibility across hybrid infrastructures
- Automated discovery and topology mapping
- Robust network and device monitoring
- Easy implementation with an intuitive UI
Shortcomings
- Limited APM capabilities
- Fewer analytics compared to advanced platforms
- Costs can increase with many monitored devices
Best For: IT operations teams looking for dependable infrastructure monitoring with straightforward implementation and minimal overhead.
6. Splunk Observability Cloud
Splunk has long been a household name in large enterprises, especially where data volume is measured in terabytes rather than gigabytes.
Splunk Observability Cloud builds on that heritage by offering real-time, unified visibility across logs, metrics, and traces.
Organizations choose Splunk because it is built for environments where performance insights need to be immediate, accurate, and scalable. When thousands of events happen every second, Splunk’s correlation and analytics help teams stay one step ahead.
Highlights
- Predictive analytics for early performance insights
- Real-time dashboards and service maps
- Strong noise reduction through event correlation
- Enterprise-level scalability
Shortcomings
- High cost of data ingestion
- Requires SPL expertise for advanced usage
- Can be complex to implement at large scale
Best For: Data-heavy enterprises that need real-time observability, strong analytics, and scalable monitoring across complex systems.
7. Elastic Observability (Elastic Stack)
Elastic has always appealed to teams that want flexibility and control. Elastic Observability extends that same philosophy into the monitoring space, giving organizations the freedom to shape dashboards, data pipelines, and search experiences exactly the way they want.
For companies that prefer customization over prebuilt workflows, Elastic remains a powerful SolarWinds alternative. Its strengths lie in fast search, scalable ingestion, and the freedom to deploy on-prem, hybrid, or cloud.
Highlights
- High-scale log, metric, and trace ingestion
- Fast search through Elasticsearch
- Customizable dashboards through Kibana
- Flexible deployment models
Shortcomings
- Requires technical expertise to set up effectively
- Limited built-in correlation features
- Costs can rise with large data retention needs
Best For: Technical teams and fast-growing organizations that want a flexible, customizable observability platform with strong search and analytics.
| Platform | Core Strength | Analytics & Insights | Scalability | Best For |
|---|---|---|---|---|
| Motadata Unified Observability Platform | Unified observability across infrastructure, networks, apps, and cloud | Clear, contextual insights with strong correlation and visualization | Enterprise-grade | Enterprises seeking a single, unified view across hybrid environments |
| Datadog | Cloud-native monitoring and integrations | Real-time visual insights and anomaly detection | Highly scalable | Cloud-first teams and modern DevOps organizations |
| Dynatrace | Deep full-stack observability | Automated dependency mapping and precise issue analysis | Enterprise-scale | Large enterprises with complex digital ecosystems |
| New Relic | Strong application performance monitoring | Detailed application insights and customizable dashboards | Scales well across app-centric environments | Engineering and DevOps teams focused on digital experience |
| LogicMonitor | Hybrid infrastructure and network monitoring | Practical performance insights with automated discovery | Mid-to-large scale | IT operations teams managing distributed infrastructure |
| Splunk Observability Cloud | Data-heavy analytics and powerful correlation | Predictive insights and real-time event analysis | Enterprise-scale | Data-driven organizations requiring deep, large-scale observability |
| Elastic Observability | Flexible, customizable observability | Fast search and analytics within Elastic Stack | Scales with flexible deployment models | Technical teams seeking customization and cost control |
Why Motadata Leads the Pack?
While all seven tools excel in specific areas, Motadata Unified Observability Platform stands apart for its all-in-one approach. It unifies observability across infrastructure, networks, and applications, offering unparalleled visibility and analytics in a single platform.
Motadata transforms IT operations by providing:
- A single source of truth across hybrid environments.
- Advanced correlation for faster root-cause detection.
- Custom visualization simplifies complex data.
- Scalable architecture that grows with organizational needs.
Where most tools depend on external integrations, Motadata delivers complete observability natively, reducing tool sprawl and operational overhead.
What is the Future of Unified Observability?
The evolution from monitoring to observability represents a defining shift in IT operations. The next generation of platforms must:
- Think contextually, correlating telemetry to identify cause and effect.
- Visualize intelligently, presenting data as insight rather than noise.
- Adapt continuously, scaling effortlessly with digital transformation.
Enterprises adopting observability-first strategies move from firefighting to foresight—transforming performance data into a strategic advantage. Every alert becomes actionable insight, and every metric drives resilience.
Key Takeaways
- Traditional tools like SolarWinds no longer meet the needs of complex, hybrid IT environments.
- Modern observability platforms deliver unified visibility and real-time analytics across domains.
- Motadata Unified Observability Platform leads with its single, intelligent ecosystem for holistic monitoring.
- Datadog, Dynatrace, and Splunk remain strong choices for cloud and data-driven enterprises.
Conclusion
IT monitoring has evolved from gathering data to understanding it, and now to acting intelligently based on insight. The next era of operations belongs to platforms that not only visualize performance but also interpret and improve it continuously.
SolarWinds paved the way for visibility in legacy infrastructures, but today’s digital enterprises require platforms that connect the dots, transforming data into understanding and understanding into proactive action.
Motadata Unified Observability Platform delivers exactly that. With full-stack observability, advanced analytics, and real-time visualization, it empowers IT teams to detect anomalies early, identify root causes quickly, and maintain resilience effortlessly.
If your goal is to modernize monitoring, reduce complexity, and achieve true unified visibility, it’s time to experience how Motadata Unified Observability Platform can help you transform visibility into performance and performance into growth.