Nowadays, applications are a critical component of various businesses.
These applications, be they employee-facing or customer-facing, affect user satisfaction or output, business success/failure, and organizational efficiency.
Application performance monitoring is, therefore, a vital methodology that helps verify that applications provide the performance, reliability, and user experience demanded by employees, partners, and customers.
By definition, APM encompasses various tools and methodologies used to measure and control enterprise applications’ efficiency.
It enables the IT professional to realize several metrics concerning the application and even performance problems and promptly rectify them to enhance performance.
Some parameters measured by APM tools include response time, CPU usage, and error rates.
These are useful in understanding the application’s health and can enable an organization to solve problems before they occur.
As organizations have deployed more sophisticated applications in recent years, APM has become critical to providing a smooth user experience.
Modern applications are built to run in distributed environments, use various dependencies, and communicate with different components.
APM offers deep-level transparency of application operations, ultimately enabling the IT department to determine how to solve congestion at every application tier.
This blog will discuss APM, why we need it, how it functions, its advantages and limitations, and the various APM tools available in the market.
We will also discuss the top APM tools and vendors and how AWS can help with application performance monitoring.
By the end of this blog, you will have a comprehensive understanding of APM and its significance in ensuring optimal application performance.
Definition: What is Application Performance Monitoring
Application Performance Monitoring (APM) is the process of monitoring, and managing the performance of a software application.
It involves using certain tools or techniques to track the KPIs identified on the physical constraints of performance, or issues affecting user satisfaction or the performance of the business.
APM provides monitoring of performance parameters that are defined by different terminologies such as response time, CPU, memory consumption, failure rate, and network delay.
It gives a live view of how components within an app work and how the application’s structure is configured.
APM tools enable the IT teams to track and evaluate the performance of the applications in your infrastructure and enhance their performance and user experience by addressing problems before they occur.
Application performance management is relevant in understanding whether an application is performing as expected by users, business partners, and customers.
It enables organizations to meet higher levels of availability, response time, and reliability, enhancing user satisfaction with products and services while reducing the impact of poor performance on the business.
In conclusion, APM is essential for managing application performance, improving the quality of application delivery to users, and realizing the high-quality application software users expect from organizations.
Why Application Performance Monitoring is important?
Application Performance Monitoring (APM) is an essential task for several reasons.
First and foremost, it improves a positive user experience, as the application’s performance characteristics are closely controlled.
Given the current application usage environment, users demand that application performance be optimized at the highest level.
People expect applications to be quick, practical, and functional.
If an application is slow or jam-packed with numerous performance complaints, users will likely become dissatisfied, which may affect business transactions and business results.
They also pointed to APM as relevant for business consequences, which is true because it provides a model for how people can and should work together.
Application optimization directly relates to revenue, customer satisfaction, and brand image.
Negative impacts have been observed. If applications run slowly or are simply unavailable, users will abandon transactions and hence have the potential to lose sales and revenue.
Further, negative user experiences reduce customers’ loyalty towards the firm and deteriorate the company’s reputation.
Thus, the main benefit of optimizing application performance is understanding how an application delivers business value, that is, to determine whether it is meeting the performance threshold required to support the business strategy and goals.
Besides, APM facilitates application performance issues evaluation.
It enables the timely detection of performance problems and solutions before they affect end users.
The metrics concerning an application’s performance also help the IT teams manage finger-pointing since they can gather data on the various aspects of an application to find out what is causing it to perform poorly.
The proactive performance management approach minimizes this problem and maximizes application efficiency.
Overall, APM is most significant in conveying a good user experience, supporting positive business outcomes, and facilitating efficient performance management for digital services.
Results from application performance monitoring can help organizations provide quality applications to their users and assist in achieving business objectives.
How does APM work?
Application Performance Monitoring (APM) works by continuously monitoring and analyzing software applications’ performance to enhance the application’s performance and level of service.
It involves collecting performance data from various sources, such as servers, databases, and network devices, and analyzing it to identify performance bottlenecks and potential issues.
APM tools collect performance data from various application components, including server metrics, database queries, network latency, and user interactions.
This data is then aggregated, analyzed, and visualized to provide insights into the application’s overall performance.
By monitoring key performance indicators and additional data points, such as response time, error rates, and CPU utilization, APM tools enable IT teams to identify complex application performance problems and take appropriate actions to resolve them.
Effective APM involves a combination of automated monitoring, real-time alerting, and proactive performance optimization.
APM tools continuously monitor performance metrics and generate alerts when performance thresholds are exceeded or anomalies are detected.
These alerts help IT service provider teams quickly identify and respond to performance issues, minimizing the impact on end users through root cause analysis.
Organizations must define relevant performance metrics, set performance thresholds, and establish performance baselines to ensure effective APM.
Organizations can proactively identify potential performance issues and take preventive actions by monitoring these metrics and comparing them against the predefined thresholds and baselines.
Overall, APM monitors and analyzes performance data to identify bottlenecks, optimize application performance, and ensure a smooth user experience.
Organizations can deliver high-quality applications that meet user expectations and support their business goals by implementing effective APM practices.
Five Elements of APM:

1. End-user experience monitoring: According to a Gartner survey, end-user experience monitoring is the most critical element of the APM. It collects information on how end-users interact with the application, identifies problems.
2. Runtime Application Architecture Discovery: This element of APM understands the application’s architecture and how different components interact during runtime. This makes it easy to identify dependencies and possible performance bottlenecks.
3. User-Defined Transaction Profiling: User-defined transactions traverse the architecture, which is why they are more important than we think. Transaction profiling refers to tracking individual user transactions or requests to understand when and where the events occur.
4. Component Deep-Dive Monitoring: This element involves monitoring and analyzing specific application components, such as databases, servers, or third-party integrations. It offers insights into each segment’s performance, allowing for targeted optimizations.
5. Analytics: Simply having information is not enough; you need to make sense of it—this is when analytics plays a role. It collects and analyzes performance data, providing valuable trends, patterns, and correlations that aid in making informed decisions about application optimization.
What metrics does application performance monitoring track?
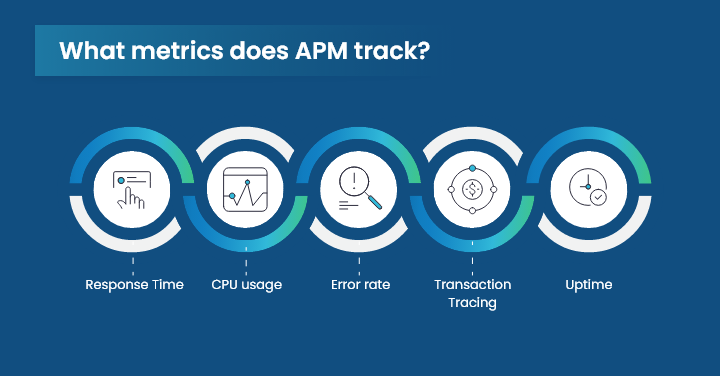
Here are some of the common metrics that a business can monitor using Application Performance Monitoring, including:
Response Time – Response time is one of a business’s key metrics, as it updates how long it takes a user to respond to the customer’s request. High response time implies the user responded to the request without delay, resulting in satisfied customers. Accurate real-user monitoring of digital experience monitoring of response time is generally measured by setting a predetermined threshold limit. If the count falls below the set limit, the solution will alert the team and compare performance to an acceptable baseline.
CPU usage – Another critical metric is CPU usage, which can be tracked using this powerful software. The application performance monitoring solution tracks CPU utilization score or memory usage and notifies the program if it receives the proper processing power.
Error rate – With APM, users can thoroughly analyze modern applications and report error rates. For example, a database query failure or inquiry times out. As the error rate exceeds the set parameter, an alert will automatically be sent to the team to update them about potential future issues.
Transaction tracing – It provides a precise image of each transaction made within an application, i.e., any external call, database call, etc., to keep an update of all the transactions.
Uptime – This metric is crucial for any business that offers online service. Most service level agreements (SLAs) only permit a certain percentage of downtime during predefined intervals. However, with this monitoring tool, you can keep track of application availability and compare it with customer-specified levels.
Benefits of Application Performance Monitoring
Alongside providing real-time insights, application performance monitoring (APM) offers unique benefits such as:
1. Improved User Experience
Monitoring application performance ensures a smooth and responsive user experience. Organizations can minimize downtime and prevent frustration by identifying and resolving performance issues before they impact end users.
2. Operational Efficiency
APM solutions help streamline IT operations by providing visibility into application performance and automating the detection and resolution of performance issues, reducing the time and resources spent on troubleshooting.
3. Enhanced Business Agility
Organizations can adapt to changing business requirements and scale their applications to meet growing demand. Identifying and optimizing performance issues ensures that applications can support business growth.
4. Reduced Costs
APM solutions help save money by minimizing lost revenue due to poor performance or outages. Organizations can avoid costly emergency fixes and reduce the need for additional infrastructure resources.
5. Data-Driven Decision Making
Organizations can make informed decisions about resource allocation and application optimization strategies by analyzing valuable insights into application performance trends.
Common Use Cases for Application Performance Monitoring
Application Performance Monitoring (APM) can be implemented across different IT domains to ensure optimal performance and user experience. Some of the common areas where APM can be applied include:
1. Web Application Monitoring
By tracking metrics such as page load times, server response times, and transaction throughput, organizations can ensure that their web applications deliver a fast and responsive user experience.
2. Mobile Application Monitoring
APM solutions help organizations monitor metrics such as app launch times, network latency, and API performance to ensure optimal performance across various mobile platforms and devices. This includes supporting modern frameworks such as Jamstack CMS, which rely heavily on APIs for functionality.
3. Cloud Application Monitoring
APM solutions provide visibility into the performance of cloud-based resources, such as virtual machines, containers, and cloud services, to help organizations optimize performance and ensure reliability in the cloud.
4. Microservices Monitoring
APM solutions offer transaction tracing capabilities that enable organizations to track the execution path of microservices-based applications and identify performance bottlenecks at the service level.
5. Enterprise Application Monitoring
APM solutions are also used to monitor the performance of enterprise applications, such as ERP systems, CRM platforms, and business intelligence tools.
By monitoring key performance metrics and user interactions, organizations can ensure that these mission-critical applications meet performance SLAs and support business operations effectively.
Advantages of an advanced APM platform
Advanced APM platforms provide several advantages in comparison to the traditional monitoring methods, such as:
1. Advanced cloud observability
AWS, Azure, and GCP are some of the popular cloud platforms used by a large group of businesses.
These applications, which run in containerized environments distributed across different cloud services, consist of millions of lines of code and features.
With the help of APM solutions and artificial intelligence through machine learning, businesses can smoothly work on these platforms and gain detailed insights into cloud operations.
The best part about these platforms is that they do not require any configuration or training.
They manage everything on their own and provide complete observability.
With advanced APM platforms, everything is possible, from tracking application performance to checking component status.
2. Continuous automation
With continuous automation capabilities, chances of human error will be reduced, and all operations will be performed faster.
Be it automated discovery of components, identification of unusual patterns, or triggering predefined actions, all tasks will be completed quickly and without manual intervention.
Organizations must constantly automate operations to ensure proper application performance because humans cannot maintain, configure, script, and source data in a cloud-native environment.
Automated processes will save time and human effort, resulting in an overall improvement in performance and customer satisfaction.
3. AI Assistance
The application performance monitoring platforms use AI techniques and algorithms to analyze the information gathered from different applications properly.
With AI assistance, users can find the root cause of the issue and detect anomalies at an initial stage, enabling quick solutions before the issue affects business operations.
Further, AI methods aid teams in prioritizing and filtering alerts based on their impact.
4. Cross-team collaboration
Advanced APM technologies enable cross-team communication by providing a centralized center where various teams within an organization may collaborate more successfully.
These team communication platforms facilitate information sharing, collaborative problem-solving, and goal alignment among teams, regardless of their departments.
Your team members might belong to the operational or development departments. However, with the APM, teams gain a unified view of the overall app performance and related KPIs, resulting in quick solutions and effective decision-making.
Conclusion
If an application loads slowly or continuously displays faults on the screen, the end user will likely move to another application.
An application failure can thereby destroy your company’s goodwill.
Therefore, it is best to spend time and money on top application performance management tools to track, manage, and assess your application’s performance and deliver a better end-user experience.
Businesses can maintain system functionality and catastrophe recovery with these potent tools.
With the right insights and reports, your company will be better equipped to identify and track errors and defects that interfere with IT operations and negatively affect performance.
Using APM tools like Motadata to deliver a seamless customer experience, you can quickly prevent issues.
Troubleshoot issues using these tools to avoid users having a negative application experience or calling your help desk frequently.
Their exclusive features help improve performance and optimize code efficiency.
FAQs
With APM, developers can gain full visibility into the different components of applications that help identify problems and errors in the application resulting in downtime.
By identifying the faults at an initial stage and troubleshooting issues, organizations can reduce errors and downtime that impacts directly the user experience.
As a result, the user faces fewer issues operating a software application, i.e., a higher satisfaction level and more revenue returns to the company.
APM uses machine learning and Artificial intelligence methods to trace transactional processes, monitor performance metrics, and detect anomalies.
It collects data from different sources, monitors unusual patterns, and discovers errors in real time.
Also, it plays a crucial role in preventing downtime by finding out and resolving issues that may turn into bigger problems in the future if left unnoticed and impact the application’s performance.
With all these actions, APM helps optimize the performance and improve user experience.
Performance issue diagnosis and resolution are made easier by integrating APM with DevOps methods.
Teams can identify and fix errors and bottlenecks during development by obtaining real-time application performance statistics by integrating effective APM tools into the CI/CD process.
Performance monitoring and enhancement of the application are encouraged by this integration.
APM in DevOps provides:
- Real-time insights into application performance.
- Facilitating rapid issue detection.
- Faster troubleshooting.
- Collaboration between development and operations teams for continuous improvement.