Oracle Database Monitoring: Key Metrics, Benefits & Best Practices
Oracle database monitoring is the continuous process of tracking performance, availability, security, and resource usage across Oracle database instances -- including tablespaces, sessions, jobs, and infrastructure metrics -- to maintain optimal operation and prevent downtime.
Oracle databases handle some of the most demanding enterprise workloads on the planet. Financial transactions, ERP systems, healthcare records, supply chain operations -- when these databases slow down or go offline, the business impact is immediate and expensive.
Yet many organizations still monitor Oracle databases reactively. They wait for tickets to come in, then scramble to figure out what went wrong. That approach worked when systems were simpler. It doesn't hold up in environments running hundreds of Oracle instances across on-prem, cloud, and hybrid infrastructure.
This guide covers what Oracle database monitoring involves, the key metrics to track, the benefits of getting it right, and how to build a monitoring strategy that keeps your Oracle environment healthy.
What Is Oracle Database Monitoring?
Oracle database monitoring tracks the usage, growth, performance, and health of Oracle database instances in real time. It covers everything from tablespace allocation and session activity to query execution and backup job status.
At its core, Oracle monitoring helps you answer three questions:
Is the database available and responsive? Track uptime, connection success rates, and response times.
Is the database performing within acceptable thresholds? Monitor query execution, session durations, wait times, and resource consumption.
Is the database secure and compliant? Watch for unauthorized access, configuration changes, and audit trail completeness.
Baselining: The Foundation of Oracle Monitoring
The most effective approach to Oracle database monitoring is baselining. By comparing current performance against historical metrics, you can recognize when performance drops below normal levels -- even if it hasn't triggered a static threshold alert.
Root cause analysis becomes far more efficient when you have baseline data to compare against. Instead of guessing what changed, you can pinpoint exactly when and where the deviation started.
Key Benefits of Oracle Database Monitoring
1. Shift from Reactive to Proactive
Proactive monitoring identifies warning signs before they become incidents. A tablespace approaching capacity, a session count trending upward, or a backup job running longer than usual -- these are all signals that something needs attention.
Catching these early means your team fixes issues during business hours instead of responding to 2 AM pages.
2. Faster Root Cause Identification
When applications slow down, the database is usually the first place teams investigate. With proper Oracle monitoring in place, you don't need to spend hours running diagnostic queries manually. The monitoring platform shows you exactly what's happening -- which sessions are blocked, which queries are consuming resources, and where bottlenecks exist.
3. Security and Compliance Visibility
Oracle database monitoring isn't only about performance. Tracking security events -- failed logins, new account creation, password changes, and configuration modifications -- is just as important. This data feeds into compliance reporting for standards like SOC 2, PCI-DSS, and HIPAA.
4. Better Capacity Planning
Historical monitoring data reveals growth patterns in tablespace usage, session counts, and resource consumption. This data drives informed capacity planning decisions, so you scale infrastructure based on actual trends rather than estimates.
Oracle Database Metrics That Matter
For a structured monitoring approach, organize your metrics into five categories.
Infrastructure Metrics
Infrastructure monitoring tracks the resources your Oracle database consumes at the system level. Key metrics include:
CPU time used by the Oracle database process
Available memory and memory allocation patterns
Disk space and disk queue lengths for waiting I/O
Virtual memory usage percentage
Network bandwidth for inbound and outbound traffic
An important detail: infrastructure metrics don't exist in isolation. A full disk doesn't just waste space -- it causes query failures, prevents log writes, and can crash the entire instance. Always correlate infrastructure metrics with database-level behavior.
Throughput Metrics
Throughput tells you how much work your Oracle database handles over time. Monitor these during different workload periods to build accurate baselines:
Connection wait time for database endpoints
Number of active database connections
Read query volume (received and in progress)
Insert, update, and delete command counts
Average DML command completion time
Completed transaction counts
Heap memory usage
Large deviations from baseline throughput values warrant immediate investigation and root cause analysis.
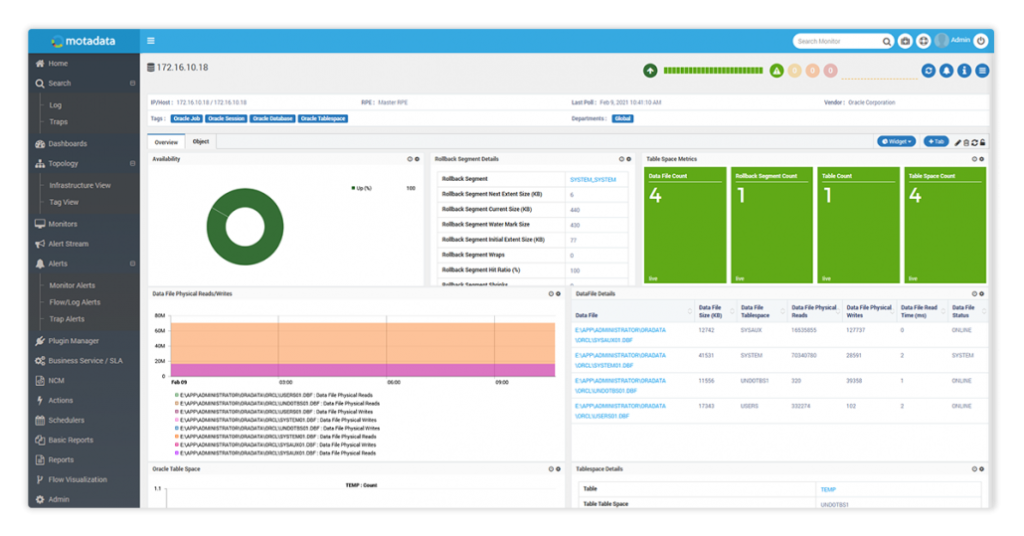
Performance Metrics
Performance counters should be reported at consistent time intervals. Focus on:
Session metrics -- connected, active, and blocked session durations and statuses
Query optimization -- query plan status and execution efficiency
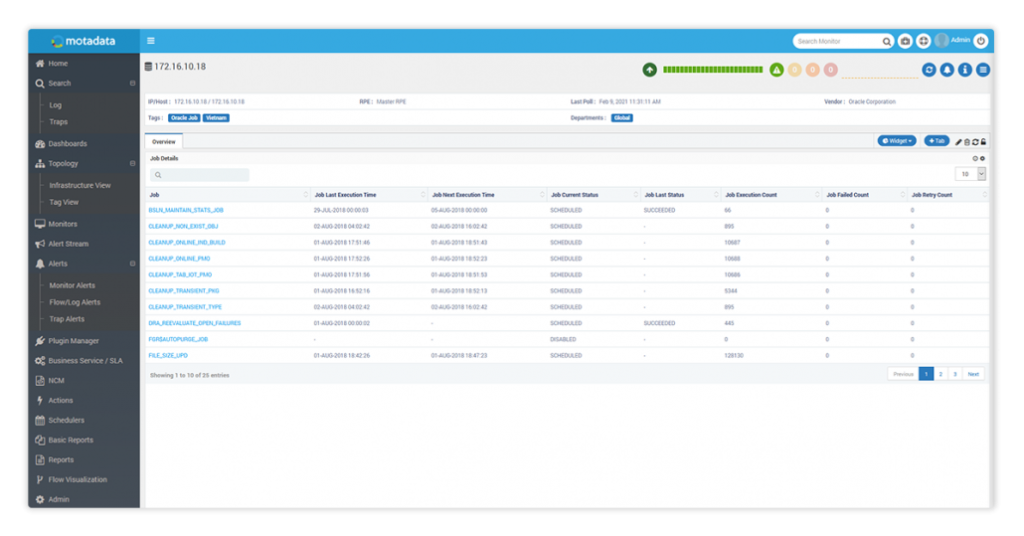
Job execution -- last execution time, job status, and completion rates
Backup jobs -- backup completion status and query optimization during backup windows
A drill-down analysis capability is valuable here. Surface-level metrics tell you something is slow; drill-down data tells you why.
Security Metrics
Oracle database security monitoring should align with your organization's overall security standards. At minimum, track:
Number of failed login attempts
Database configuration changes
New user account creation
Password changes and privilege modifications
Database administrators should watch for large deviations in aggregated session values. A sudden spike in failed logins or an unexpected new admin account often signals a security incident.
Oracle Data Guard Monitoring
If you run Oracle Data Guard for disaster recovery and high availability, these additional metrics are essential:
Instance status and lag between primary and standby databases
Log transfer progress and log apply service status
Data Guard protection mode (Maximum Performance, Maximum Protection, or Maximum Availability)
Current log sequence comparison between primary and standby
Log Monitoring
Log management is a core component of Oracle monitoring because logs contain information that metrics alone can't capture:
Database system events (startup, shutdown, errors)
User and system query history
Scheduled job output and error details
Your monitoring tool should collect, parse, and store these logs and transform them into searchable metrics and dashboard visualizations.
Oracle RAC Monitoring Considerations
Oracle Real Application Clusters (RAC) introduce additional monitoring requirements. In a clustered environment, you need visibility into:
Overall cluster status -- node count, individual node health, and cluster membership changes
Cluster ware health -- health checks for the cluster infrastructure itself
Alert log monitoring -- OCR or voting disk issues, node evictions, and cluster ware errors
Instance synchronization -- data consistency across multiple instances
A single-pane-of-glass view across all RAC nodes is the only practical way to manage cluster monitoring at scale. Switching between individual node dashboards wastes time and hides cross-node correlation patterns.
Building an Effective Oracle Monitoring Strategy
Step 1: Define What "Normal" Looks Like
Start by establishing baselines for every metric category. Run your monitoring tool for at least two weeks across typical workload cycles (daily, weekly, month-end) before setting alert thresholds.
Step 2: Set Tiered Alert Thresholds
Not every deviation needs a page. Configure three alert tiers:
Warning -- metric approaching baseline deviation (e.g., CPU at 75% when baseline is 50%)
Critical -- metric exceeding acceptable range (e.g., CPU sustained at 90%+)
Emergency -- database availability impacted (e.g., instance unreachable, replication lag exceeding 30 minutes)
Step 3: Automate Routine Responses
Common monitoring responses -- like killing a runaway query, expanding a tablespace, or restarting a failed backup job -- can and should be automated. This reduces response time and frees DBAs for deeper analysis work.
Step 4: Correlate Across the Stack
Database problems rarely exist in isolation. A slow Oracle database might be caused by a storage issue, a network problem, or an application generating bad queries. Your monitoring strategy should correlate database metrics with infrastructure and application data.
Step 5: Review and Adjust Regularly
Baselines drift as workloads change. Review your alert thresholds quarterly, update baselines after major application changes, and retire metrics that no longer provide value.
Three Parameters for Peak Oracle Performance
To get the best performance from your Oracle databases, focus on these three areas:
Query optimization -- identify long-running, I/O-intensive, and memory-intensive queries and optimize them for fast application performance.
Buffer tuning -- ensure servers have enough buffer cache to perform sort operations in memory rather than on disk. In-memory operations are orders of magnitude faster.
Wait time reduction -- identify query waits and tune the database subsystem to minimize them. High wait times are a reliable indicator of contention problems.
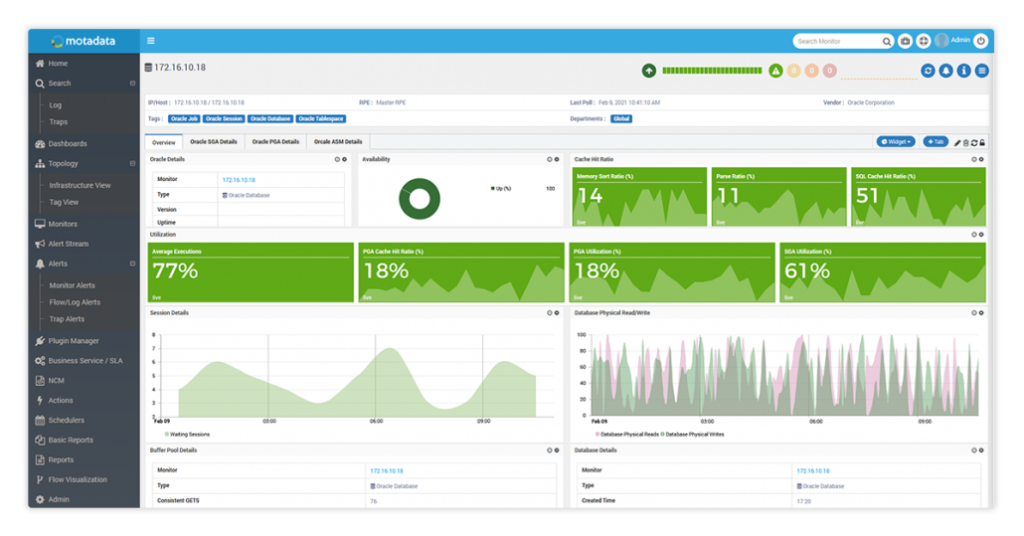
Monitor Your Oracle Databases with Motadata
Motadata delivers a unified Oracle database monitoring solution that gives your team full visibility into Oracle health, performance, and security -- without juggling multiple tools.
With Motadata, you can:
Track Oracle sessions and server load -- extract real-time data about session counts, active users, wait times, and resource consumption.
Optimize with ease -- use Motadata's AI-driven insights to identify performance bottlenecks and tune your Oracle environment.
Get details in one click -- database sessions, active users, session summaries, and wait time metrics are available from a single dashboard.
Set intelligent alerts -- analyze response times with customizable dashboards and configure thresholds that trigger meaningful notifications.
Monitor around the clock -- continuous monitoring ensures your Oracle databases have enough buffer to perform sort and join operations in memory.
Stop guessing about your Oracle database health. Start monitoring with Motadata and get the visibility you need to keep critical workloads running.
FAQs
What is Oracle database monitoring?
Oracle database monitoring involves continuously tracking the performance, availability, health, and security of Oracle database instances. It covers tablespace usage, session activity, query performance, infrastructure resources, and security events to ensure optimal operation and fast issue resolution.
Why is monitoring Oracle databases important?
Monitoring prevents unplanned downtime, speeds up root cause identification, ensures data integrity, and maintains compliance with regulatory standards. Since Oracle databases typically run mission-critical workloads, even brief performance degradation can have significant business impact.
What are the most important Oracle database metrics to track?
Focus on five categories: infrastructure (CPU, memory, disk, network), throughput (connections, transactions, DML operations), performance (sessions, query optimization, jobs), security (failed logins, config changes, privilege modifications), and logs (system events, queries, job outputs).
How does Oracle Data Guard monitoring work?
Oracle Data Guard monitoring tracks the replication relationship between primary and standby databases. Key metrics include instance status, replication lag, log transfer and apply progress, protection mode, and log sequence synchronization. These metrics ensure your disaster recovery setup is ready when you need it.
How can Motadata help with Oracle database monitoring?
Motadata provides an AI-native monitoring platform that auto-discovers Oracle instances, tracks performance metrics in real time, establishes intelligent baselines, and alerts on anomalies. It offers a unified dashboard for Oracle alongside other database types, eliminating the need for separate monitoring tools.


