What is End User Experience Monitoring (EUEM)? How It Relates to RUM and DEM
Why do tickets about a slow application keep arriving while every server, link and service check reports normal? That mismatch is the problem end user experience monitoring exists to solve. A healthy server is one thing, but the business notices something else: whether people can finish their work or complete a purchase without delays or errors.
Monitoring in most IT operations groups was built to watch the systems from the inside, so it reports CPU load, memory and uptime. Ask it why a page took eight seconds to render in a branch office, and it has no answer. The same goes for a submit button that froze on one browser version, which users usually report to the service desk well before any alert fires.
End user experience monitoring, or EUEM, works the other way round, beginning with what the user saw and tracing back from there. Within EUEM, real user monitoring handles the browser and the application itself, which is exactly the piece most explanations leave out. Here is what this blog covers:
What EUEM covers and how it differs from end user experience management
The four components of EUEM and the blind spot each one has
How RUM covers the application layer, and how EUEM relates to DEM
The metrics, workflow and tool checks that make EUEM useful to operations leaders
What is End User Experience Monitoring (EUEM)?
End user experience monitoring (EUEM) judges applications, networks and devices from the user's chair. If someone waited ten seconds for a report or saw an error on screen, EUEM records it, along with where the delay started. You'll also see it spelled end-user experience monitoring, and some vendors simply call it user experience monitoring.
Most vendor pages answer what is end user experience monitoring by talking about devices and networks, and for years that was the right answer, because the practice started in desktop support and WAN tuning. That has changed. A modern web app does much of its work in the browser, which is why EUEM now spans four kinds of telemetry and belongs inside a wider observability practice.
Operations staff lean on it for three questions in particular:
Is the experience degraded right now, and for which users?
Where in the path did the degradation start: device, network, frontend or backend?
Did the fix restore the experience for the users who were affected?
What Does End User Experience Mean in Practice?
End user experience is what a person notices while trying to get something done, whether that's a smooth checkout or a form that won't submit. Speed is part of it, and so is a steady page and a task that actually finishes. Google's Core Web Vitals put standard numbers on the first three.
Responsiveness: How quickly pages load and how fast the interface reacts to clicks and typing
Reliability: Whether pages, forms and transactions complete without errors
Visual stability: Whether content stays in place while the page loads
Task completion: Whether the user reaches the end of the journey they started
Take a hypothetical expense portal whose API calls all return in under a second. Employees still get frustrated when a layout shift moves the submit button just as they tap it. Infrastructure metrics would stay within range, while experience metrics would flag the problem on day one.
How Does EUEM Differ From End User Experience Management?
End user experience management is what happens after the data comes in. Monitoring finds and explains the signals. Management assigns an owner, picks a fix and comes back later to confirm the experience got better.
Monitoring: Collects telemetry, sets baselines, detects deviations and points to the likely cause
Management: Assigns ownership, ranks fixes by business impact, automates remediation and reports experience against targets
You'll find vendors swapping the two terms freely. Here, EUEM refers to the measurement layer, because that is usually where an IT organization spends first.
Why do IT Operations Leaders Need End User Experience Monitoring?
End user experience monitoring gives IT operations leaders a service quality measure that customers and colleagues would recognize. Without it, complaints tend to be the first warning that anything is wrong.
Why has this gap grown? A few changes stand out:
Distributed users: Staff work from homes, branches and client sites, on networks IT does not own
SaaS and third-party dependencies: Critical workflows run through services whose servers IT cannot instrument
Heavier frontends: Single page applications move much of the work into the browser, where server metrics have no view
Customer-facing digital channels: Portals, apps and checkouts tie experience directly to revenue and retention
Every one of these pushes part of the experience beyond what infrastructure monitoring can see. EUEM brings it back into view by measuring at the user's end of the connection.
What Business Outcomes Does EUEM Support?
The value shows up in four places that an IT director reports on.
Faster detection: Problems surface from user data before tickets pile up, which shortens MTTD
Faster resolution: Correlated data narrows the search, so engineers spend less time ruling out healthy layers and MTTR drops
User-side service targets: Service level agreements reflect what customers and employees experience
Better prioritization: Fix order follows the number of affected users and the value of each journey
Prioritization is often what IT directors value most. A loose complaint that the portal feels slow turns into a ranked list of affected pages, regions and user groups, with a cost next to each.
This ranking is how EUEM ties into business service reliability. The components below are easier to judge with that ranking in mind.
What are the Four Components of End User Experience Monitoring?
End user experience monitoring is made up of four components, one for each stretch of the path between a person and the application. Every component has gaps, and another one usually fills them. Application performance monitoring (APM) covers the server side and works alongside all four.
The four components also split by how they collect data. Three of them are passive and simply record what happens as people work. Synthetic monitoring works differently and creates its own test traffic.
Know what each method can see before you spend money on it. The layout below spells out which segment each component sees.
1. Real User Monitoring (RUM)
Real user monitoring gathers performance and behavior data straight from the browsers of people using a web application. A lightweight script on each page records load times, clicks, errors and resource timings. You can capture every session or just a sample.
What it sees: Page load and render times, Core Web Vitals, JavaScript errors, slow resources and user journeys
Best for: Measuring application experience across every browser, device type and region your users bring
Blind spot: It needs traffic to measure anything, and it has no view of device health outside the browser
RUM sees the application the way users receive it. For that reason it acts as the application layer of EUEM, and we will come back to it in more detail later.
2. Synthetic Monitoring
Synthetic monitoring runs a script against your application from chosen test locations, on whatever schedule you pick. Because the script repeats the same login or checkout each time, one run compares cleanly with the next.
What it sees: Availability, response time and step-by-step transaction success from known locations
Best for: Catching outages during quiet hours, testing before launch and validating third-party endpoints
Blind spot: It measures a scripted path on clean test infrastructure, which can differ from how users behave
Most organizations end up using both, and our comparison of RUM vs synthetic explains where each fits.
3. Endpoint Monitoring
Endpoint monitoring reads health data from employee machines, from laptops to virtual desktops. The productivity-focused version of this goes by digital employee experience, or DEX.
What it sees: CPU and memory pressure, application crashes, boot and login times, Wi-Fi signal and device configuration
Best for: Diagnosing problems specific to one machine, image or office location
Blind spot: It sees the device well but has limited view into what happens inside a web application or on the server
Endpoint data usually comes from agents deployed alongside endpoint management tooling.
4. Network Path Monitoring
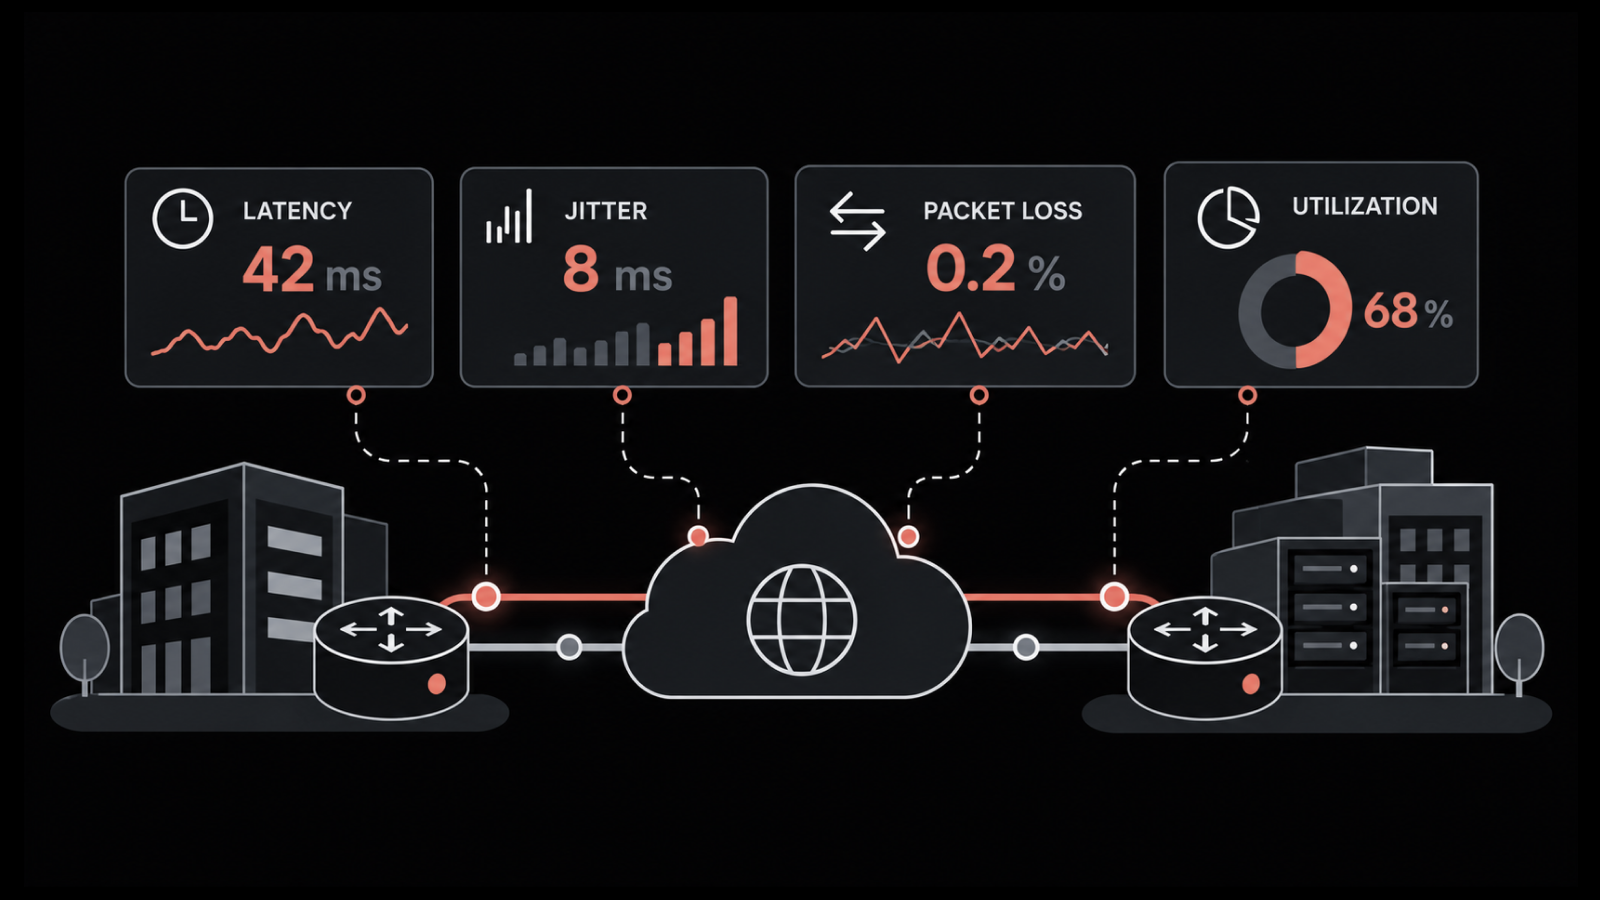
Network path monitoring checks every hop between the user and the application. A home router, an ISP handoff, a VPN tunnel or an SD-WAN link can each add delay, and this component shows which one did.
What it sees: Latency, packet loss, jitter and path changes along each segment
Best for: Separating a network fault from an application fault, especially for remote and branch users
Blind spot: It confirms the path is healthy but cannot explain a slow page caused by frontend code or a database query
Our glossary entry on network experience monitoring covers this layer on its own. Hop-level data of this kind is what network path visibility provides inside an observability platform.
How Do the Four EUEM Components Compare?
Side by side, the differences are easier to see.
Component | Data source | Question it answers | Needs help from |
Real user monitoring | Browser sessions of actual users | Which users are slow, on which pages, and why? | Endpoint and network data for causes outside the browser |
Synthetic monitoring | Scripted tests from fixed locations | Is the service up and meeting its baseline right now? | RUM for coverage of actual behavior and devices |
Endpoint monitoring | Agents on employee devices | Is this machine or image causing the problem? | RUM and APM for application-side causes |
Network path monitoring | Hop-by-hop path measurements | Is the network adding delay or loss? | RUM and APM to explain slow pages on a healthy path |
No component covers the whole path, so established programs run at least two. Which pair? It depends on who matters most, and for customer-facing web apps the application layer is the natural starting point.
How Does Real User Monitoring Cover the Application Layer of EUEM?
Real user monitoring covers the application layer of end user experience monitoring. It measures what happens in the user's browser, one page view and one click at a time. This is where many modern experience problems start, and it is the layer device and network tools see least.
That makes RUM the practical form of end user application monitoring for web applications. On the business side, RUM is what links a slow page to a lost sale or a request someone gave up on. Here are questions only RUM can answer on its own:
Which pages and interactions are slow for users in a specific region, browser or device class?
Which JavaScript errors appear most often, and which release introduced them?
Which steps in a journey lose the most users, and does slowness explain the drop?
Which backend call is responsible for a slow click?
What Does RUM Capture That Device and Network Tools Miss?
RUM records details that only exist inside the browser session.
Rendering and interaction timing: Core Web Vitals for main content load, interaction delay and layout shift, measured on users' own devices
Frontend errors: JavaScript errors grouped by message, page, browser and release
Session context: Session replay that shows what the user saw and clicked before an error
Script delays: Frontend flame charts that show which scripts kept the page busy and delayed a click
Journeys and funnels: User journeys and conversion funnels that tie performance to completed tasks
A device agent might report a healthy laptop with full Wi-Fi bars during that session. Meanwhile a third-party script holds up the page for several seconds after the click, and RUM is what catches it.
How Does RUM Connect User Sessions to Backend Causes?
RUM gets much more useful once you link each session to the backend work behind it. With backend traces attached to frontend events, a slow click resolves to a specific service call, query or external dependency.
This is where EUEM meets application performance monitoring. APM covers the server's side of the story, and RUM covers the user's side of the same moment. In Motadata RUM, each user action is tied to application, infrastructure and network data on one platform.
Split a slow click into browser time and backend time first, and you will know whether it belongs with a developer or a network engineer. Below, one user's 4.6-second wait is broken into the spans behind it.
Here is a hypothetical. Claim submissions at an insurer slow down for users in one region, yet the network checks pass and endpoint data looks fine. Grouping the slow sessions in RUM shows they share one browser version, and the linked trace reveals the upload service retrying the same request three times for that browser.
Where Does RUM Need Help From Other EUEM Components?
Anything that goes wrong outside the browser needs a different data source. This is also why the application layer works best as one part of a combined program.
Low or no traffic: Pages with few visitors, or outages that stop the page from loading at all, need synthetic checks
Device-level faults: A failing disk or an overloaded virtual desktop shows up as slowness in RUM, and endpoint telemetry confirms the cause
Network segments: RUM can show that one region is slow, while path data shows which hop adds the delay
Thick-client applications: Desktop software outside the browser needs endpoint or APM coverage
How is End User Monitoring Different From Real User Monitoring?
End user monitoring is the umbrella term for any method that measures experience from the user's side, and real user monitoring is one specific method within it that collects data from actual user sessions. Every RUM deployment is a form of end user monitoring, while plenty of end user monitoring involves no RUM at all.
The end user monitoring vs real user monitoring confusion mostly comes from loose labeling. For one vendor the phrase means RUM and nothing else. Another uses it for a bundle that includes synthetic tests and device agents.
Point of comparison | End user monitoring | Real user monitoring |
Scope | Any user-side measurement: RUM, synthetic, endpoint and network | Live browser sessions from actual users |
Data source | Browsers, scripts, device agents and network probes | A lightweight script in the web page |
Coverage | Web, desktop, SaaS and network paths, depending on components | Web applications and the users who visit them |
Strength | Locates the faulty layer across the full path | Shows what each user experienced, session by session |
Limitation | Only as complete as the components deployed | Needs traffic and has no view outside the browser |
When a product is sold as end user monitoring, ask which of the four components come with it. Whatever is missing is a blind spot you will have to fill some other way.
How Does EUEM Relate to Digital Experience Monitoring (DEM)?
End user experience monitoring is the older name, rooted in IT operations. Analysts and vendors now favor digital experience monitoring (DEM), a broader label. It also folds in application performance and business process monitoring, so in scope it comes close to full-stack observability.
Many writers treat the two as the same thing, and the overlap is big enough to justify it. When you are planning, scope is the difference worth keeping in mind:
EUEM: Centers on the human user and the four components that measure their experience
DEM: Extends the same idea to the application internals and business workflows behind each experience
RUM: Supplies the application-layer data both of them depend on for web applications
We cover the category itself, with use cases and rollout advice, in our guide to digital experience monitoring. Comparing platforms? Our roundup of DEM tools is a good place to start.
Which End-User Experience Monitoring Metrics Should You Track?
End-user experience monitoring metrics fall into five groups. We'll go through them one by one below. Pick a few from each, since tracking every possible number only clutters the dashboard.
1. Application Experience Metrics
RUM supplies these numbers, and they describe the waiting users do in the browser. For Core Web Vitals specifically, Google looks at the 75th percentile of visits and compares it with published thresholds.
Main content load (LCP): Good is 2.5 seconds or less
Interaction responsiveness (INP): Good is 200 milliseconds or less
Visual stability (CLS): Good is a score of 0.1 or less
Page load time: Full load and render timings by page, browser and region
JavaScript error rate: Share of sessions with at least one frontend error
Why percentiles? Because a page can pass on average and still frustrate people on older phones or in far-off regions. Split page load results by browser and region before choosing what to fix.
When you report load times, use the 75th percentile, the same point Google scores Core Web Vitals on. In the chart below, the average clears the target while six slow visits pull the 75th percentile above it.
2. Transaction and Journey Metrics
Journey metrics tie speed to numbers the business already watches, like completed orders.
Transaction completion rate: Share of started tasks, such as checkouts or ticket submissions, that finish
Funnel drop-off by step: Where users leave a journey and whether slowness rises at that step
Apdex score: A satisfaction score from 0 to 1 based on the share of responses that meet a target time
Executives tend to like the Apdex score. One figure, tracked quarter after quarter, is easier for them to follow than a table of response times.
3. Endpoint Health Metrics
When a problem starts on the user's own laptop, these are the numbers that show it.
Device resource pressure: Sustained CPU and memory use on user machines
Crash and hang rate: How often desktop applications fail per device
Boot and login time: How long users wait before they can start work
Wi-Fi quality: Signal strength and drop frequency on the local link
4. Network Quality Metrics
Network metrics show whether the path between user and application is adding delay.
Latency: Round-trip time between the user and the application
Packet loss: Share of packets that never arrive, which forces retransmissions
Jitter: Variation in latency, which matters most for voice and video
DNS and connection time: Time spent resolving and connecting before any content loads
For causes and fixes on this layer, see our guide to network latency.
5. Operational Response Metrics
These measure how well the EUEM program itself works.
Mean time to detect: How long a degradation runs before someone is alerted
Mean time to resolve: How long from detection to confirmed recovery for affected users
Tickets per affected session: How often users report problems the monitoring already caught
Keep an eye on that last one. If users report issues your data never caught, either coverage has gaps or thresholds are too loose. That is a process problem as much as a data problem, and the next section deals with it.
How Does End User Experience Monitoring Work in Practice?
End user experience monitoring runs as a repeating cycle. Data arrives, someone compares it to normal, a fix goes in, and user data confirms whether it worked. Broken down, there are six steps:
Collect: Instrument web applications with RUM, add synthetic checks for critical journeys, and deploy endpoint and network probes where users are distributed
Baseline: Learn normal ranges for each metric by page, region and time of day
Detect: Alert when a metric moves outside its baseline for a meaningful share of users
Segment: Segment sessions by browser, device, region, release and user group to see who is affected
Correlate: Link affected sessions to traces, logs, infrastructure metrics and network paths to find the cause
Verify: Confirm in user data that the experience recovered for the same segment
Two habits keep this loop fast. One is a saved view for each critical journey, so the check after a release is fast. The other is a shared set of experience dashboards for service owners and the network operations center (NOC), which ends arguments about whose numbers are right.
As a hypothetical, take a retailer whose mobile checkout slows down in one country right after a release. Filtering the slow sessions points to the new build and one payment widget. Distributed tracing then finds a slow call to a third-party service, and after the rollback, checkout times in the user data return to baseline within minutes.
How Should Business Leaders Use End User Experience Monitoring Data?
End user experience monitoring data helps business leaders decide where to invest, what to ship and how to hold providers to account. Engineers use these numbers to troubleshoot. Tie them to journeys and user groups, though, and they start answering commercial questions too.
Business decision | EUEM evidence that supports it |
Which digital improvements to fund first | Affected users and drop-off on revenue or productivity journeys |
Whether a release is safe to keep | Experience metrics for the new release against the previous one |
Whether a SaaS or hosting provider meets its commitments | User-side response times and errors for that provider's services |
How to report service quality to the board | Trends in journey completion, Apdex and time to resolve |
This translation is what earns EUEM its budget. For help presenting it, see our guide to board-level metrics.
What Should You Look For in End User Experience Monitoring Tools?
End user experience monitoring tools are best judged on how much of the user path they cover and how fast they get from user data to a cause. Most feature lists read alike. Pointed questions tell them apart far better.
Seven questions help compare end user experience monitoring software during evaluation:
Coverage: Which of the four components does the platform include natively, and which need separate products?
Application depth: Does RUM capture Core Web Vitals, JavaScript errors, session replay and journeys, or only page load times?
Backend correlation: Can a slow user session link directly to the trace, log and infrastructure metric behind it?
Framework support: Does it cover single page applications built with React, Angular, Vue or Next.js, including screen changes that happen without a full page reload?
Segmentation: Can you slice performance by device, browser, region, release and customer group without exporting data?
Privacy controls: Does it offer input masking, sampling and data controls that satisfy your compliance requirements?
Operating model: Can it run on-premises or in your own cloud, and does pricing scale predictably with session volume?
Want a ranked view? Our list of the best RUM tools runs current platforms through these same checks.
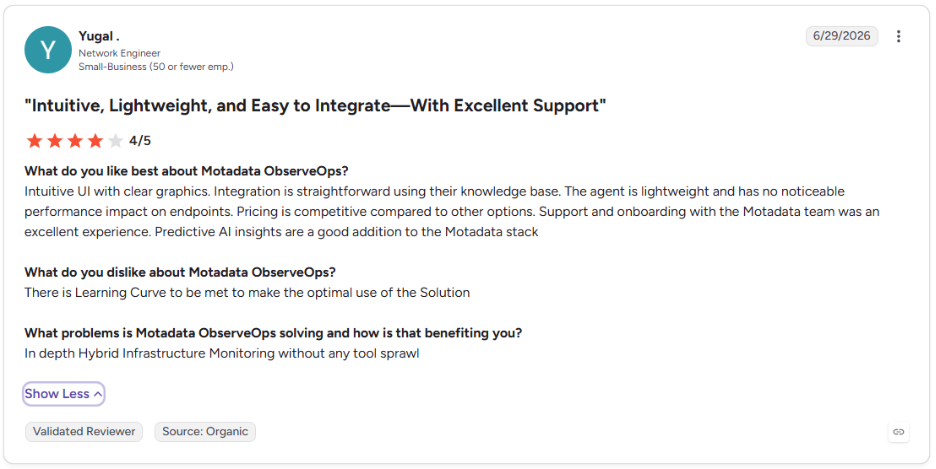
This is what our client says about Motadata ObserveOps on G2.
What are the Main Use Cases for End User Experience Monitoring?
End user experience monitoring pays off most where a slow or broken journey costs money, working hours or customer trust. Most enterprise programs start with one of these:
Customer-facing web applications: Checkouts, booking flows and customer portals where every delay can cost a conversion
Digital banking and financial services: Login, payment and account journeys where reliability shapes trust, a theme covered in our post on banking applications
Hybrid work and SaaS: Employee access to email, collaboration and business SaaS from homes, branches and client sites
Internal business applications: ERP, HR and service portals where slowness turns into lost working hours
Release validation: Confirming after each deployment that the experience held steady for every user group
What ties them together is accountability. EUEM hands IT a measure taken from the user's side, and that is much harder to argue with than a server health chart.
What are Common Challenges in End User Performance Monitoring?
End user performance monitoring gets harder at scale, and the same few problems show up in most rollouts.
Data volume: Recording every session on a busy application produces large volumes, so sampling rules need care to keep rare errors visible
Privacy and consent: Session data can contain personal information, which calls for masking, retention limits and clear policies
Split ownership: Frontend, backend, network and desktop groups each own one layer, and siloed monitoring slows every handoff
Alert noise: Experience metrics fluctuate naturally, so static thresholds create false alarms where per-page and per-region baselines would not
Single page applications: Screen changes inside a single page application do not trigger full page loads, so check a tool's framework support before rollout
Most of these are ownership problems as much as technical ones. A shared target helps, such as a service level objective on checkout speed that every group is measured against.
Extend EUEM to Application-Layer Observability with Motadata ObserveOps
Much of the published guidance on EUEM approaches experience as a device and network question. It will catch a failing laptop or a busy link. What it tends to miss is the browser and the application code, which is where many slowdowns now begin.
Motadata ObserveOps adds that application layer to the same platform that already watches your infrastructure and network:
Browser-side capture: Core Web Vitals, frontend errors, session replay and user journeys from users' browsers
Cross-layer correlation: Each session linked to application, infrastructure and network telemetry
One investigation path: A single route from a user complaint to its cause, without switching tools
A fair caveat applies to every browser-based RUM product, ours included. RUM measures web applications, so you will still want endpoint tools for employee laptops and thick-client software. For the web applications customers and employees depend on most, starting EUEM at the application layer gives operations leaders the most direct view of what users experience.
FAQs
What is end user experience monitoring in simple terms?
End user experience monitoring measures how applications perform from the user's side of the screen. It tracks load times, errors and responsiveness alongside device and network health, so IT can find problems before users report them and trace each one to its cause.
What is the difference between end user monitoring and real user monitoring?
End user monitoring is the umbrella for every user-side method, including synthetic tests, device agents and network probes. Real user monitoring is one of those methods and collects data from actual browser sessions. Most EUEM programs use RUM as the application-layer component and add the others for full coverage.
Is end user experience monitoring the same as digital experience monitoring?
The terms overlap and are often used interchangeably. EUEM is the older, operations-focused name centered on the human user, while digital experience monitoring is the broader category that also groups application performance and business process monitoring. Both depend on real user data for web applications.
Which metrics matter most in end user experience monitoring?
Start with Core Web Vitals, page load time and JavaScript error rate for applications, then add transaction completion and funnel drop-off for key journeys. Network latency, packet loss and device health explain causes outside the browser. Detection and resolution times show how well the program itself performs.
Can one platform handle end user experience monitoring across applications and infrastructure?
Platforms that combine real user monitoring with APM, infrastructure and network monitoring can follow an issue from the browser to the backend. Motadata ObserveOps correlates user sessions with traces, logs and network data in one place. Device telemetry for employee laptops typically still comes from endpoint tools.
Author
Poonam Lalani
Content Strategist
Poonam Lalani is a B2B content strategist and writer with a background in computer engineering and experience across enterprise technology domains, including AI, cloud, DevOps, data engineering, and IT operations. She specializes in creating research-driven content that simplifies complex ideas and supports product education, thought leadership, and business growth.