What Is Network Latency? Causes, How to Measure It, and Ways to Reduce It
Slow application complaints are among the hardest tickets in IT to close. The network gets blamed first; the dashboard shows nothing wrong, and the ticket bounces between teams for a week.
Network latency sits at the centre of that argument more often than any other metric.
Most dashboards report latency as a single average, and that average hides the slow requests people actually notice. A path can average 30 ms and still drop a call every ten minutes.
Latency belongs beside the other network performance metrics on your dashboard rather than alone on a tile.
Network latency has a short list of causes, real benchmarks, and a diagnostic order that works. Teams go wrong by treating it as one number rather than a spread.
Here is what this covers:
A plain definition comes first, along with the four separate delays that add up to the number on your dashboard.
You will see what causes network latency, ordered by how cheap each cause is to rule out.
Benchmarks run by application, from the 20 ms voice traffic wants to the 150 ms one-way ceiling in ITU-T Recommendation G.114.
Four measurement methods hold up in practice, and one common misreading of ping results gets its own section.
The fix list and a six-step troubleshooting sequence close the piece, including how to tell whose network is at fault.
By the end you will set a latency target per application. You will measure against it honestly. And you will know which lever to pull when the number moves.
What Is Network Latency?
Network latency is the time it takes for data to travel from a source to a destination across a network, measured in milliseconds. Low latency means data arrives quickly. High latency means data lags on the way. Users feel that lag as slowness.
Most tools report latency as round-trip time, or RTT. RTT covers the full there-and-back journey. Your request reaches the server, the server answers, and the answer comes home.
One-way delay is the other half of the picture. Halving your RTT does not give it to you, because traffic often takes a different route back.
The figure on your dashboard is four delays stacked together. Separating them turns a latency complaint into a fix.
Delay type | What it is | What changes it |
Propagation | Time for the signal to cross the physical distance | Route length and the transmission medium |
Serialization | Time to clock the packet onto the wire | Link speed and packet size |
Processing | Time each device spends reading a header and forwarding | Device class and how many features are enabled |
Queuing | Time the packet waits in a buffer | Congestion and buffer sizing |
Propagation is fixed by physics. Light crosses a kilometre of silica fibre in about 4.9 microseconds.
A London to Singapore path therefore carries roughly 50 ms of one-way delay before a router touches it. No amount of bandwidth changes that.
Queuing delay is the one that swings. On an idle link it sits near zero. Once utilisation passes about 70 percent it climbs fast. Most latency complaints that land on a Monday afternoon are queuing delays in disguise.
What Causes High Network Latency?
High network latency comes from six causes. They turn up in a predictable order of blame. We rule out the first two before touching anything else, because they are the cheapest to check.
1. Physical Distance and Route Length
Distance sets the floor for your latency. The route matters more than the map. Traffic from Mumbai to Frankfurt may transit Singapore depending on how your provider peers, which adds thousands of kilometres to a path that looks short.
2. Number of Hops and Device Processing
Every router, switch, and firewall on the path adds processing delay. A firewall running deep packet inspection adds more than a switch doing a plain forward. Ten hops of well-provisioned hardware might add 5 ms in total. One overloaded firewall can add 40 ms by itself.
3. Congestion and Queuing
When a link carries more traffic than it can forward, packets wait in buffers. That wait is pure added latency, and it grows non-linearly.
A link at 60 percent utilisation behaves nothing like the same link at 95 percent. A nightly backup job can therefore wreck a video call on a shared circuit.
4. Transmission Medium
Fibre beats copper, and copper beats wireless. Wired Ethernet typically sits at 1 to 10 ms on a local network. Wi-Fi runs 2 to 20 ms and spikes higher under interference. Each switch between media adds a few milliseconds of conversion.
5. Server and Application Response Time
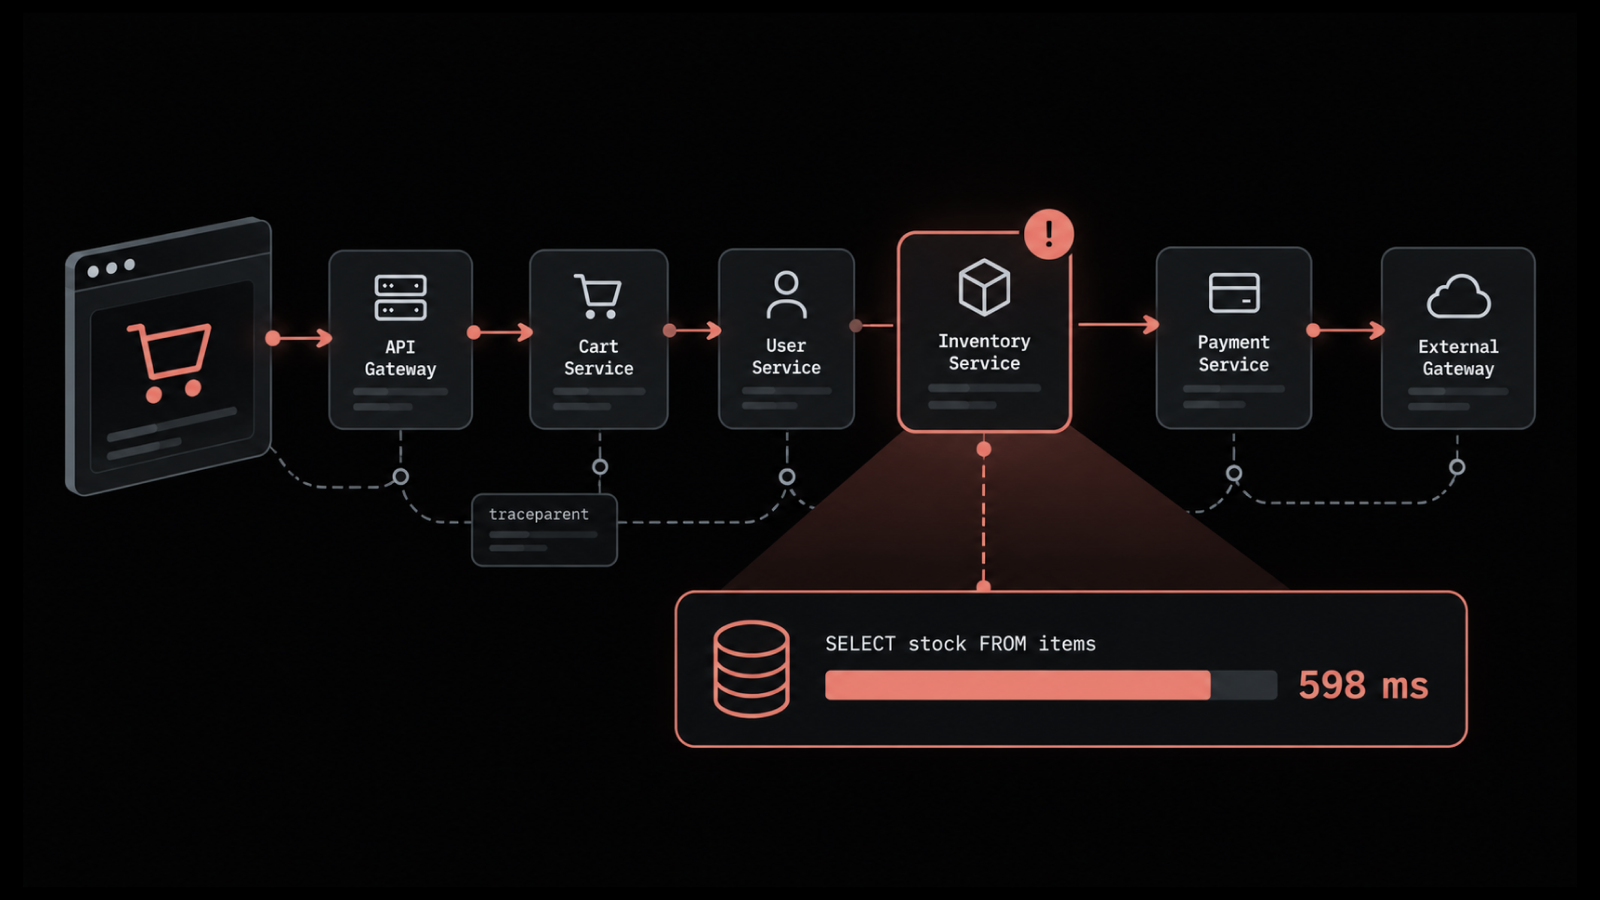
Some of what gets reported as network latency never touches the network. A database query taking 800 ms makes an application feel slow on a 4 ms link.
Splitting network delay from server delay is the most useful diagnostic move you have. We ask for both numbers before anything else.
6. Protocol Overhead
TCP pays for reliability with round trips. Connection setup costs a handshake, and adding TLS costs another one on top. Every unacknowledged window makes the sender wait.
On a long path this compounds, because throughput gets capped by the bandwidth-delay product rather than by your circuit size.
What Is Good Network Latency?
Good network latency depends on the application, so one universal target is useless. Voice and trading traffic need single or low double digits.
A file sync barely notices 200 ms. The table below sets out the ranges worth holding your own paths to.
Application type | Target | Still workable | Users complain above |
VoIP and video conferencing | Under 20 ms | Up to 150 ms one way | 150 ms |
Competitive online gaming | Under 30 ms | Up to 50 ms | 100 ms |
Interactive business apps (ERP, VDI) | Under 50 ms | Up to 100 ms | 150 ms |
Web browsing and SaaS | Under 100 ms | Up to 300 ms | 300 ms |
Financial trading, telerobotics | Under 5 ms | Up to 20 ms | 20 ms |
Backup and bulk transfer | Latency barely matters | Throughput is the constraint | Not applicable |
Only the voice numbers come from a standards body. ITU-T G.114 puts 150 ms of one-way delay as the upper limit for most user applications.
The same recommendation treats anything past 400 ms as unacceptable. Everything else in that table is operating convention.
We treat the voice row as the hard limit and the rest as guidance we tighten per site. A trading floor and a warehouse office do not deserve the same threshold. Start from the table, then adjust against what your own users report.
Why Your Average Latency Number Hides the Problem
Chasing a lower average latency is the most common way teams waste a quarter. Users never experience your average. What they feel are the slow requests sitting in the tail, and an average is built to hide exactly those.
Take a path handling 10,000 requests an hour. Say 9,700 land at 20 ms and 300 land at 400 ms. The average reads about 31 ms and looks healthy. Those 300 requests are the ones generating tickets.
Two numbers close that blind spot. The first is a percentile, because p99 latency tells you what your worst one percent of traffic experienced.
The second is jitter, the variation between consecutive packets, which breaks real-time audio faster than steady delay ever does.
I would rather run a path that sits steadily at 60 ms than one averaging 25 ms and swinging between 8 ms and 300 ms. The steady path sounds fine on a call. The swinging one produces the robot voice everybody recognises. No average will show you why.
So set your alert thresholds on a percentile and on jitter. Keep the average as context. We pair latency with packet loss and bandwidth utilisation on a single timeline, because the correlation disappears the moment you read those three in separate views.
Network Latency vs Bandwidth, Throughput, and Jitter
Latency, bandwidth, throughput, and jitter get used interchangeably, and they measure different things. Confusing them leads to the classic mistake of buying more bandwidth to fix a delay problem, which never works.
Metric | What it measures | Unit | What fixes it |
Latency | Delay for data to cross the network | Milliseconds | Shorter path, fewer hops, traffic priority |
Bandwidth | Maximum capacity of the link | Bits per second | Provision more capacity |
Throughput | Data that actually arrives per second | Bits per second | Fix loss, tune TCP window sizes |
Jitter | Variation in latency between packets | Milliseconds | Stabilise queuing, apply QoS |
Packet loss | Share of packets that never arrive | Percentage | Fix congestion, errors, failing hardware |
Here is a useful way to hold the difference. Bandwidth is how wide the pipe is. Latency is how long the water takes to arrive. Widening a pipe does nothing for a long journey.
The network jitter vs latency distinction matters most on voice and video. Latency sets how long the delay is, and jitter sets how much that delay wobbles. A call survives steady delay and falls apart on wobble.
Latency, jitter, and packet loss also feed each other. Loss forces TCP retransmissions, which adds delay. Added delay under congestion increases variation.
That loop explains why a link showing 2 percent loss often reports climbing latency too. Fixing the loss frequently fixes both.
How Do You Measure Network Latency?
You measure network latency four ways, and each answers a different question. Knowing how to measure network latency properly means running more than one of them. Most stalled investigations stopped after the first.
1. Ping for a Single Round-Trip Reading
Ping sends an ICMP echo request and reports the round-trip time. You can check network latency in seconds from any terminal this way.
Run it against a destination for an immediate reading, plus loss across the sample. A network latency test this cheap should start every investigation.
2. Traceroute and MTR for the Path
Traceroute lists each hop and the delay to it, so you can see where time accumulates. MTR combines traceroute with continuous ping. It reports loss per hop, which matters far more during an intermittent fault.
3. The Ping Trap Nobody Warns You About
Most teams misread their own traceroute output, and ICMP is the reason. Routers handle ICMP on the control plane, and many deprioritise or rate-limit it deliberately.
A middle hop can therefore report 120 ms while traffic passing through it experiences 4 ms.
Read the destination hop, not the middle ones. A middle hop showing high latency only matters if every hop after it does too.
Numbers that rise and then recover further down the path are an artefact of how one router treats ICMP. We have watched teams lose two days to exactly that.
4. RTT and TTFB From the Application Side
Round-trip time gives you the network component. Time to first byte gives you network delay plus server processing.
The difference between them isolates how much of the wait belongs to the application. Measuring both settles the argument between the network team and the application team.
One-way delay deserves its own measurement. The IETF defines it separately from RTT in RFC 7679, because internet paths are frequently asymmetric. Halve your RTT and the result may exist nowhere on your network.
5. Continuous Monitoring for Everything Else
Spot checks find a problem happening right now. They cannot tell you whether Tuesday was worse than Monday, and they will miss a spike that lasted 40 seconds at 03:00.
Network latency monitoring on a schedule catches those, because it keeps the history a spot check throws away.
A monitoring platform earns its place at exactly this point. Motadata ObserveOps reports latency as a floating-point value, including sub-millisecond readings such as 0.25 ms.
It pairs those metrics with flow data and logs, so a spike gets traced to congestion rather than guessed at. Its MotaAgent polls as fast as every second. SNMP trap monitoring catches the events that land between polls.
How to Reduce Network Latency
Reducing network latency works best in a fixed order. The early items remove far more milliseconds per hour of effort. We order our own fix list this way, because the top three usually settle it.
1. Shorten the Physical Path
Move the workload closer to the people using it. Hosting in the same region as your users removes propagation delay permanently.
Traffic growth cannot undo that gain, which sets it apart from everything else on this list. Moving from a US region to an Indian region for Indian users routinely cuts 150 ms to under 30 ms.
2. Cut Hops and Route Directly
Every hop you remove takes its processing and queuing delay with it. A direct interconnect to your cloud provider skips the public internet. Subnetting endpoints that talk constantly keeps that traffic off the core.
3. Fix Congestion Before Buying Capacity
Find what is filling the link before you widen it. Network traffic analysis usually shows one or two conversations taking a disproportionate share. Moving a backup window is cheaper than a circuit upgrade.
ObserveOps reads NetFlow, sFlow, jFlow, and IPFIX. The Sankey diagram it renders makes the heavy talkers obvious at a glance.
4. Apply QoS to the Traffic That Feels Delay
Give voice and video strict priority so they skip the queue during congestion. QoS does not reduce total latency on the link. It moves the delay onto traffic that tolerates it, such as a file sync.
Of the eight fixes here, QoS is the one we get asked about most and it helps least on its own.
5. Right-Size Your Buffers
Oversized buffers cause bufferbloat. Packets sit in a queue instead of being dropped, so latency climbs while loss stays at zero. I find this one gets missed more than any other cause, precisely because the loss counter stays clean.
Undersized buffers drop traffic that would have been fine. Modern queue management is worth enabling wherever interactive and bulk traffic share a link.
6. Tune TCP for Long Paths
On a long path, throughput gets limited by how much data can be unacknowledged at once. Window scaling and selective acknowledgements let more data stay in flight, which recovers throughput without changing latency at all.
7. Cache and Distribute Content
A CDN serves static content from a point of presence near the user, so that request never crosses the long path. Dynamic application traffic gets no benefit at all, so a CDN alone rarely fixes an ERP complaint.
8. Upgrade the Slow Links and the Tired Hardware
Replace copper with fibre on segments carrying latency-sensitive traffic. Move fixed devices off Wi-Fi. A switch running at 95 percent CPU adds queuing delay that no configuration change will remove.
How to Troubleshoot a Latency Spike
Troubleshooting network latency needs a fixed sequence. The tempting move (restarting things) destroys the evidence. Work through these six steps in order, and take a reading at each one before you change anything.
Compare against baseline: Establish what the path normally does before calling the current number abnormal. A path that always runs at 70 ms is not the incident.
Split network from server: Ping the destination and compare that reading with application response time. A 6 ms ping next to a 3-second page load points at the application.
Walk the path: Run MTR and read the destination hop first. Look for the point where latency rises and stays risen through every later hop.
Check utilisation on the suspect segment: Pull interface counters and flow data for the link. Latency that tracks a utilisation curve is congestion, and congestion needs capacity or priority rather than a hardware swap.
Check for loss and errors: Rising interface errors, CRC failures, or a duplex mismatch produce retransmissions that read as latency. A surprising number of long investigations end right here.
Establish who owns the segment: Work out whether the delay sits inside your estate, at your ISP, or inside a provider you cannot see into.
That last step decides how the rest of your day goes. Inside your own estate you can act. Past your edge you can only collect evidence.
A provider moves faster on timestamped MTR output from several locations than on a report that things feel slow. In our incident reviews, most of the wasted hours trace back to step six.
Standards help you frame that conversation. ITU-T Recommendation Y.1541 defines network performance classes for IP services. Class 0 caps IP transfer delay at 100 ms and delay variation at 50 ms.
Those figures give you a published reference to quote rather than an opinion. Our evidence, walks the wider fault tree if the cause turns out to be something other than delay.
When Do You Need a Network Latency Monitoring Tool?
You need a dedicated tool once your network outgrows what a terminal session can tell you. If you run a single site with a dozen switches, you are well covered by ping, MTR, and interface counters.
Network latency troubleshooting at that scale rarely needs more, and a full observability platform is more than the problem deserves.
Continuous measurement pays for itself once you have several sites, paths you do not own, or an SLA someone will argue about.
Multi-site deployment earns its keep there, putting Collectors at each branch so every site measures its own latency instead of inheriting the head office view. It does mean deploying those Collectors and agents rather than switching on a feature.
Make Network Latency a Number Your Team Can Act On
Network latency work pays off when you stop treating it as one number. Measure the percentile and the variation on every path that carries traffic people care about. Set the target from the application rather than from a generic benchmark.
Some of it you will never fix. Physics sets a floor you cannot argue with. Once traffic leaves your edge, you own the evidence and somebody else owns the router.
What you get back is time. Teams that baseline properly stop rebuilding healthy links. They hand providers proof instead of complaints.
We have yet to watch a team regret the move from averages to percentiles, and the reclaimed hours go straight back into work that changes something.
FAQs
Is latency the same as ping?
Latency and ping are not the same thing. Latency is the delay itself, measured in milliseconds. Ping is the utility that sends an ICMP echo request to measure it. People use the words interchangeably, but one is the reading and the other is the ruler.
How often should you measure network latency?
Measure continuously on the paths that carry critical traffic. A test every five minutes misses short spikes that still break calls. MotaAgent in ObserveOps polls as fast as every second, and SNMP traps report events that fall between polls.
Does a VPN increase network latency?
Usually yes, by a few milliseconds to a few tens. The tunnel adds an encryption step and often routes traffic through a concentrator that sits off the direct path. Split tunnelling removes that penalty for traffic that does not need the tunnel.
Is 40 to 60 ms latency bad?
For web browsing, SaaS, and most business applications, 40 to 60 ms is fine. VoIP will work at that range but no longer feels comfortable. Competitive gaming and trading need much less. Judge the number against the application that runs on it.
What is the difference between latency and response time?
Latency covers the network delay only. Response time covers the whole wait a user feels, including server processing, database queries, and browser rendering. A fast network can still sit behind a slow response time when the application is the bottleneck.
Author
Ramya Shah
Technical Writer
Ramya Shah is a technical content writer with a computer engineering background and roots in automotive journalism. He covers IT Service Management, observability, IT operations, and AI-driven automation. An early adopter of AI-assisted writing workflows, he turns complex IT processes into clear, engaging content optimized for search and answer engines (AEO), lifting content output and organic visibility.