OBSERVEOPS
Application Performance Monitoring
From traces to transactions, from latency to load, assuring performance, continuity, and clarity across every application you run.
Motadata ObserveOps APM provides deep, end-to-end visibility into the behavior of your distributed applications. Trace every request, visualize dependencies, uncover bottlenecks, and correlate everything with infrastructure and logs — powered by AI intelligence and OpenTelemetry-native instrumentation.
Core Features
Built for Precision, Performance, and Continuity
Application performance monitoring that transforms traces, transactions, and telemetry into actionable intelligence — giving you complete control over how your applications perform and scale.
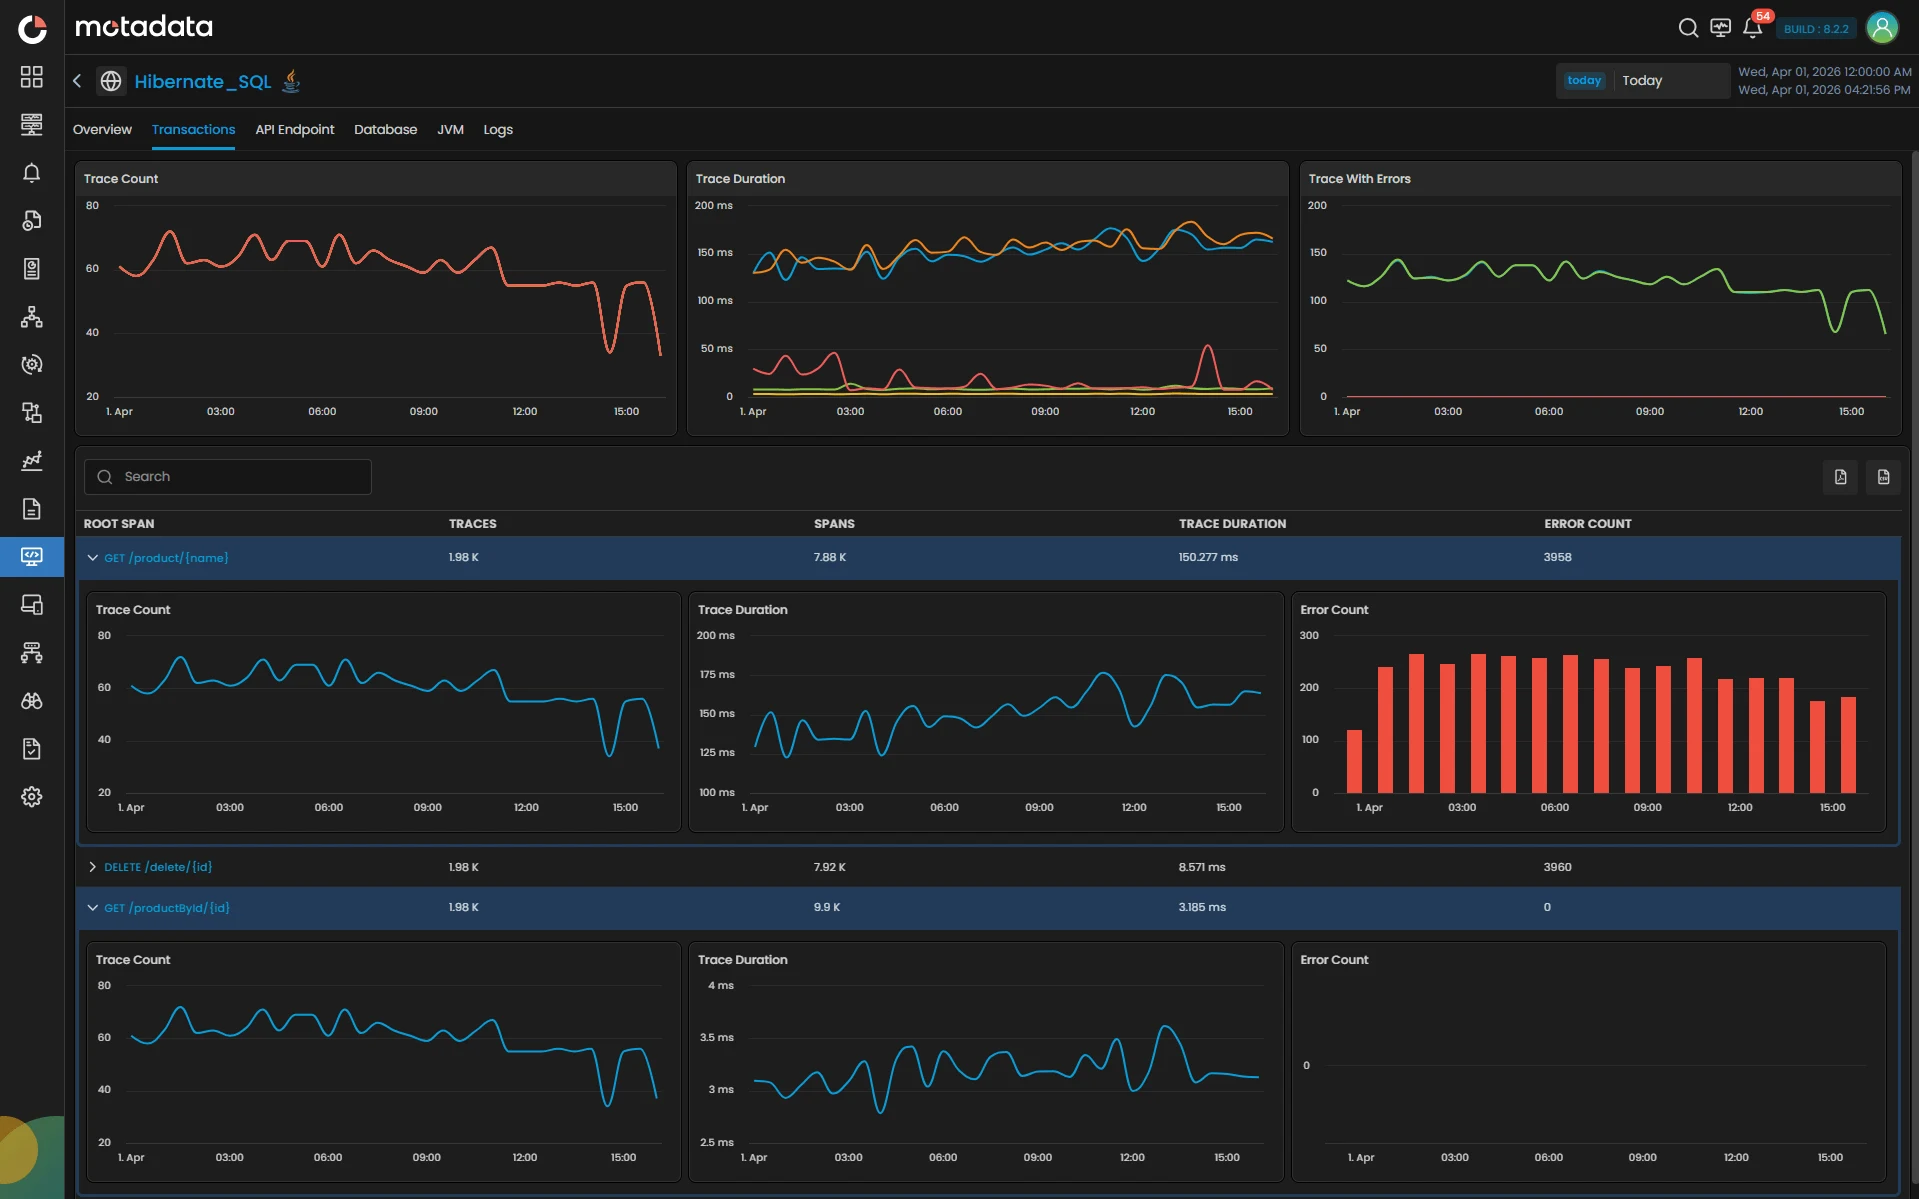
End-to-End Transaction Visibility
Trace every request across services, environments, and dependencies to understand how applications behave in real time.
Deep Code-Level Insight
Identify performance bottlenecks, slow methods, and inefficient execution paths directly within application code.
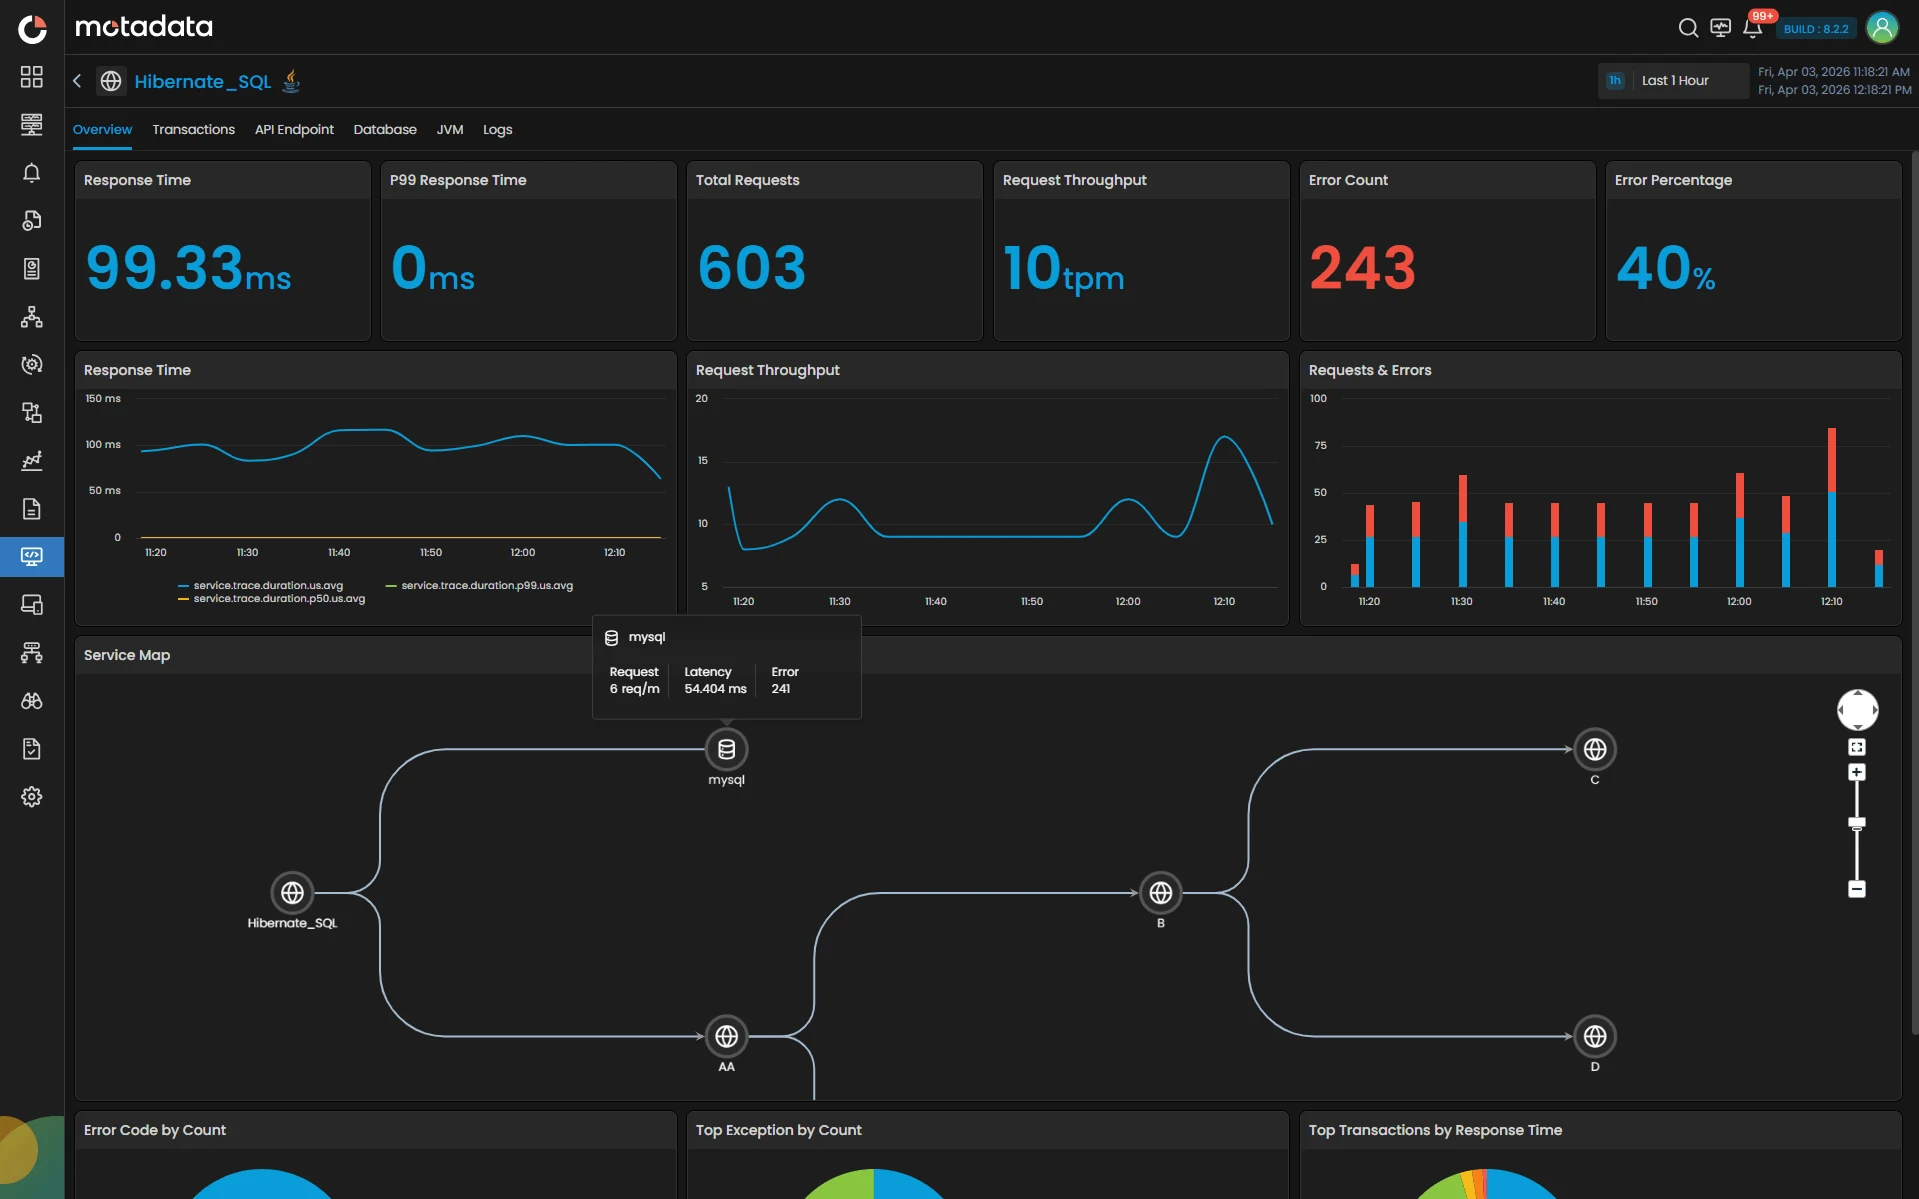
Service Dependency Clarity
Visualize how services interact across distributed architectures to quickly isolate impact and prevent cascading failures.
Performance Intelligence at Scale
Track response time, throughput, and error rates across applications with precision and consistency.
Error & Exception Transparency
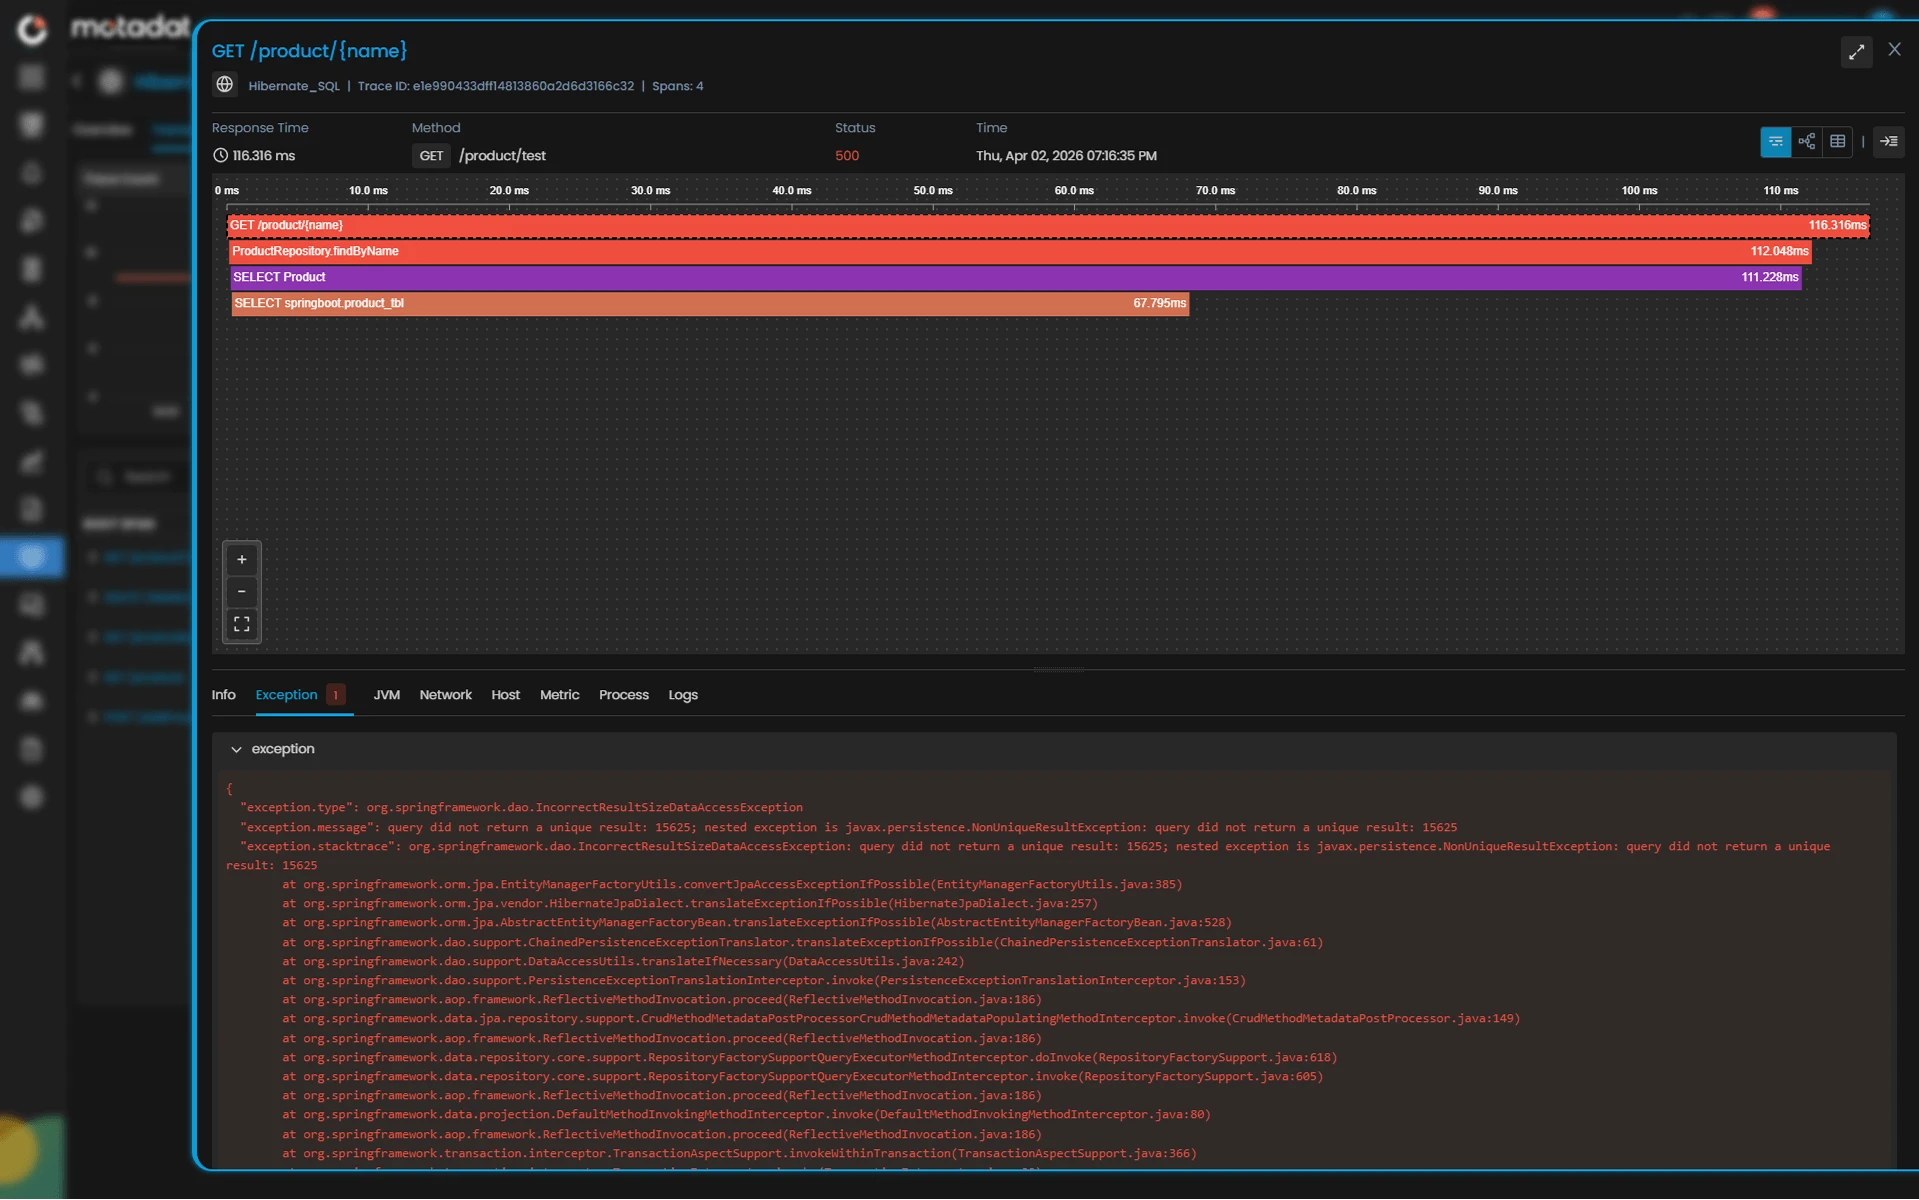
Detect, group, and analyze failures with full context to accelerate root cause identification and resolution.
Unified Correlation Across the Stack
Connect application performance with infrastructure, logs, databases, and network signals for complete operational context.
Every Trace. Every Transaction. Complete Performance Clarity.
Capabilities
APM Capabilities
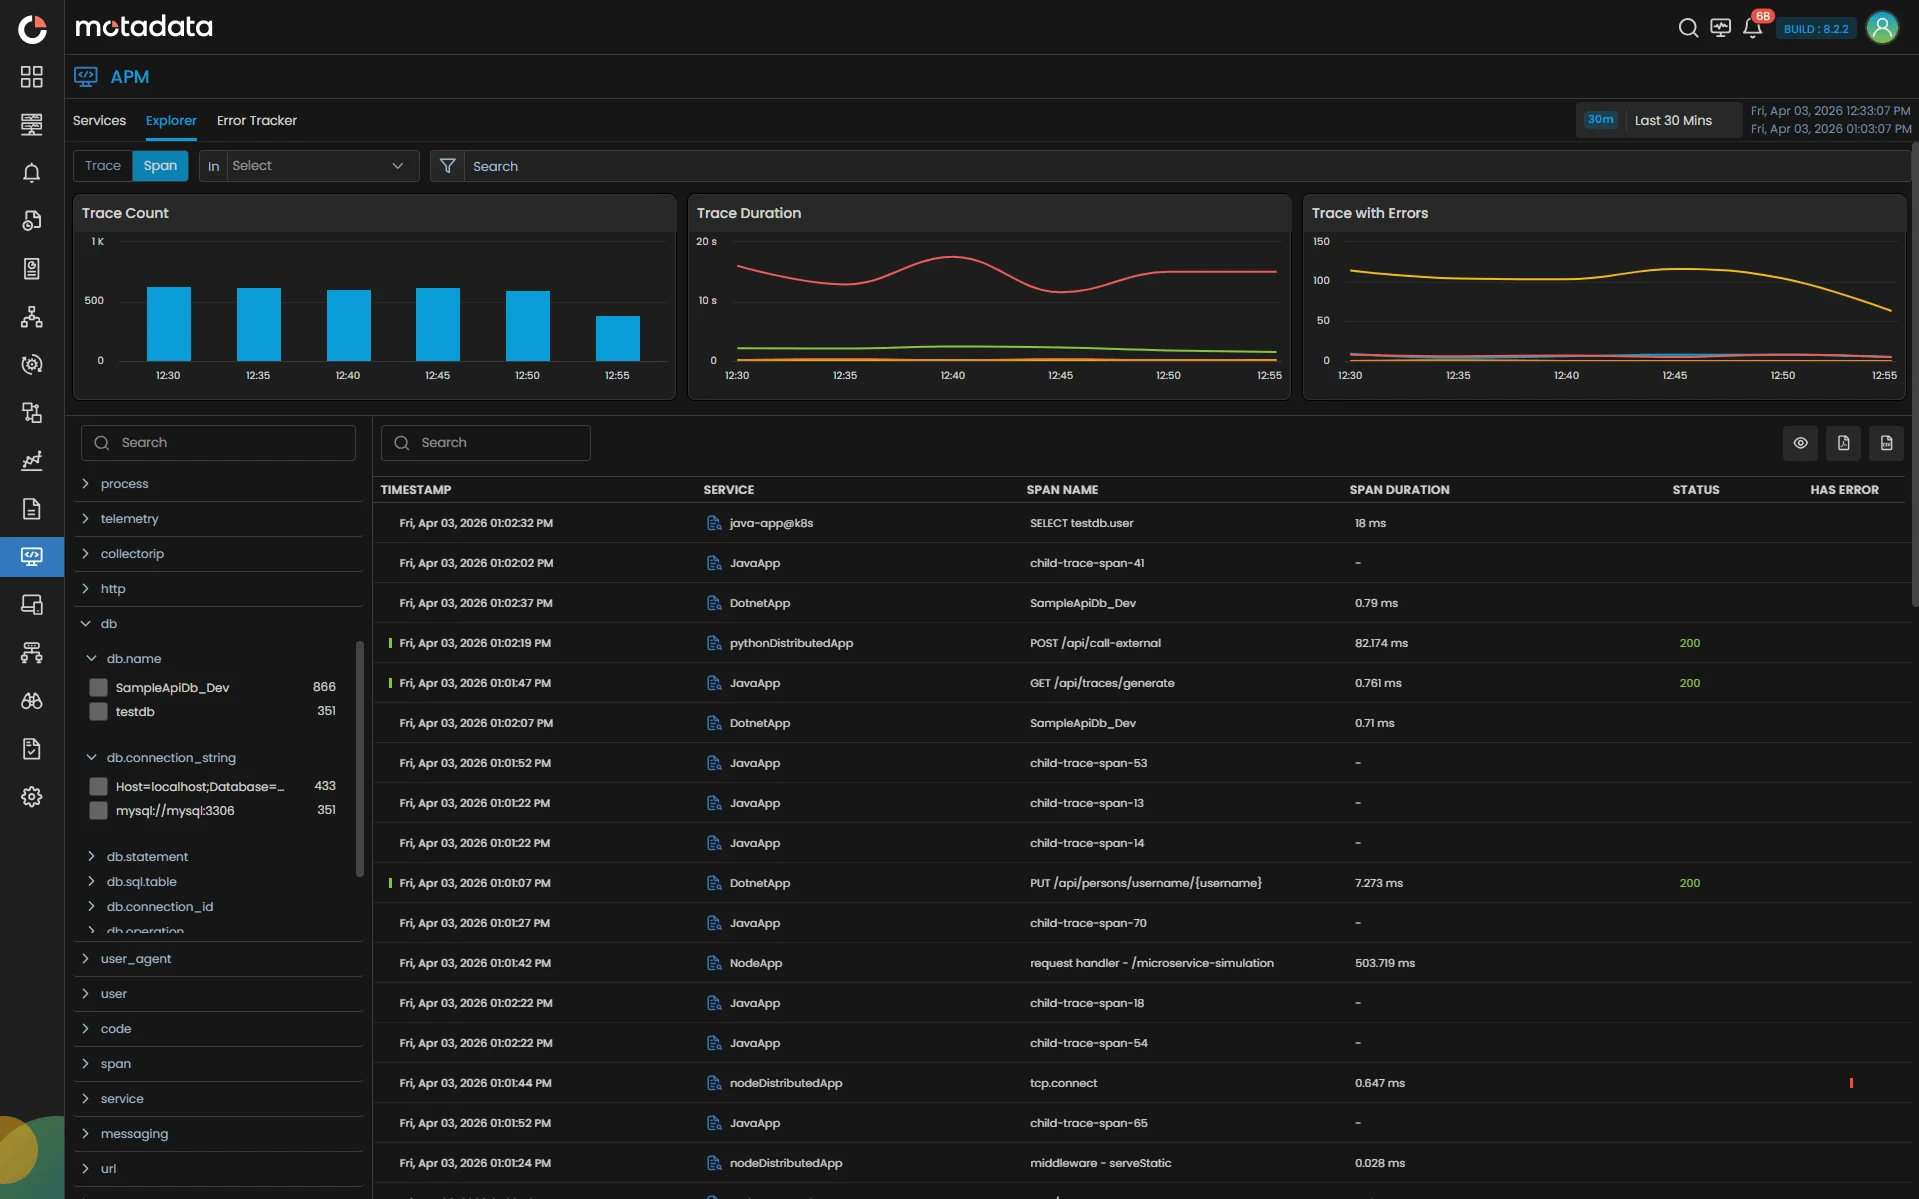
Complete APM
Get full-fidelity distributed traces across microservices, monoliths, containers, and cloud-native applications, revealing delays, dependencies, and code-level hotspots instantly.
Key Highlights
OpenTelemetry-Based Tracing: Distributed tracing across Java, .NET, PHP, Node.js, and Python applications.
Deployment Coverage: Monolithic, Docker, and Kubernetes deployments.
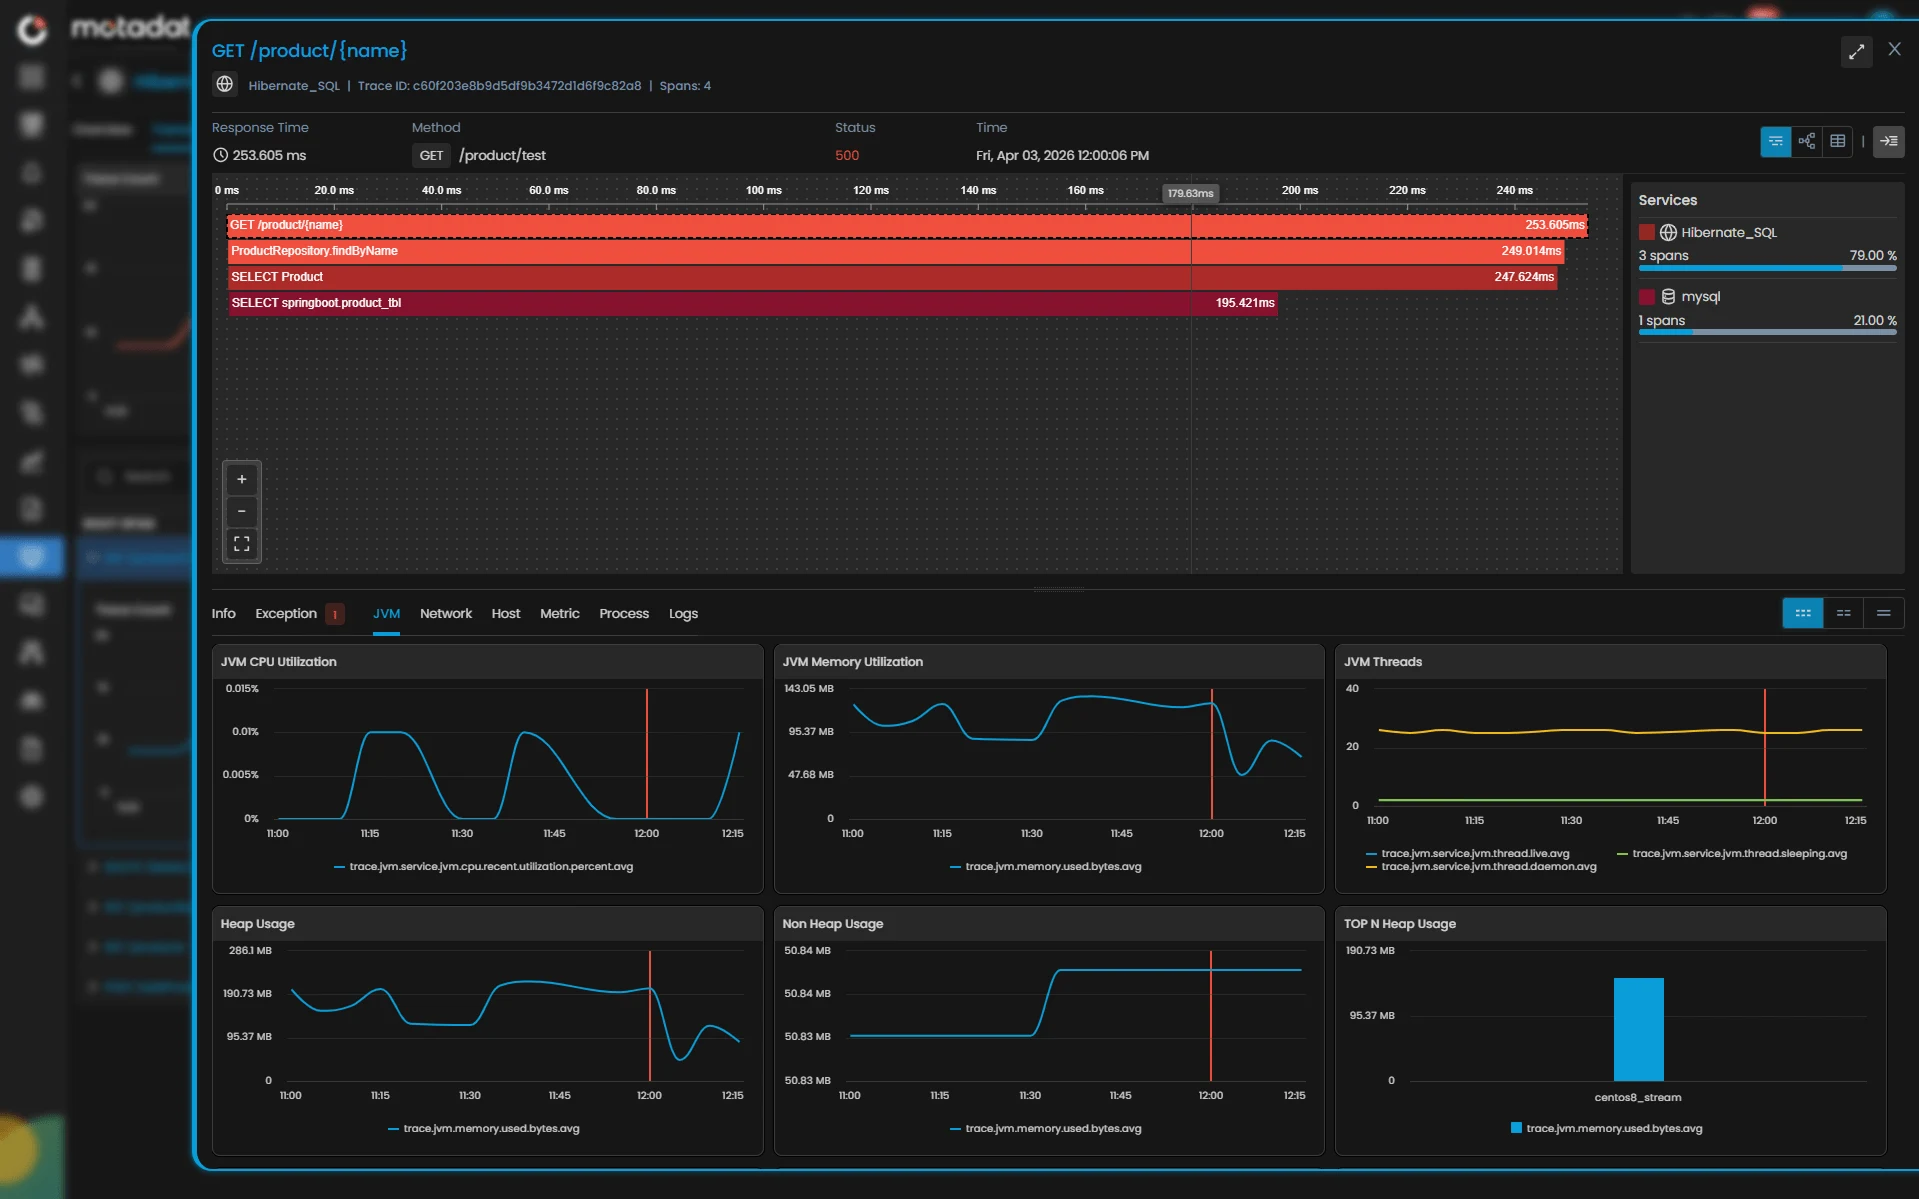
Code-Level Visibility: Slow methods, hot paths, exceptions, and execution bottlenecks identified directly within application code
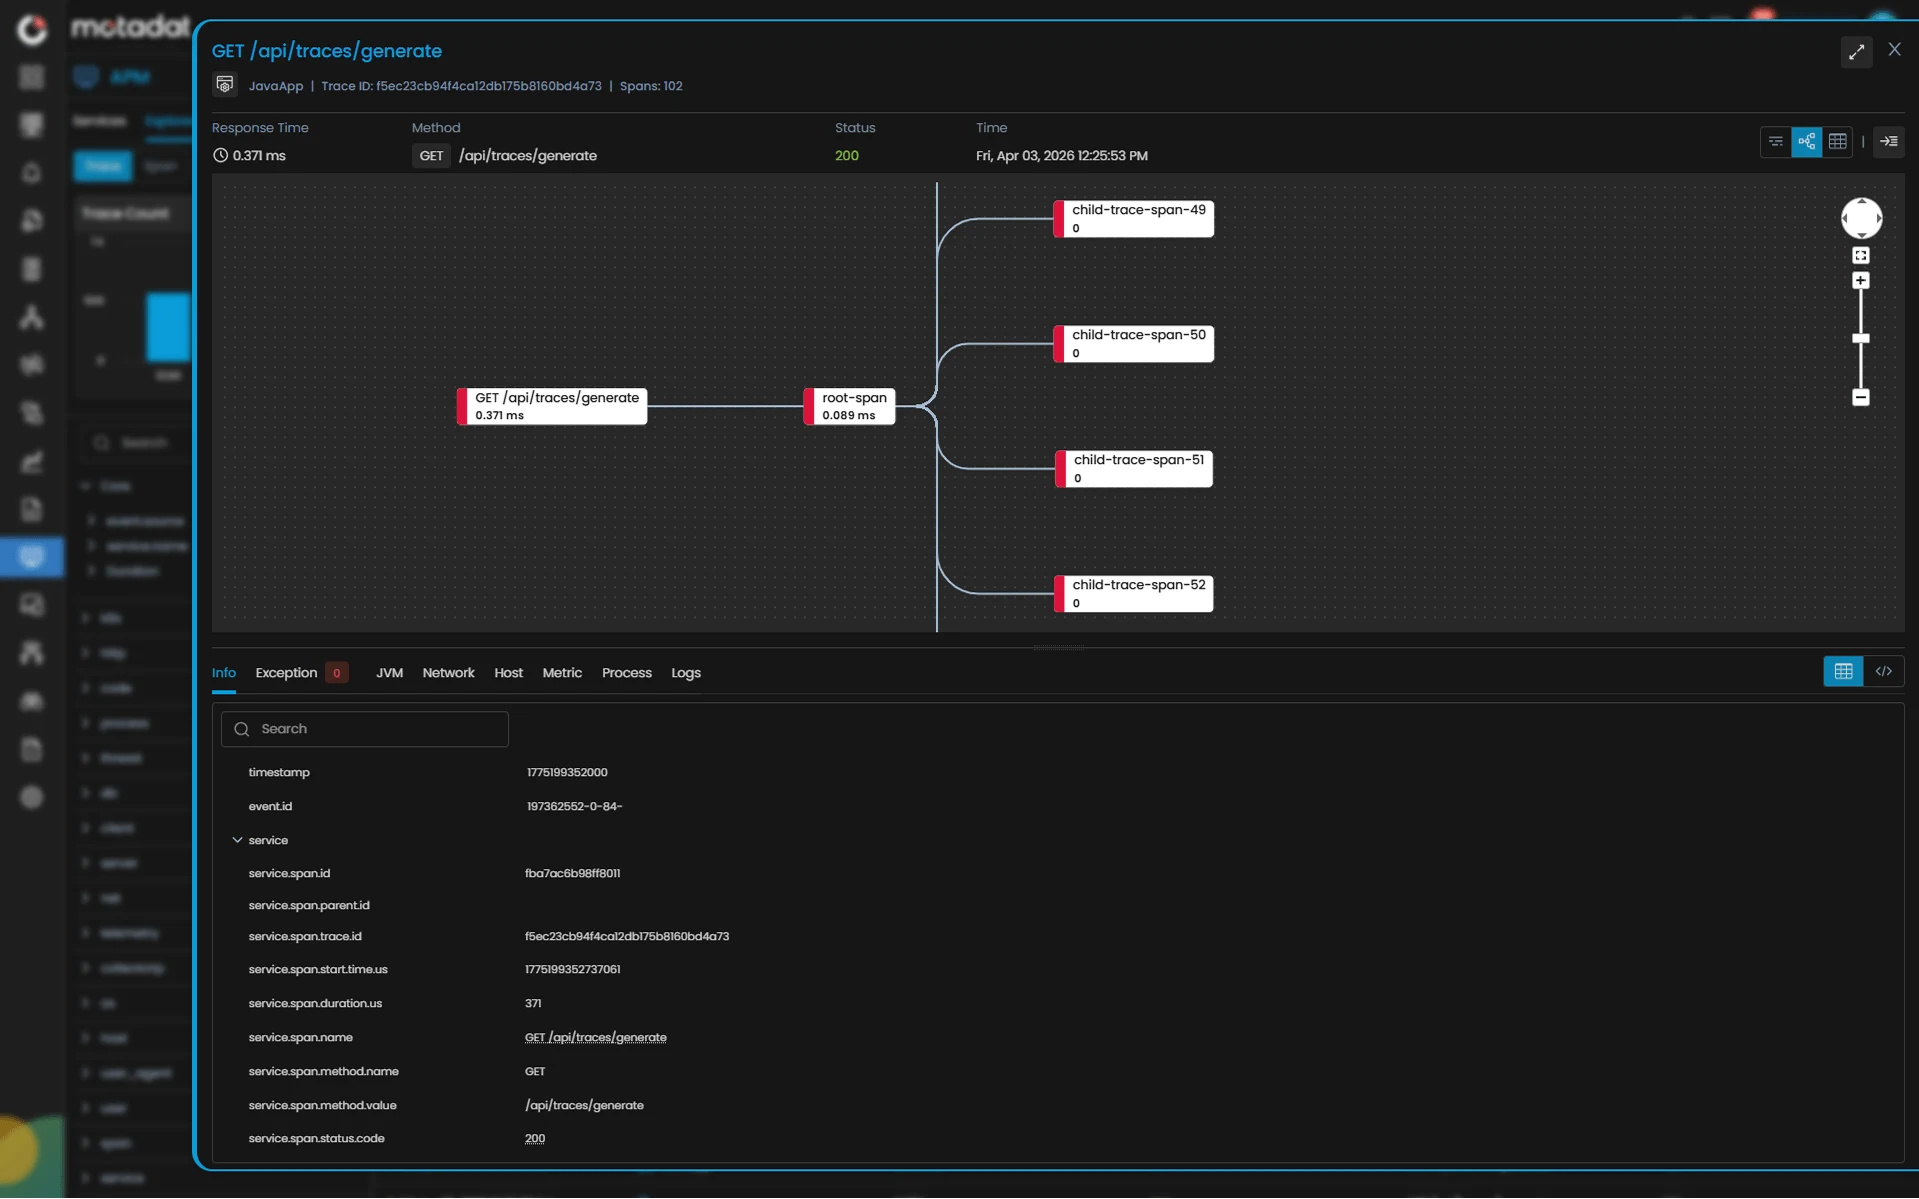
Trace Analytics: Span and trace analytics with flame charts for deep performance exploration.
Cross-Layer Correlation: Logs, host metrics, and JVM behavior linked to traces for faster root cause analysis.
Every Request Traced. Every Line Understood.
Metrics & Differentiation
0%
faster incident resolution with correlated traces, logs and metrics.
0%
reduction in performance-related escalations through proactive detection.
0%
performance adherence across business-critical applications.
OpenTelemetry-native instrumentation
ensuring future-proof, vendor-agnostic observability.
Motastore-powered analytics
for high-speed trace ingestion and query performance.
AI-driven anomaly detection
that surfaces issues before they hit user experience.
Full cross-domain correlation
linking APM with logs, network and infrastructure insights.
Built for hybrid and cloud-native
architectures at enterprise scale.
Enterprise Ready
Full-Stack Performance Intelligence for High-Velocity Enterprises
From distributed traces to digital transactions, from code hotspots to service latency — delivering the visibility, intelligence, and control required to run modern applications at enterprise scale.
Deep Distributed Intelligence for Complex Architectures
Enterprises run hybrid applications that span monoliths, microservices, containers, and cloud-native platforms. Motadata provides OpenTelemetry-native tracing, code-level analytics, flame graphs, span correlation, and dependency maps that reveal exactly how applications behave across distributed topologies. This empowers SREs and engineering leaders to diagnose performance degradation with precision instead of guesswork.
Enterprises run hybrid applications that span monoliths, microservices, containers, and cloud-native platforms. Motadata provides OpenTelemetry-native tracing, code-level analytics, flame graphs, span correlation, and dependency maps that reveal exactly how applications behave across distributed topologies. This empowers SREs and engineering leaders to diagnose performance degradation with precision instead of guesswork.
Predictive Performance & User Experience Assurance
Application performance software impacts revenue, retention, and digital trust. Motadata uses AI baselines, dynamic thresholds, scatter-plot latency analysis, and anomaly forecasting to identify bottlenecks before they impact customers. IT Directors gain the foresight to prevent slowdowns; digital teams protect the quality of every user interaction.
Application performance software impacts revenue, retention, and digital trust. Motadata uses AI baselines, dynamic thresholds, scatter-plot latency analysis, and anomaly forecasting to identify bottlenecks before they impact customers. IT Directors gain the foresight to prevent slowdowns; digital teams protect the quality of every user interaction.
Vendor-Neutral Observability from Code to Cloud
Today’s enterprise applications incorporate diverse languages, runtimes, clouds, databases, and orchestration layers. Motadata provides wide-tech compatibility across Java, .NET, PHP, Node.js, Python, Kubernetes, Docker, and multi-cloud infrastructure. This future-proofs enterprise modernization journeys and supports continuous innovation.
Today’s enterprise applications incorporate diverse languages, runtimes, clouds, databases, and orchestration layers. Motadata provides wide-tech compatibility across Java, .NET, PHP, Node.js, Python, Kubernetes, Docker, and multi-cloud infrastructure. This future-proofs enterprise modernization journeys and supports continuous innovation.
Unified Correlation for Faster, Confident Root Cause Analysis
Enterprises need answers, not data fragments. Motadata correlates APM signals with logs, host metrics, JVM analytics, DB KPIs, network flow, and infrastructure telemetry in real time, creating a single, contextual root-cause narrative. This reduces MTTR dramatically and transforms war rooms into focused, resolution-driven collaborations.
Enterprises need answers, not data fragments. Motadata correlates APM signals with logs, host metrics, JVM analytics, DB KPIs, network flow, and infrastructure telemetry in real time, creating a single, contextual root-cause narrative. This reduces MTTR dramatically and transforms war rooms into focused, resolution-driven collaborations.
Industry Solutions
Industry-Proven Infrastructure Solutions
Tailored for Your Infrastructure Challenges
BFSI
Guarantee real-time visibility across trading, core banking, and digital payments — ensuring compliance, security, and always-on service.
Telecom
Monitor multi-gigabit networks, correlate NetFlow data with subscriber QoE, and prevent outages before they scale.
Healthcare
Safeguard critical patient systems and comply with HIPAA through secure, low-latency observability.
Government & Public Sector
Achieve transparency, security, and control with on-premise observability supporting strict data sovereignty.
Manufacturing
Integrate IT and OT data to prevent production downtime and improve predictive maintenance accuracy.
Retail & eCommerce
Deliver frictionless digital experiences, monitor transactions in real time, and optimize site reliability at global scale.
ObserveOps Platform
Continue Your ObserveOps Journey
Unify every signal. Correlate every insight. Perform without compromise.
Network Observability
Unite flows, packets, and paths into real-time clarity with intelligent alerting at scale.
Network Configuration & Compliance Management
Automated config backups, compliance checks, and drift detection across your network.
Hybrid Infrastructure Monitoring
Monitor on-premise, cloud, and hybrid environments with unified visibility, AI-driven alerts, and real-time insights.
Real User Monitoring
Capture every click and page load with web vitals, experience scores, and session replay.
Log Monitoring
Cut through endless logs to reveal root cause with search, correlation, and analytics.
Application Performance Monitoring
Trace every transaction from frontend to backend with distributed tracing and service mapping.
FAQ
Frequently Asked Questions
Find answers to common questions about Infrastructure Monitoring and our capabilities.
Application Performance Monitoring (APM) is the practice of tracking, measuring, and analyzing the performance of software applications in real time — covering response times, error rates, throughput, transaction traces, and service dependencies. For modern enterprises running distributed, cloud-native, or hybrid applications, APM is essential to detect performance degradation early, resolve incidents faster, and ensure every user interaction meets expected service levels. Without APM, teams operate reactively, discovering issues only after users are already impacted.