What is an Apdex Score?
An Apdex score (Application Performance Index) is a single number from 0 to 1 that shows how satisfied users are with how fast your application responds.
It takes every recorded response time and collapses it into one figure a team can track, alert on, and report against an SLA, instead of reading through raw response time logs one by one.
Apdex is an open standard maintained by the Apdex Alliance, not a proprietary metric owned by one vendor.
Most APM tools calculate it the same way, so a score means roughly the same thing regardless of which monitoring platform produced it.
How Does an Apdex Score Work?
Every Apdex score starts with a threshold, written as T, which is the response time an organization considers acceptable for a given transaction.
2 different entities like a checkout page and a search bar can each have their own T.
Every recorded response time then falls into one of three zones, measured against that threshold.
Satisfied: the response time is at or below T. The user gets a fast, smooth experience.
Tolerating: the response time is above T but at or below 4 times T. The user notices the lag but stays on the page.
Frustrated: the response time is above 4 times T, or the request fails outright. The user is likely to abandon the task.
The score is calculated using the formula below.
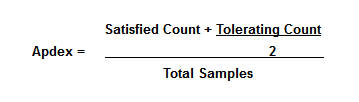
Let’s apply that formula to a checkout page with T set at 300 milliseconds and 500 requests measured:
400 requests finish within 300 ms (satisfied).
60 requests land between 300 ms and 1,200 ms, four times T (tolerating).
40 requests take longer than 1,200 ms or fail outright (frustrated).
That works out to (400 + 30) / 500, or 0.86.
What Are the Industry Standards for a Good Apdex Score?
The Apdex standard defines five rating bands on the 0 to 1 scale, and most APM tools use these same cutoffs.
Score Range | Rating |
0.94 to 1.00 | Excellent |
0.85 to 0.93 | Good |
0.70 to 0.84 | Fair |
0.50 to 0.69 | Poor |
Below 0.50 | Unacceptable |
Most organizations aim to keep production applications in the Good to Excellent range.
A score under 0.50 is a strong signal that users are actively abandoning the application, not just noticing a slowdown.
Why Does Apdex Score Matter?
A score only earns its place on a dashboard if it changes what a team does next, and Apdex does that for a few concrete reasons.
1. It turns scattered metrics into one trackable number
A team monitoring dozens of transactions can watch one Apdex trend line instead of comparing raw response times across every endpoint.
2. It supports SLA reporting
Apdex gives teams a defensible way to show whether an SLA commitment on response time is actually being met, instead of relying on an average that one slow outlier can distort.
3. It flags real user pain, not just server load
A server can look healthy on CPU and memory while users are still stuck in the tolerating or frustrated zone, and Apdex catches that gap.
4. It replaces anecdote with data
Instead of waiting for a support ticket to say the app feels slow, a dropping Apdex score gives a team a measurable reason to investigate before complaints start.
How to Improve Apdex Score?
A low Apdex score is a symptom, and the fix usually comes down to a handful of recurring causes.
Optimize slow queries and code: inefficient database queries and unoptimized code are the most common cause of a dropping score, and usually the first place to look.
Cut unnecessary external calls: every third-party API call an application waits on adds latency outside its own control, so trimming and monitoring those calls through API monitoring pays off fast.
Serve static content from a CDN: routing images, scripts, and other static assets through a content delivery network cuts the distance data has to travel to reach a user.
Move heavy work off the main thread: asynchronous processing lets an application hand off slow tasks in the background instead of making the user wait on them directly.
Scale ahead of demand: a sudden traffic spike without enough server capacity is a fast way to push satisfied requests into the tolerating and frustrated zones.
Once a fix ships, tracing the transactions still landing in the frustrated zone through root cause analysis confirms whether the change actually moved the score or only helped on average.
A team that treats Apdex as a standing metric, checked every week rather than pulled up once during an incident, catches a slipping score before users start filing tickets about it.
Explore More IT Terms
Browse our comprehensive IT glossary to learn more about technology terminology.