10 Best Real User Monitoring Tools Compared for 2026
Most IT teams learn their application feels slow when a customer complains. Server metrics never measure what a person on a phone waits for.
The best real user monitoring tools close that gap by collecting timings from your users' browsers. Choosing one got harder this year, because the measurement standard moved.
In this blog, we compare the best tools for real user monitoring, including their pros, cons, and key features. By the end you will know which one fits your stack.
What Is Real User Monitoring?
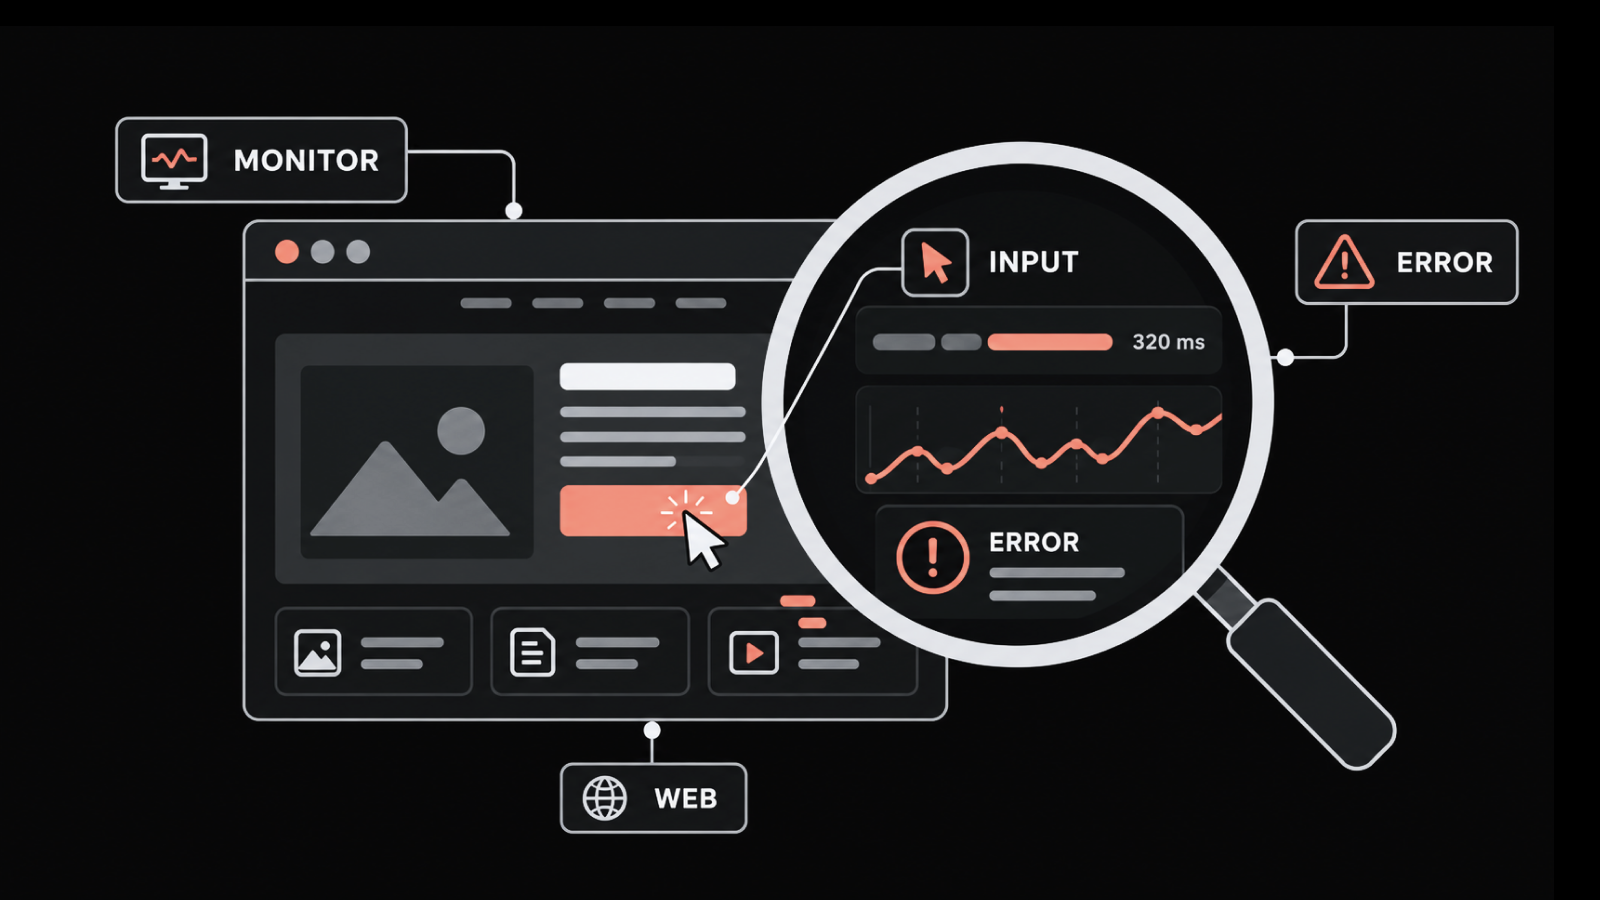
Real user monitoring is a passive technique that collects performance data from the browsers and devices of people using your application. A small JavaScript snippet records how long pages took to load, how fast the interface answered a click, which errors fired, and what the user did next.
The counterpart is synthetic testing, which runs scripted checks on a schedule from fixed locations. Teams tend to weigh RUM vs synthetic monitoring as an either-or call. Synthetic tells you something broke. RUM tells you who it hurt, on what device, and how badly.
Google grades three of those timings as Core Web Vitals, and it measures them at the 75th percentile of page loads. A good score means LCP inside 2.5 seconds, INP at or under 200 milliseconds, and CLS no higher than 0.1. Since these thresholds directly factor into Google's ranking algorithm, hitting them has become a baseline requirement in modern seo website development rather than an afterthought.
Because the data comes from real traffic, it catches the long tail that scripted tests never reach. We have watched a single regional ISP drag one country's numbers down while every synthetic check stayed green. Browser extensions jam forms, and one Android build can stall on one screen.
How We Evaluated These Tools
We shortlisted these the way an IT team does, not by counting features. Five things decided the ranking.
Metric depth: Does it capture the full Core Web Vitals set, including Interaction to Next Paint, and what debug detail sits behind each number?
Backend correlation: Does a slow page view link to the trace, log or host that caused it?
Coverage: Web only, or web plus native mobile?
Single-page app measurement: Are route changes measured, or only the first load?
Pricing transparency: Can a buyer estimate the bill before talking to sales?
One name you might expect is missing. AppDynamics now sits inside the Splunk Observability portfolio under Cisco, and a product mid-rebrand is a poor thing to sign a three-year contract against.
The 10 Best Real User Monitoring Tools Compared
The ten tools fall into five categories, and the table below groups them that way so you can rule out four categories quickly.
Tool | Category | Best For | Coverage | Backend Correlation | Starting Price |
Motadata ObserveOps | Unified observability | Frontend and infrastructure in one console | Web | Full stack, OTLP-native | Quote-based |
Datadog RUM | Unified observability | Cloud-native engineering teams | Web and mobile | Full stack | $1.50 per 1,000 sessions |
Dynatrace RUM | Unified observability | Large enterprises | Web and mobile | Full stack | Usage-metered |
New Relic Browser | Unified observability | Teams wanting one platform | Web and mobile | Full stack | Free tier, then $0.40/GB |
ManageEngine Site24x7 | Unified observability | Mid-market IT teams on a budget | Web and mobile | Full stack | $5 per 100,000 pageviews |
Sentry | Error and crash tracking | Developer and product teams | Web and mobile | Frontend to backend traces | Free, then $26/month |
Raygun RUM | Error and crash tracking | Lean teams needing crash reporting too | Web and mobile | Links to Raygun APM | $80/month annual |
DebugBear | Frontend specialist | Core Web Vitals and SEO work | Web | No | $125/month |
SolarWinds Pingdom | Website and uptime monitoring | Uptime and page speed on one bill | Web | No | $16.50/month annual |
Grafana Faro | Open source | OpenTelemetry teams avoiding lock-in | Web | Via Grafana Cloud or Tempo | Free to self-host |
The category column does most of the filtering. Unified observability platforms cost more and take longer to deploy, while the frontend and uptime tools are cheaper and faster but stop at the browser. The open-source entry trades license cost for engineering time.
Detailed Overview of the 10 Best Real User Monitoring Tools in 2026
Here is a closer look at each one, with the cons included.
1. Motadata ObserveOps
Best for: Teams that want browser timings sitting next to their network and infrastructure data.
Rating: 4.7/5 on G2, 4.6/5 on Gartner Peer Insights.
Pricing: We do not publish list pricing. Quotes are scoped to your deployment mode and the modules you need, and a free trial is available.
Our real user monitoring software grades each frontend metric against a documented threshold instead of leaving you a raw number. LCP at or under 2.5 seconds reads as good, and anything past 4.0 seconds reads as poor.
Collection is the easy half. A slow page load rarely stops at the frontend, and chasing it across three consoles costs more time than the fix usually does.
Star ratings only tell you so much, so it helps to hear from a team that runs ObserveOps every day.
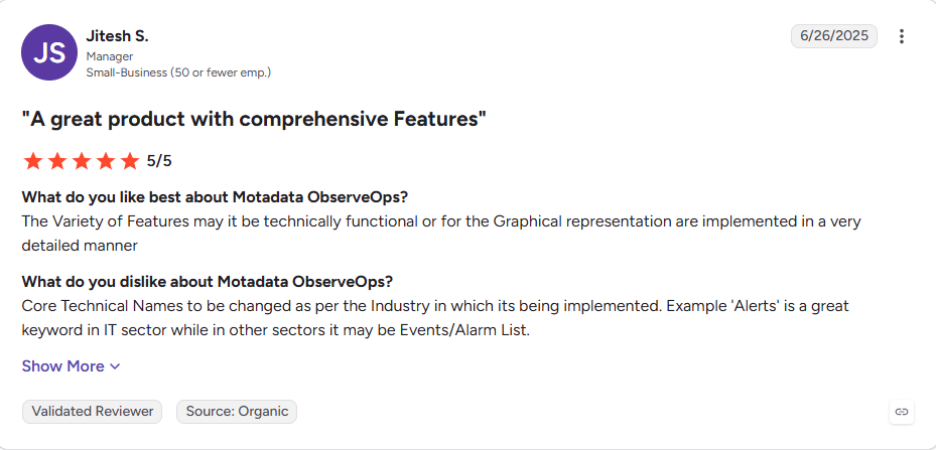
Read more ObserveOps reviews on G2.
Pros
- RUM, application performance monitoring, logs, flows, network and infrastructure share one platform and one data store.
- Six deployment modes cover on-premises, private cloud and public cloud, which regulated buyers usually need.
- DFIT, our deep learning framework, correlates across those signals rather than alerting on each in isolation.
- One quote covers the modules you deploy, so RUM, logs and traces do not each carry their own meter.
Cons
- There is no published price list, so you cannot size the cost from a web page.
- The documented RUM instrumentation covers web frameworks only, so native iOS and Android apps are not in scope.
- Our review footprint is smaller than the largest incumbents carry.
- A team monitoring one marketing site will not use most of the platform.
2. Datadog RUM
Best for: Cloud-native engineering teams already running Datadog.
Rating: 4.4/5 on G2, 4.6/5 on Gartner Peer Insights.
Pricing: Browser RUM starts at $1.50 per 1,000 sessions on an annual plan. RUM with Session Replay starts at $1.80 per 1,000 sessions.
Most comparison content puts Datadog first. Every session ties back to the traces and logs already flowing into the platform, so a JavaScript error can be followed to the line of code and the service that threw it.
None of that pays off unless Datadog already holds your backend data. Bolted onto a stack you monitor elsewhere, it becomes an expensive browser agent.
Pros
- The strongest frontend-to-backend correlation in the category.
- Coverage spans browser, native mobile and hybrid apps.
- The integration catalog is enormous, so it slots into most stacks.
Cons
- Session billing tracks traffic, so a viral week produces a bill nobody forecast. We see that volatility raised in nearly every Datadog pricing conversation.
- Onboarding asks you to install the agent, which throws teams who only wanted a browser snippet.
- RUM, session replay and product analytics meter separately, so the costs compound.
3. Dynatrace RUM
Best for: Large enterprises that need unsampled capture and automated root cause.
Rating: 4.5/5 on G2, 4.6/5 on Gartner Peer Insights.
Pricing: Usage-metered platform subscription. Full-stack monitoring runs $58 per month per 8 GiB host, with digital experience billed separately per session.
Unsampled capture sounds like a technical detail until a compliance team asks you to explain one named customer's experience at 14:32 last Tuesday.
You are buying an analysis engine here rather than a dashboard, and it prices like one. That suits a regulated enterprise and overwhelms a five-person team.
Pros
- Depth of analysis is hard to match at enterprise scale.
- Automatic baselining cuts alert noise sharply.
- Web and native mobile coverage are both strong.
Cons
- The licensing model takes real work to forecast.
- Small teams will pay for depth they never open.
- Deployment and tuning usually pull in the vendor or a partner.
4. New Relic Browser
Best for: Teams that want RUM inside one broader observability platform.
Rating: 4.4/5 on G2, 4.6/5 on Gartner Peer Insights.
Pricing: A free tier includes 100 GB of ingest a month, then $0.40 per GB. Full-platform users list at $549 per user per month, with core users at $49.
Sessions never enter New Relic's bill. Traffic spikes cost you nothing extra, and chatty instrumentation costs you plenty, so the bill tracks a number most of this list ignores.
Breadth is the pitch and also the limit. Everything lives under one login, and a team chasing a stubborn INP problem will still want a specialist beside it.
Pros
- The free tier is generous enough for a real team to run on.
- Ingest-based billing often beats per-session billing at high traffic.
- One platform covers browser, mobile, infrastructure and logs.
Cons
- The interface is dense, and finding a specific view takes practice.
- Core Web Vitals detail is shallower than a dedicated frontend tool gives you.
- User-based charges climb as the team grows, which is the usual sticking point once headcount moves.
5. ManageEngine Site24x7
Best for: Mid-market IT teams that want RUM inside an affordable all-in-one platform.
Rating: 4.6/5 on G2.
Pricing: RUM is priced per pageview from $5 per 100,000 pageviews a month, added to a base plan. The Web Perf plan runs $36 a month billed annually and includes 100,000 pageviews. A free tier and a 30-day trial are both available.
Site24x7 gives you more RUM than its price suggests. Core Web Vitals, Apdex scoring, JavaScript errors, session replay and mobile crash reporting all ship in the product rather than behind an upgrade.
ManageEngine sells this to mid-market IT teams rather than to frontend engineers, and the product shows it. You get breadth across the stack and less depth inside the browser.
Pros
- RUM, APM, infrastructure and network monitoring arrive on a single bill.
- Per-pageview pricing is easy to forecast a year ahead.
- Session replay is included rather than metered as a separate product.
- OpenTelemetry support keeps the telemetry portable if you leave.
Cons
- RUM rides on top of a base plan, so the real cost is the plan plus a pageview add-on.
- Core Web Vitals debugging stops short of the script-level detail a dedicated frontend tool gives you.
- The step up to Enterprise pricing is steep once you outgrow the mid tier.
6. Sentry
Best for: Developer and product teams whose first question is which users hit the bug.
Rating: 4.5/5 on G2.
Pricing: A free developer plan, then $26 per month on the Team plan. Web Vitals monitoring requires the Business or Enterprise plan.
Sentry began as error tracking and grew into performance monitoring, and that origin still shows. The whole workflow answers one question: what broke, for whom, and in which release.
It is the rare monitoring tool developers install on their own, often before anyone approves a budget line for it.
Pros
- The fastest route from an alert to the responsible line of code.
- The free tier is usable on small projects.
- Error context is rich enough that most bugs need no reproduction step.
Cons
- Web Vitals sit behind a higher plan, which catches teams evaluating on the cheap tier.
- It does not cover infrastructure or network, so it sits beside your other tools.
- Six separate billing meters make the monthly total hard to predict.
7. Raygun Real User Monitoring
Best for: Lean teams that want frontend performance and crash reporting on one invoice.
Rating: 4.3/5 on G2.
Pricing: Basic runs $80 per month billed annually for 100,000 sessions. Team is $160 and Business is $800 on the same terms, with overage at $0.002 per session.
Raygun splits a slow page into DNS, latency, SSL, server and transfer time. You can see which slice actually cost the user their two seconds.
The ceiling shows up when a metric goes bad and you need to know why. Raygun shows you where the time went and then leaves the diagnosis to you.
Pros
- Session pricing is predictable, with unlimited apps and team members.
- Crash reporting and RUM together suit teams with no observability budget line.
- The SDKs are light and deploy quickly.
Cons
- Root cause work on a poor Core Web Vitals score runs out of road quickly.
- Custom timings are locked to higher plans.
- No infrastructure or network monitoring, so it adds a tool rather than replacing one.
8. DebugBear
Best for: Core Web Vitals optimization and SEO performance work.
Rating: Too few verified enterprise reviews to publish a score.
Pricing: From $125 per month on the Startup plan, rising to $899 for Corporate. Page-view sampling keeps the bill down.
If your job is passing the Core Web Vitals assessment, DebugBear digs deeper than any full-stack platform here. Its INP dashboards name the element the user tapped, the scripts that ran during that interaction, and why those scripts were running.
Most tools cannot answer that last question at all.
Pros
- The best Core Web Vitals debugging detail on this list.
- Real user data and synthetic testing sit in one product.
- The guided optimization workflow suits teams with no performance specialist.
Cons
- Frontend only, with no backend, infrastructure or log correlation.
- No native mobile app monitoring.
- A small vendor with a thin third-party review base.
9. SolarWinds Pingdom
Best for: Teams that want uptime checks, synthetic tests and RUM on one small bill.
Rating: Not enough verified G2 or Gartner Peer Insights reviews to publish a score.
Pricing: Real user monitoring starts at $16.50 a month billed annually, which works out at $198 a year. Synthetics and RUM together run $396 a year, and a 14-day trial covers both.
Pingdom was watching websites long before observability became a category, and RUM arrived as an addition to that uptime business. One snippet on the page and data starts landing within minutes.
What you get for the money is breadth, not depth. Pingdom will tell you a page got slower for visitors in Germany and then leave you to find out why somewhere else.
Pros
- Uptime checks, synthetic tests, page speed and RUM sit in one inexpensive product.
- Deployment takes minutes and needs no agent on any host.
- A shareable public status page comes built in.
Cons
- The metric set is narrow with little breakdown behind each number, so diagnosing a regression means opening a second tool.
- No backend correlation, so a slow page never leads you to the code behind it.
- SolarWinds also sells a separate Observability platform, so Pingdom's long-term roadmap is worth asking about.
10. Grafana Faro
Best for: Open-source and OpenTelemetry teams avoiding lock-in.
Rating: Grafana Cloud rates 4.5/5 on G2 and 4.6/5 on Gartner Peer Insights.
Pricing: The Faro Web SDK is open source and free to self-host. Grafana Cloud Frontend Observability runs $0.75 per 1,000 sessions, and a free tier exists.
Faro answers the team that refuses to let frontend telemetry get trapped in one vendor's format. You pay for that freedom in engineering hours, and the first month is rough.
It also holds no opinion about what good looks like. Commercial tools ship thresholds and defaults, while here you decide what to alert on and build the view that shows it.
Pros
- No license cost when self-hosted.
- No lock-in on the data format.
- It drops into an existing Grafana, Loki and Tempo stack without argument.
Cons
- Setup and maintenance take real engineering time.
- Dashboards are rougher out of the box than commercial tools.
- Session replay is less mature than Datadog or Sentry offer.
What Changed in Real User Monitoring for 2026
The measurement standard shifted this year, and it changes what you should ask vendors.
Until recently, Core Web Vitals only described the first page load. A user landing on your homepage and clicking through four screens of a React application produced metrics for the landing and silence after it. On a single-page app, most of the real experience went unmeasured.
Chrome 151 closed that hole in July 2026 by shipping soft navigation measurement unflagged for every site. Here is what it means in practice.
A soft navigation is now a measurable event: Any user-initiated URL change that paints something new emits its own performance entry with a unique navigation ID.
Vitals attach to individual routes: LCP, INP and CLS can be reported per route change instead of pooled across the whole visit.
Tooling support has landed: Google's web-vitals library handles soft navigations from version 6.0.0.
Google is telling buyers to ask: Chrome's documentation now says to check with your RUM provider whether it measures Core Web Vitals by soft navigation.
We treat this as a roadmap question rather than a dealbreaker. Support is landing across the category at different speeds, and no vendor's marketing page is a reliable guide yet.
The test takes ten minutes during a trial. Load your own single-page app, click between routes, and check whether the tool reports separate vitals for each one. One figure for the whole visit means you are still measuring the old way.
What Should You Look for in a Real User Monitoring Tool?
Five checks settle most evaluations. We have ordered them by how often each one turns out to be the deciding factor.
Backend correlation: Decide this early. A frontend-only tool tells you the page was slow, while a correlated platform names the query, host or link that made it slow. If your team owns the backend too, correlation pays for itself during the first serious incident.
Sampling policy and its cost effect: Most tools sample at high volume, and sampling decides whether your budget holds. Ask what percentage is captured by default and whether you control it. In our experience the sampled sessions are never the ones you want at 2 a.m.
Single-page app measurement: Confirm route changes are measured on their own, not folded into the initial load. This matters more every quarter as soft navigation support spreads.
Pricing unit: Per session, per gigabyte, per host and per user all behave differently as you grow. Session billing punishes traffic spikes, and ingest billing punishes chatty instrumentation. We tell teams to match the unit to whichever one they can actually control.
Privacy controls: In a regulated sector, data masking and configurable retention are not optional. Check them before the security review does it for you.
One thing we would deprioritize is session replay. Nearly every tool here has it now, so it rarely separates two finalists. Debugging depth behind a bad metric separates them far more often.
Which Real User Monitoring Tool Is Right for Your Team?
Most teams land in one of five situations, and the table below maps each to a starting point.
Situation | Start With | Why |
You already run network and infrastructure monitoring and want frontend data in the same place | Motadata ObserveOps | One platform and one data store remove the console-hopping that slows down root cause work |
You are cloud-native and already invested in one observability vendor | Datadog RUM or New Relic Browser | Correlation is strongest when RUM lands where your traces and logs already live |
Your job is passing Core Web Vitals and protecting SEO | DebugBear | Nothing else here explains why an interaction was slow at element and script level |
Your main question is which users hit which bug | Sentry | The error-first workflow reaches the responsible code fastest |
You need to avoid lock-in or license cost | Grafana Faro | OpenTelemetry data you can self-host and route wherever you want |
If two of these fit you, run both trials against the same week of real traffic. We have sat through enough paper comparisons to know they flatter whichever vendor writes the better documentation.
Pick the Best Real User Monitoring Tool for Your Business
What are the best real user monitoring tools for your business? The answer splits this category in two, and most teams we talk to shop in the wrong half.
When the bottleneck is time to root cause, a frontend-only tool keeps handing you evidence with no explanation attached.
ObserveOps answers that second case. Browser timings, traces, logs, flows and network data sit on one unified observability platform, so the investigation ends where it started instead of moving to another tab.
Whichever half you sit in, evaluate the tool on your own traffic for at least two weeks. Every tool here looks good on a vendor demo site, and none of them look the same on yours.
FAQs
What is the difference between real user monitoring and synthetic monitoring?
Real user monitoring collects data passively from actual visitors, so it reflects real devices and networks. Synthetic monitoring runs scripted tests from fixed locations on a schedule. Synthetic catches outages before users do, and RUM measures the damage once they arrive.
Does real user monitoring slow down your website?
A well-built RUM agent adds a small script loaded asynchronously, so it does not block rendering. The effect on page speed is negligible in practice. Sampling reduces it further by collecting from a share of sessions rather than all of them.
Can RUM tools measure Core Web Vitals for single-page applications?
Historically they measured only the initial page load. Chrome 151 shipped soft navigation measurement in July 2026, letting LCP, INP and CLS attach to individual route changes. Vendor support is uneven, so test it during your own trial before you believe a feature list.
Is real user monitoring the same as product analytics?
No. RUM answers how the application performed for a real user, covering load time, responsiveness and errors. Product analytics answers what users did and why they converted. ObserveOps RUM sits on the performance side, tracking six frontend KPIs including Apdex.
Is Motadata ObserveOps better than Datadog for real user monitoring?
It depends on your stack. Datadog has deeper native mobile coverage and a larger integration catalog. We fit better when you also run network and infrastructure monitoring and want one platform and one quote instead of several metered products.
Author
Ramya Shah
Technical Writer
Ramya Shah is a technical content writer with a computer engineering background and roots in automotive journalism. He covers IT Service Management, observability, IT operations, and AI-driven automation. An early adopter of AI-assisted writing workflows, he turns complex IT processes into clear, engaging content optimized for search and answer engines (AEO), lifting content output and organic visibility.