OBSERVEOPS
Real User Monitoring
From clicks to journeys, from page loads to interactions, assuring clarity, consistency, and continuity for every user experience.
Motadata ObserveOps Real User Monitoring captures real-world performance directly from your users’ browsers. Track Core Web Vitals, understand session behavior, pinpoint slowdowns, and correlate every action with application, infrastructure, and network telemetry — giving teams a complete view of digital experience quality.
Core Features
Built for Experience, Clarity, and Control
Real user monitoring that transforms sessions, interactions, and performance signals into actionable intelligence — giving you complete visibility into how users truly experience your applications.
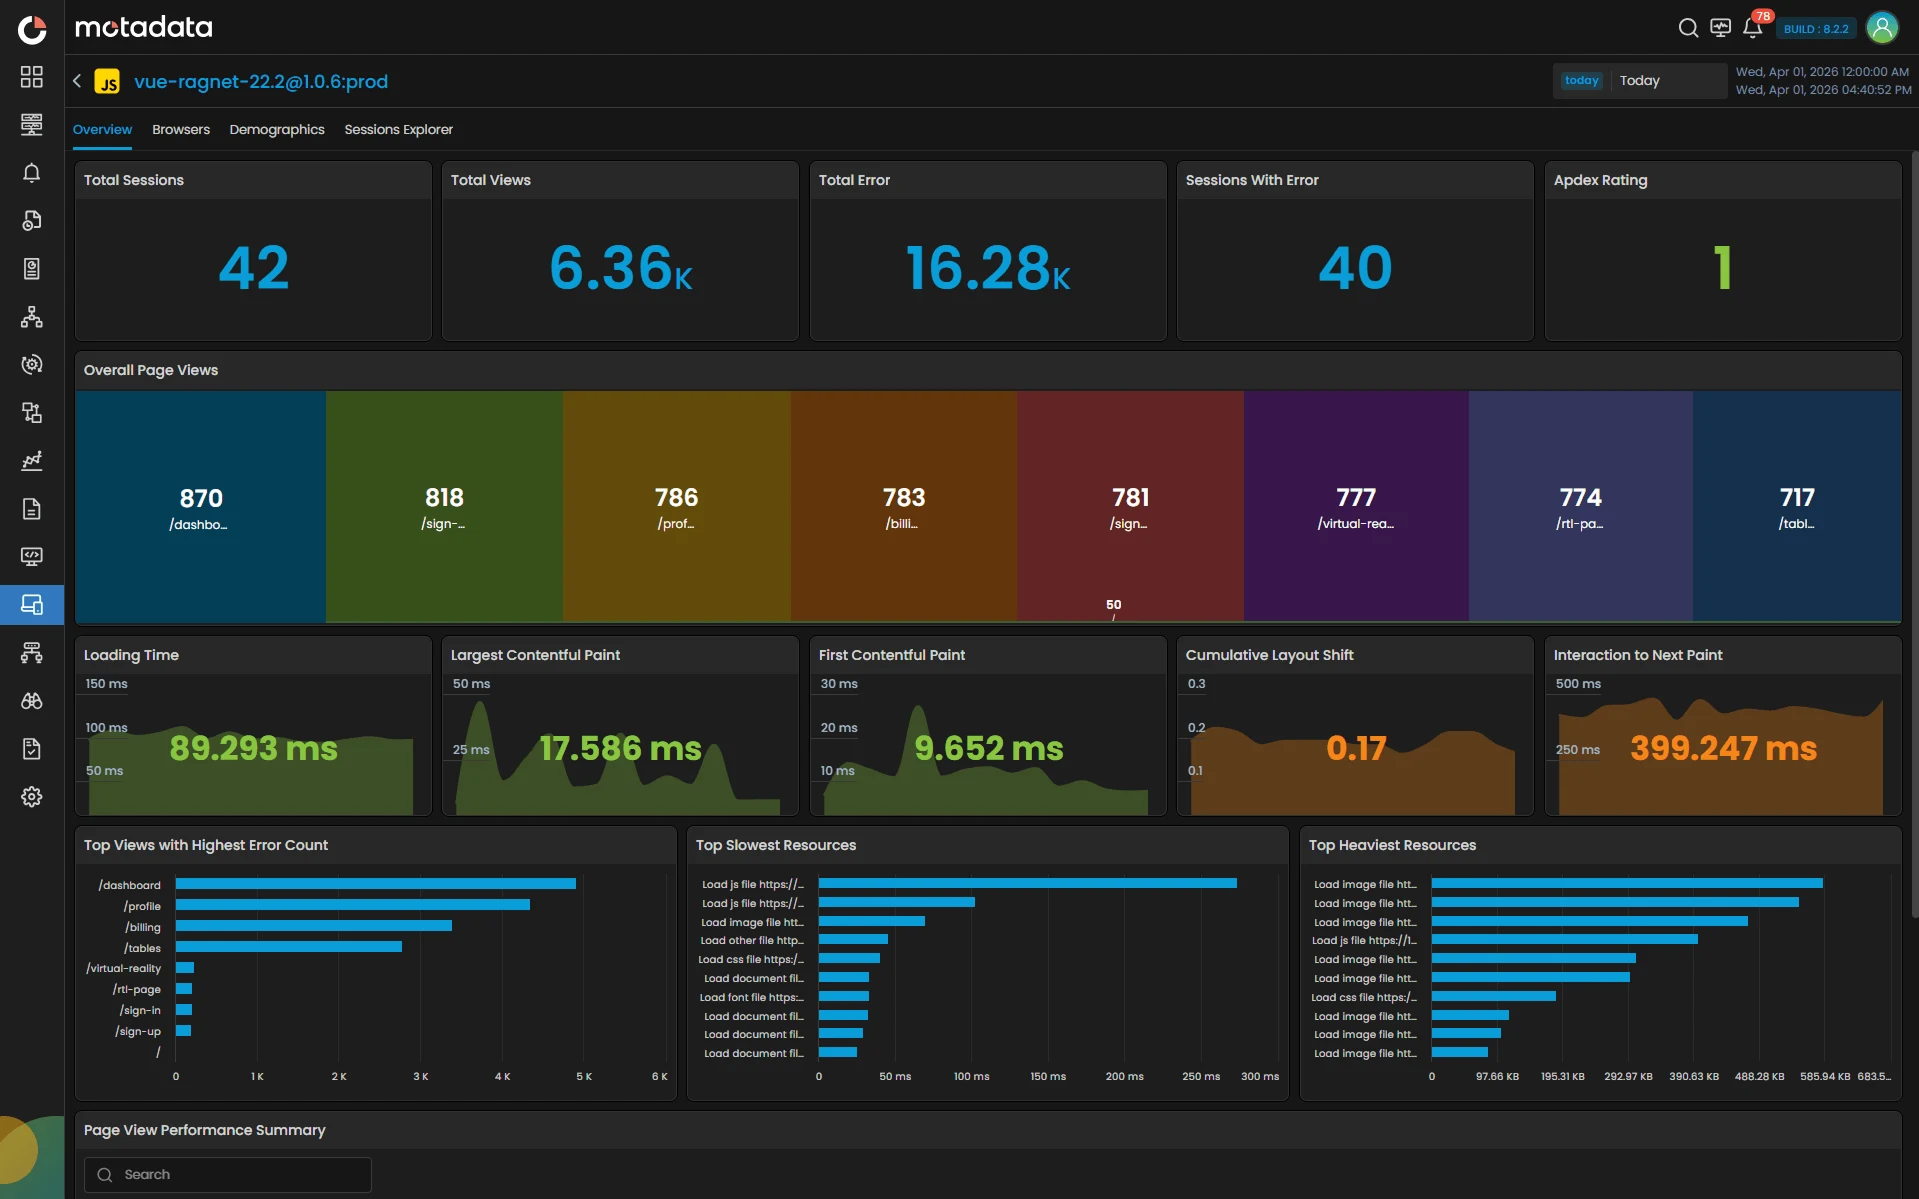
Real-Time Experience Visibility
Observe live user interactions across sessions, pages, and journeys to understand performance exactly as it happens.
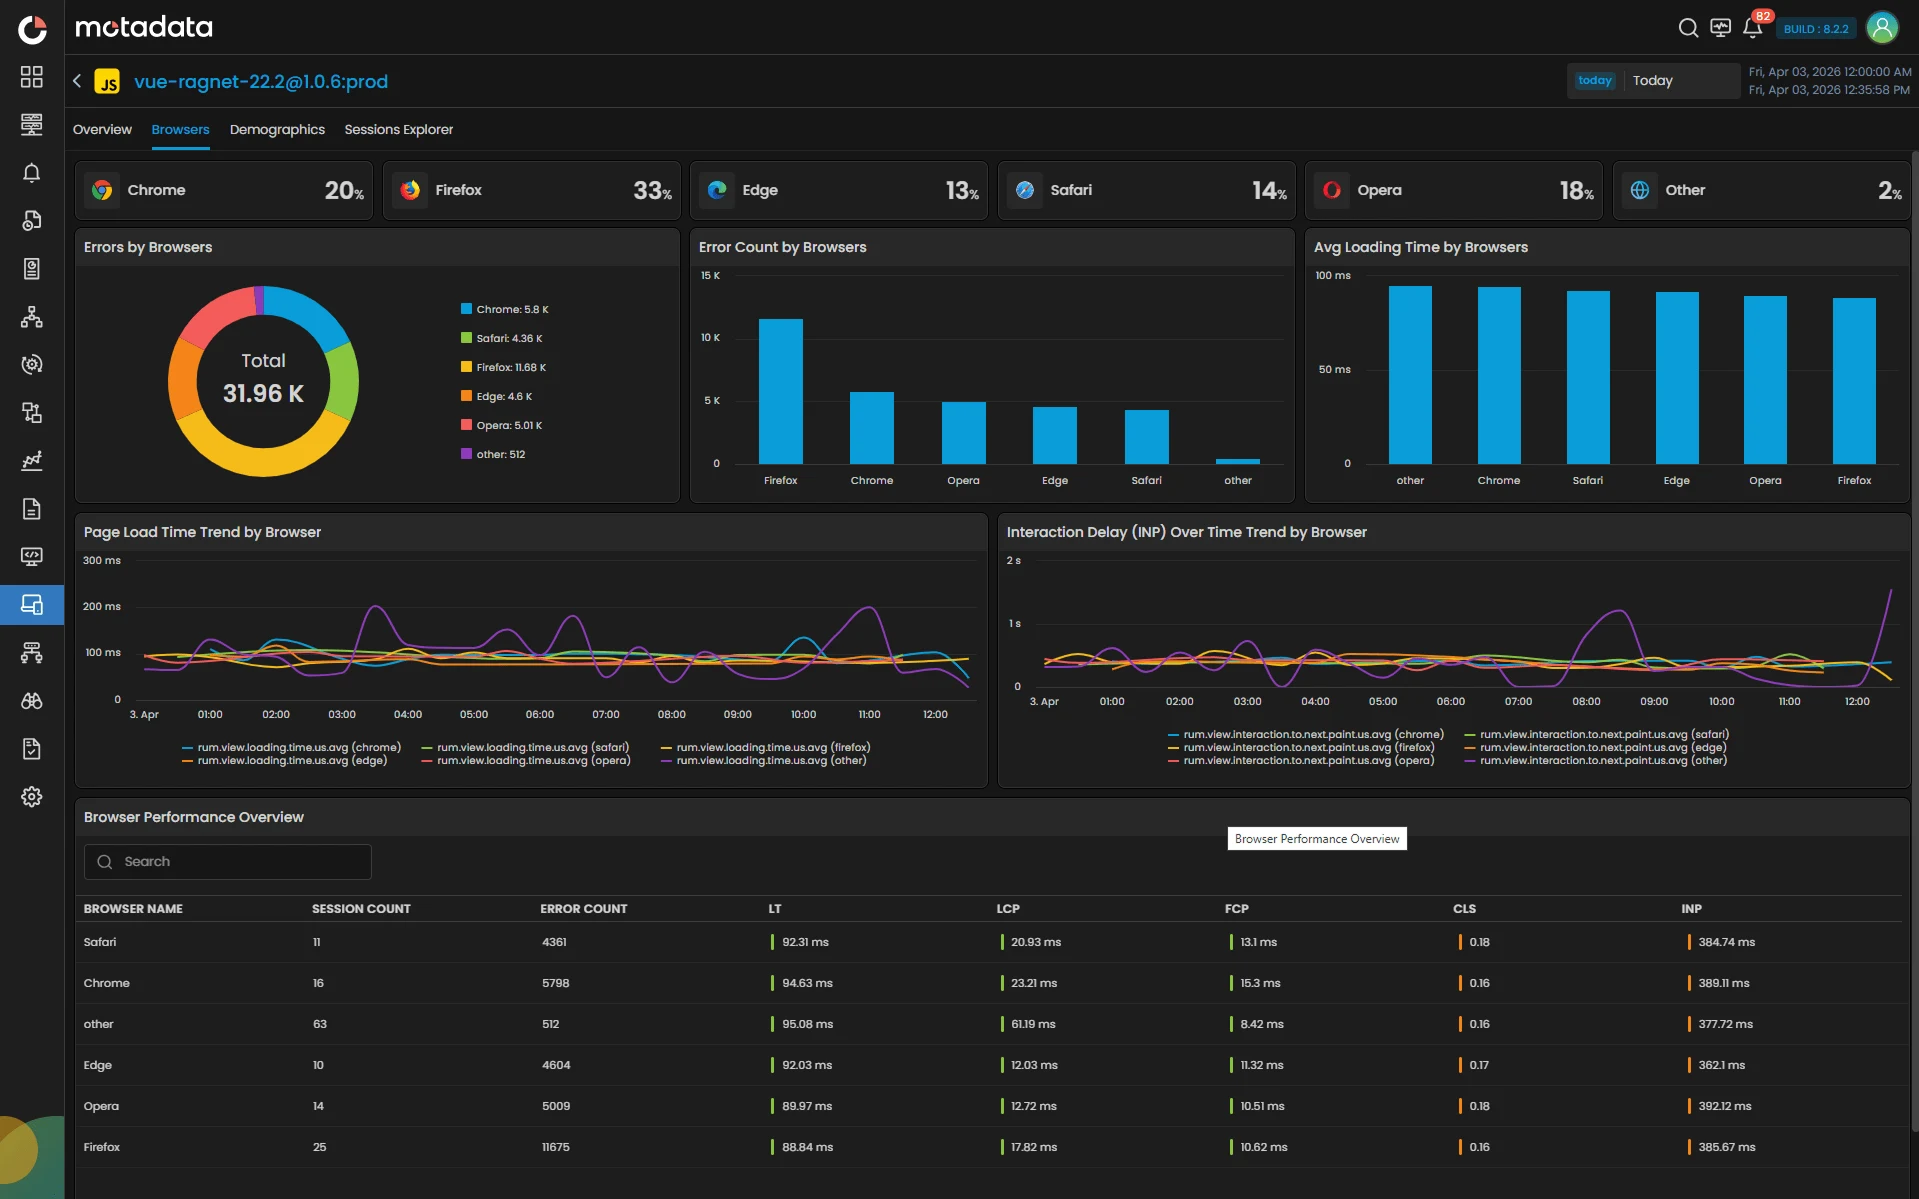
Core Web Vitals Assurance
Measure and optimize LCP, FCP, CLS, INP, and other key indicators to deliver fast, stable, and responsive experiences.
End-to-End Journey Insight
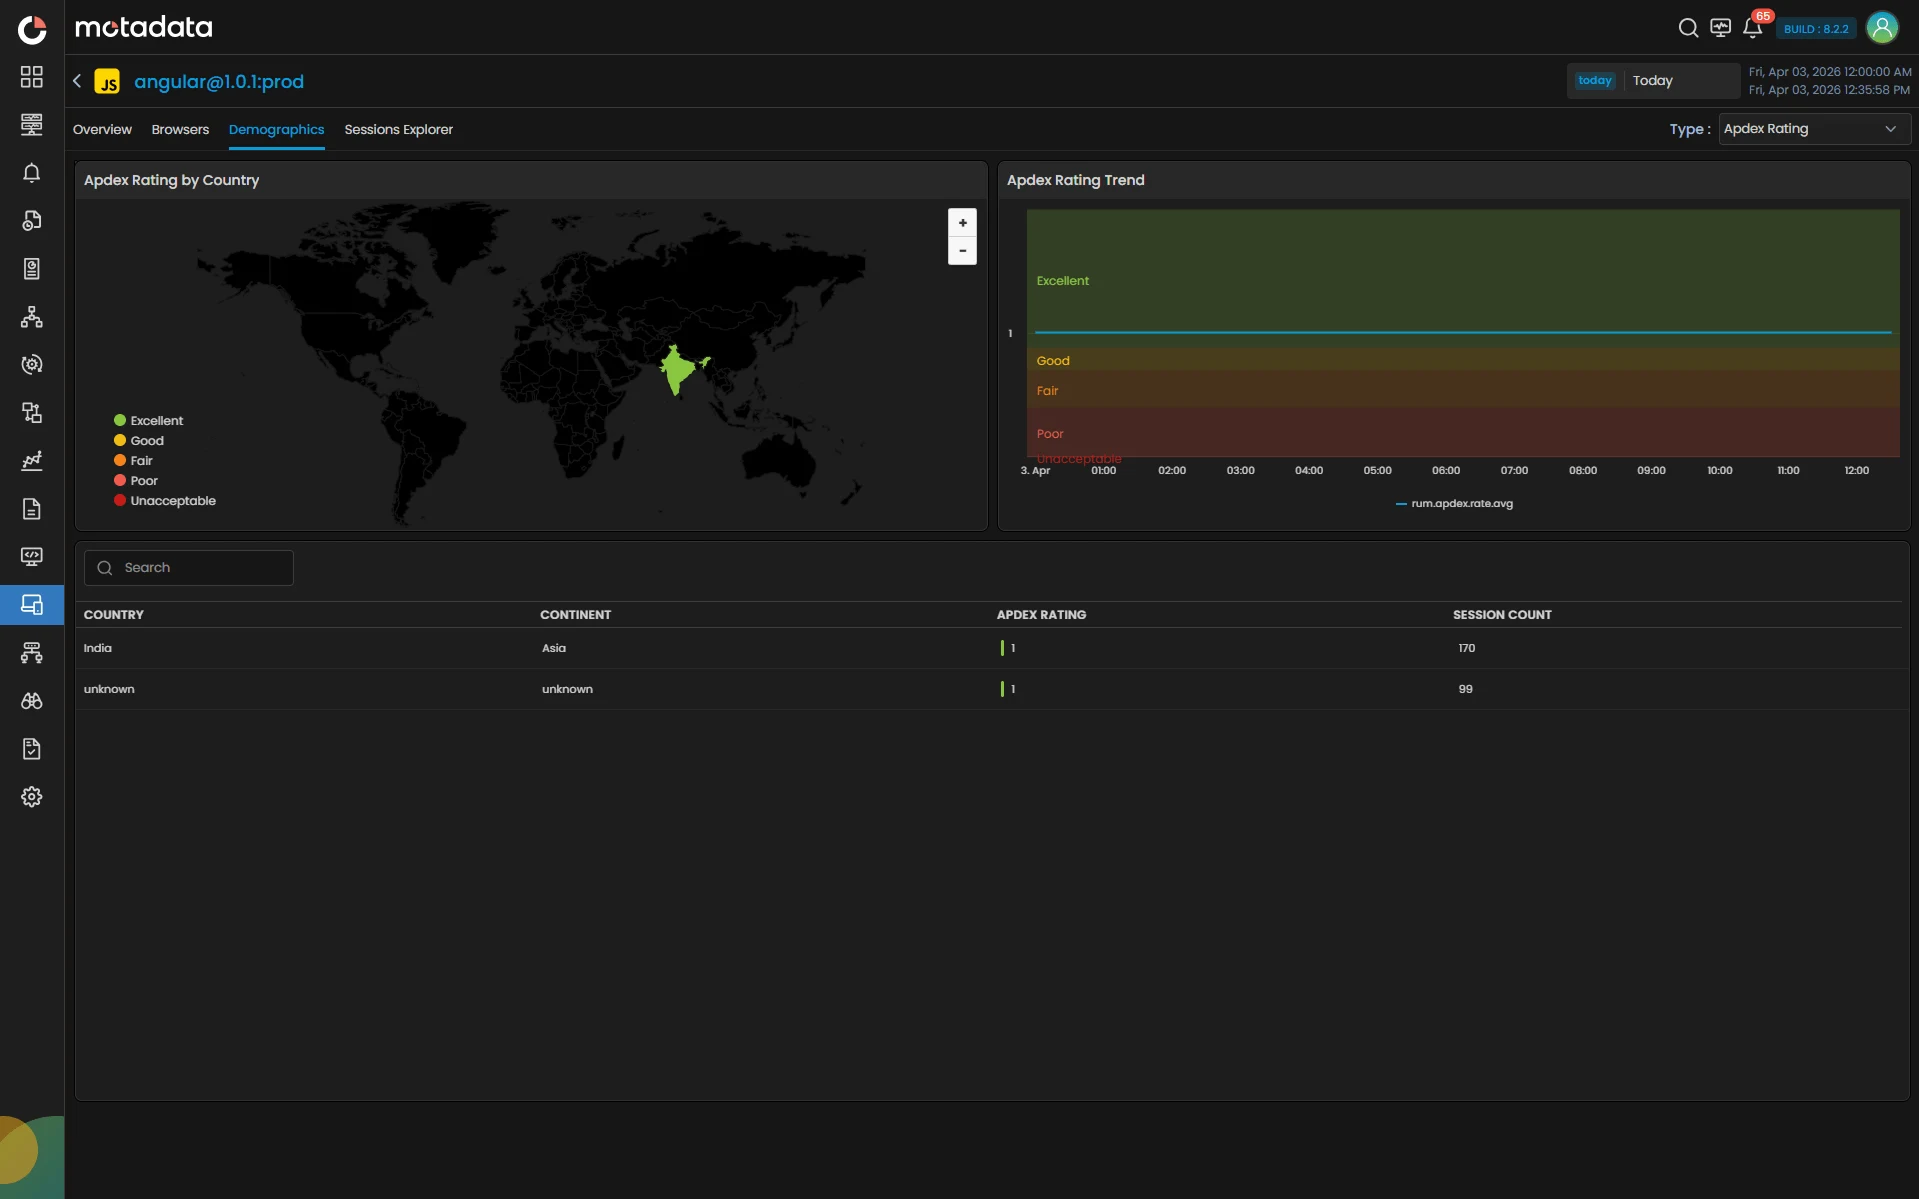
Track complete user journeys across devices, browsers, and geographies to uncover friction and optimize flow.
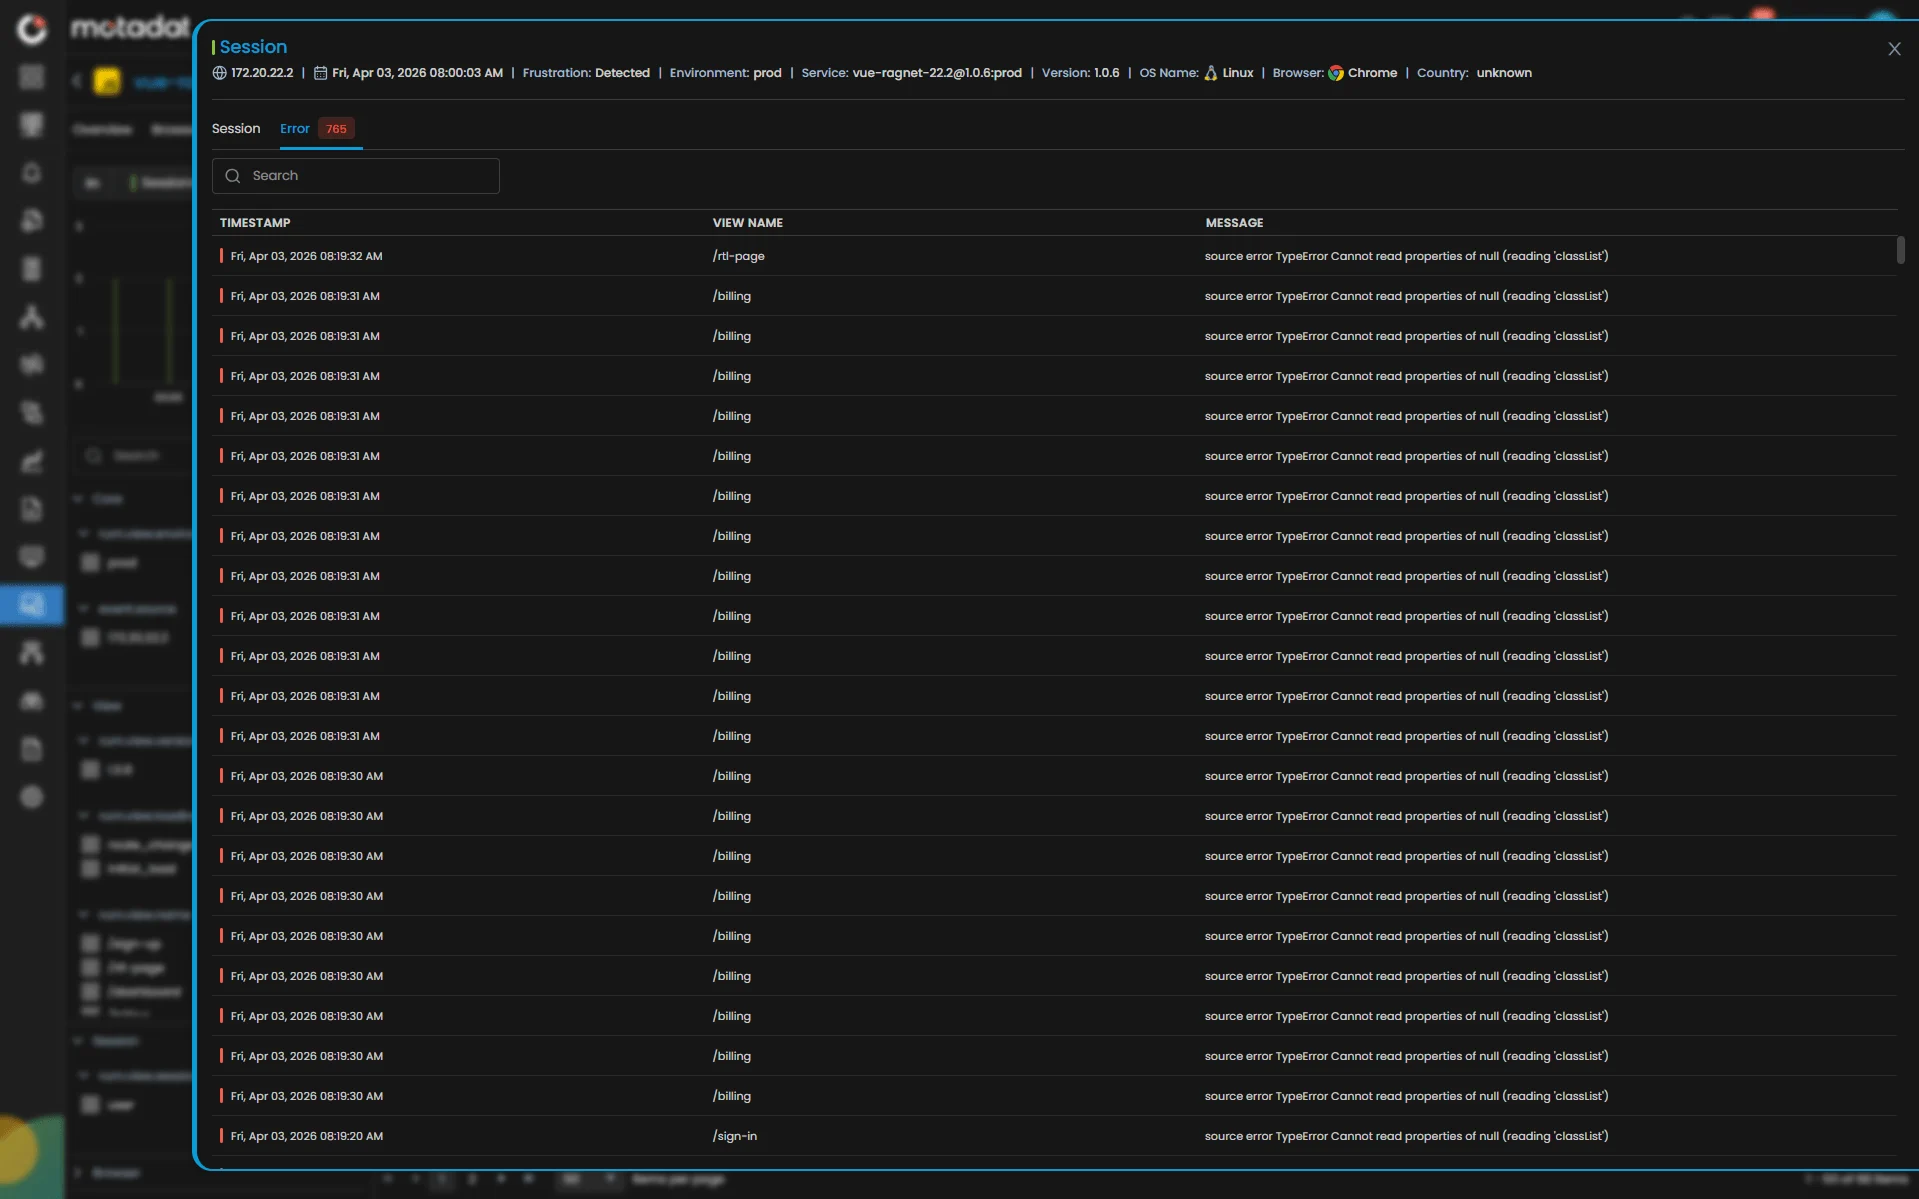
Front-End Reliability Monitoring
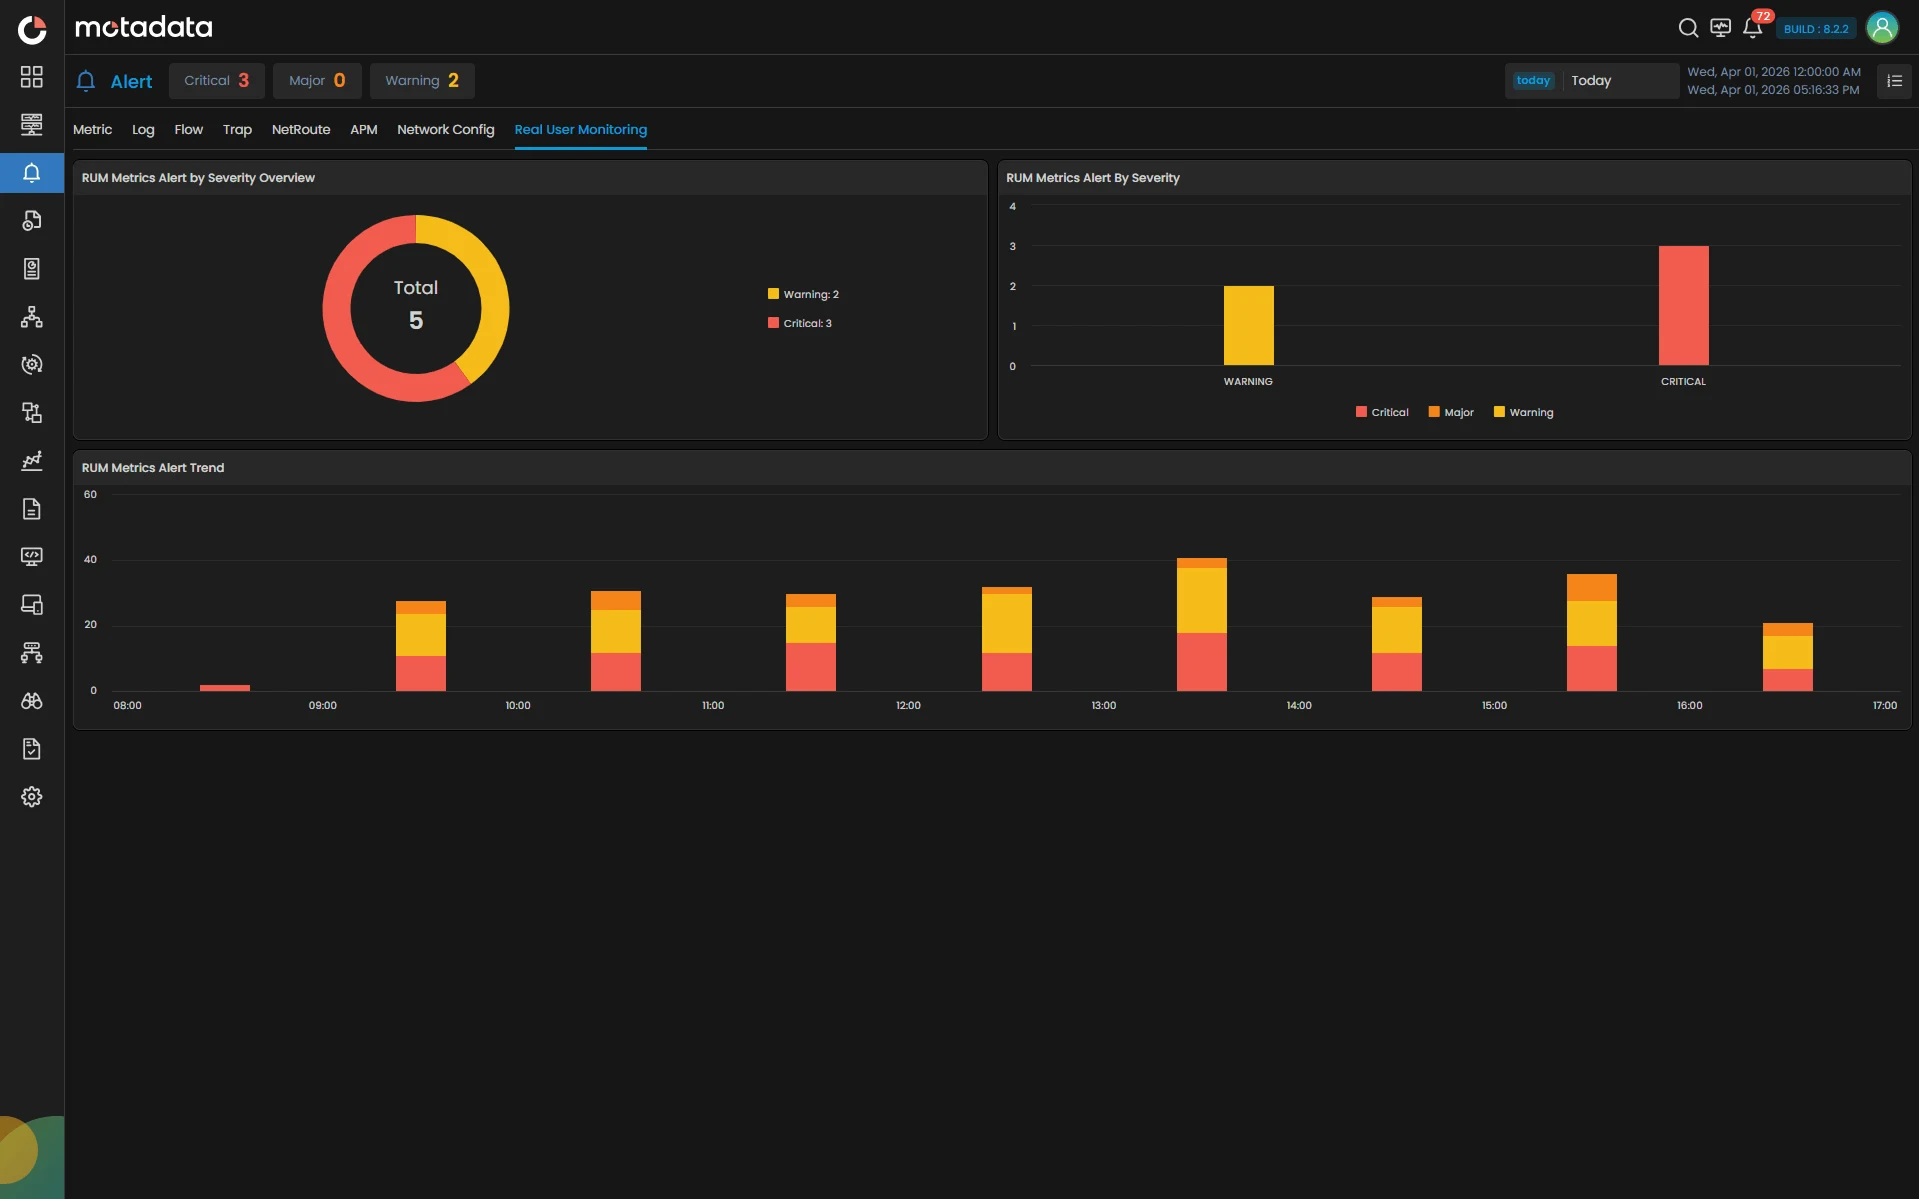
Detect client-side errors, failures, and regressions early — before they impact user satisfaction or conversions.
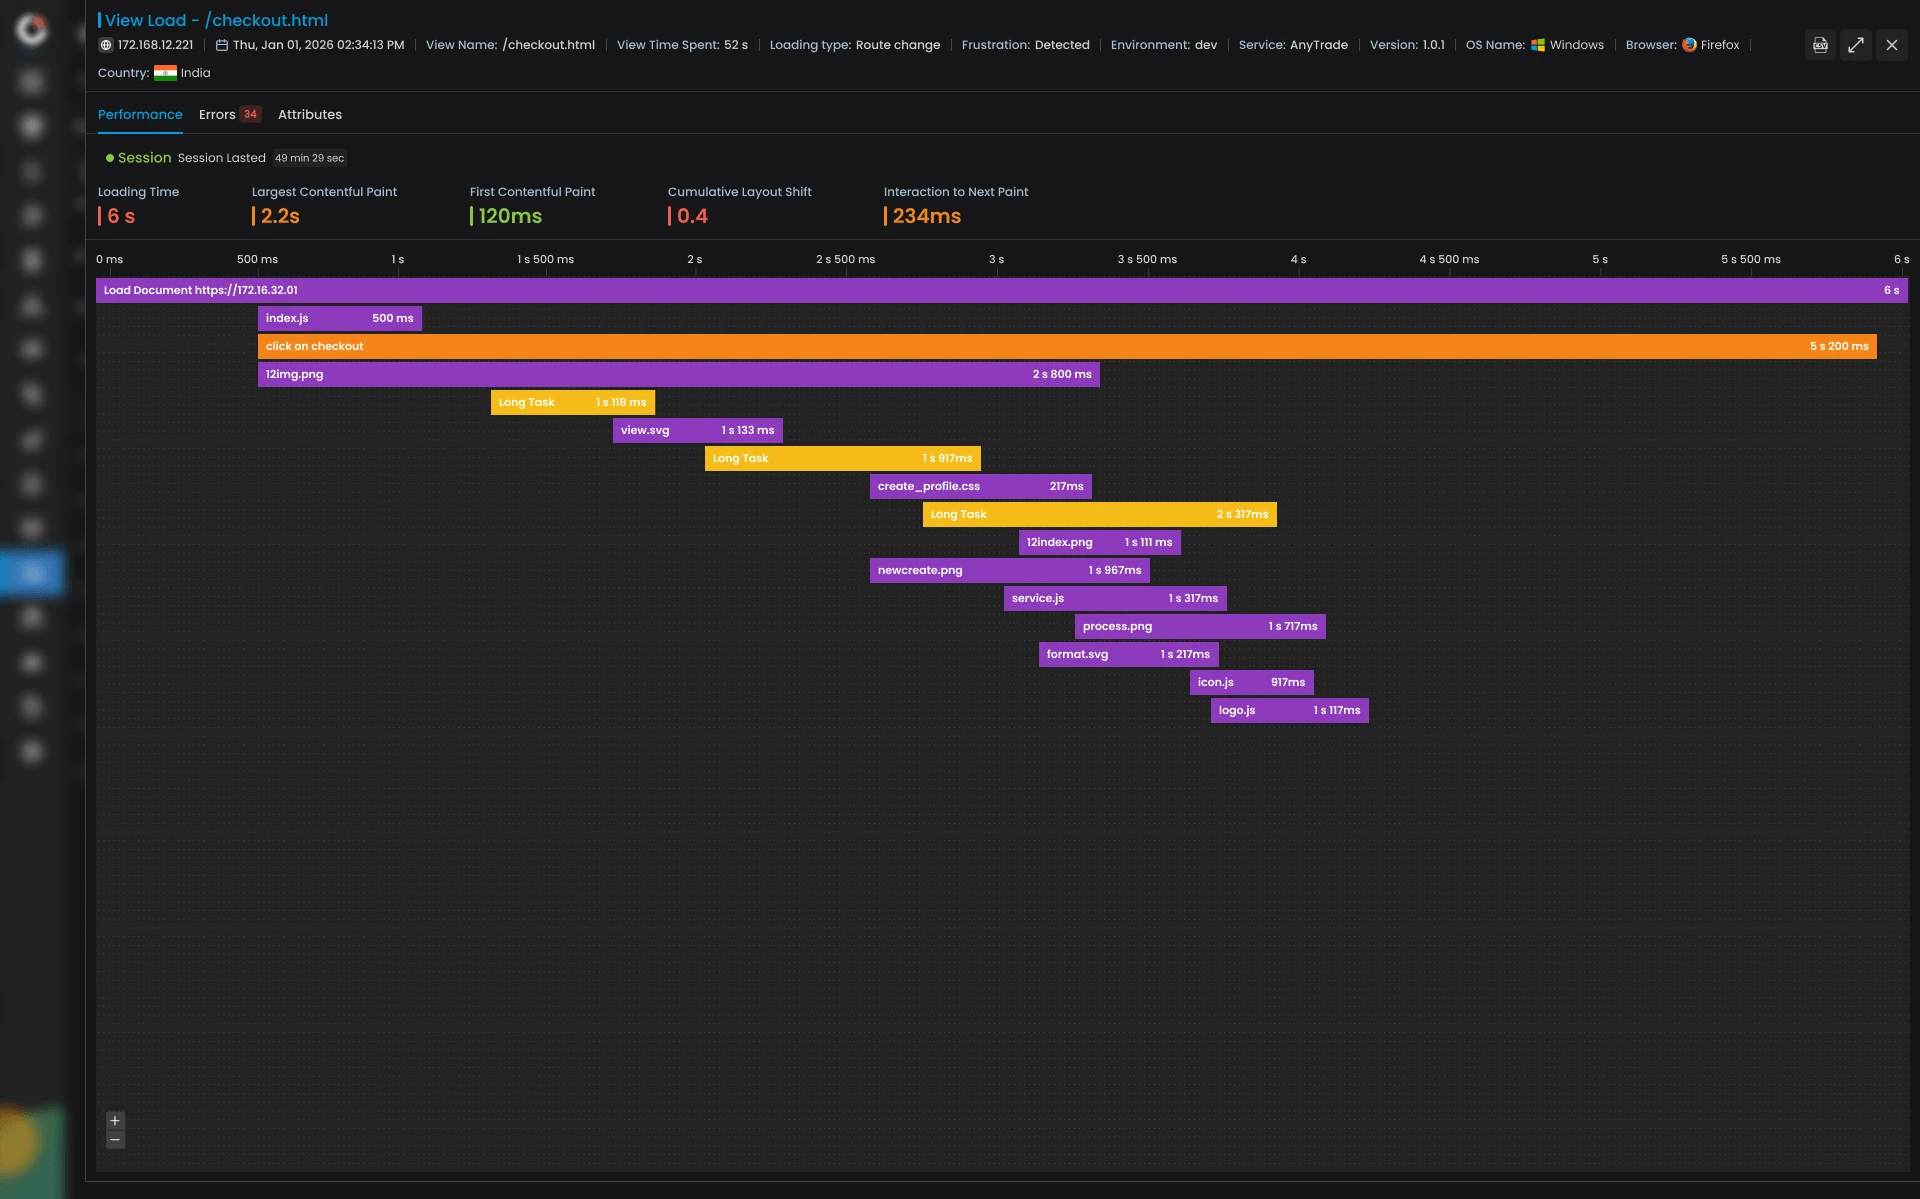
Performance Bottleneck Clarity
Identify slow resources, long tasks, and blocking elements that degrade page load and interaction speed.
Experience Analytics at Scale
Analyze trends, segment users, and visualize behavior patterns with dashboards built for continuous experience optimization.
Every Click. Every Journey. Complete Experience Clarity.
Capabilities
RUM Capabilities
Complete RUM
Quantify real user experience with precise performance indicators that help teams maintain fast, fluid, and frustration-free journeys.
Key Highlights
Core Web Vitals Tracking: LCP, FCP, CLS, INP, and other Web Vital KPIs measured end-to-end.
Performance Analytics: Latency, load time, render time, and interaction time across browsers and regions.
Experience Friction Detection: Long tasks, heavy resources, and layout shifts surfaced.
Trend and Baseline Reporting: Performance thresholds and trend lines for proactive optimization.
Every Millisecond Measured. Every Experience Understood.
Metrics & Differentiation
0%
improvement in Web Vital scores through real-user-driven optimization.
0%
faster RCA by linking client-side issues with backend traces and metrics.
0%
higher user satisfaction after eliminating front-end performance regressions.
“ServiceOps and its monitoring capabilities gave us a unified view of operations, helping our teams deliver faster, more responsive IT services to customers with greater consistency.”
Jude Emerue
—IT Service Manager, Heirs Technologies
Core Web Vitals native
for modern experience measurement.
Session Explorer with metadata depth
unmatched in this category.
Privacy-first design
with input masking and sampling controls.
Full-stack correlation
with logs, traces, metrics, network and infra.
Powered by Motastore
for high-speed processing at enterprise scale.
Enterprise Ready
Real Experience Intelligence for a Digital-First Enterprise
From user interactions to site performance, from journey insight to experience clarity, delivering visibility that protects revenue, elevates satisfaction, and ensures every user flow performs as intended.
Experience-Centric Visibility at Global Scale
Enterprises must understand how real users experience their applications across geographies, devices, browsers, and networks. Motadata captures live user sessions, Web Vitals, interactions, errors, and rendering behavior at scale, transforming raw UX events into actionable insight. Digital and IT leaders gain continuous visibility into the true customer experience, not just backend performance. Motadata provides OpenTelemetry-native tracing, code-level analytics, flame graphs, span correlation, and dependency maps that reveal exactly how applications behave across distributed topologies. This empowers SREs and engineering leaders to diagnose performance degradation with precision instead of guesswork.
Enterprises must understand how real users experience their applications across geographies, devices, browsers, and networks. Motadata captures live user sessions, Web Vitals, interactions, errors, and rendering behavior at scale, transforming raw UX events into actionable insight. Digital and IT leaders gain continuous visibility into the true customer experience, not just backend performance. Motadata provides OpenTelemetry-native tracing, code-level analytics, flame graphs, span correlation, and dependency maps that reveal exactly how applications behave across distributed topologies. This empowers SREs and engineering leaders to diagnose performance degradation with precision instead of guesswork.
Intelligence That Uncovers Hidden Friction
Front-end regressions often go unnoticed until they impact conversion, satisfaction, or retention. Motadata’s flame charts, resource breakdowns, latency distribution, and anomaly detection reveal subtle slowdowns, layout shifts, blocking scripts, and third-party issues before users feel the pain. This allows SREs and product teams to fix root causes early and maintain consistently fast and fluid digital journeys.
Front-end regressions often go unnoticed until they impact conversion, satisfaction, or retention. Motadata’s flame charts, resource breakdowns, latency distribution, and anomaly detection reveal subtle slowdowns, layout shifts, blocking scripts, and third-party issues before users feel the pain. This allows SREs and product teams to fix root causes early and maintain consistently fast and fluid digital journeys.
Privacy-First Insight for Regulated Environments
Enterprise-grade experience monitoring must observe behavior without violating trust. Motadata enables session sampling, secure input masking, data control, and compliance-friendly monitoring for regulated industries such as BFSI, healthcare, and public sector. CIOs and Compliance Officers gain confidence that user insights are protected, anonymized, and responsibly managed.
Enterprise-grade experience monitoring must observe behavior without violating trust. Motadata enables session sampling, secure input masking, data control, and compliance-friendly monitoring for regulated industries such as BFSI, healthcare, and public sector. CIOs and Compliance Officers gain confidence that user insights are protected, anonymized, and responsibly managed.
Unified Correlation Across the Full Application Stack
User pain often originates deep in the stack, a slow API, a congested network path, a heavy database query or a misconfigured host. Motadata correlates RUM data with backend traces, logs, infrastructure metrics, and network insight to provide a single, connected view of user-impacting issues. Teams resolve UX degradation faster, eliminate blind spots, and deliver consistently high-quality digital experiences.
User pain often originates deep in the stack, a slow API, a congested network path, a heavy database query or a misconfigured host. Motadata correlates RUM data with backend traces, logs, infrastructure metrics, and network insight to provide a single, connected view of user-impacting issues. Teams resolve UX degradation faster, eliminate blind spots, and deliver consistently high-quality digital experiences.
Industry Solutions
Industry-Proven Infrastructure Solutions
Tailored for Your Infrastructure Challenges
BFSI
Guarantee real-time visibility across trading, core banking, and digital payments — ensuring compliance, security, and always-on service.
Telecom
Monitor multi-gigabit networks, correlate NetFlow data with subscriber QoE, and prevent outages before they scale.
Healthcare
Safeguard critical patient systems and comply with HIPAA through secure, low-latency observability.
Government & Public Sector
Achieve transparency, security, and control with on-premise observability supporting strict data sovereignty.
Manufacturing
Integrate IT and OT data to prevent production downtime and improve predictive maintenance accuracy.
Retail & eCommerce
Deliver frictionless digital experiences, monitor transactions in real time, and optimize site reliability at global scale.
ObserveOps Platform
Continue Your ObserveOps Journey
Unify every signal. Correlate every insight. Perform without compromise.
Network Observability
Unite flows, packets, and paths into real-time clarity with intelligent alerting at scale.
Network Configuration & Compliance Management
Automated config backups, compliance checks, and drift detection across your network.
Hybrid Infrastructure Monitoring
Monitor on-premise, cloud, and hybrid environments with unified visibility, AI-driven alerts, and real-time insights.
Log Monitoring
Cut through endless logs to reveal root cause with search, correlation, and analytics.
Application Performance Monitoring
Trace every transaction from frontend to backend with distributed tracing and service mapping.
Real User Monitoring
Capture every click and page load with web vitals, experience scores, and session replay.
FAQ
Frequently Asked Questions
Find answers to common questions about Infrastructure Monitoring and our capabilities.
Real User Monitoring (RUM) captures performance data directly from actual users' browsers as they interact with your application in real time — tracking page loads, interactions, errors, and session journeys exactly as users experience them. Unlike synthetic monitoring, which simulates user behavior from predefined scripts in controlled environments, RUM reflects true real-world conditions across different devices, browsers, geographies, and network speeds. This makes RUM essential for understanding genuine digital experience quality rather than idealized lab performance.