What are AI Workloads? How to Monitor Training and Inference Jobs
Why does a training run that should finish overnight still have hours left by morning, while every host check across the GPU cluster reports normal? The servers are up, CPU looks quiet and memory has headroom. Yet the job runs well behind schedule, and the dashboards can't say where the time goes.
The cause lies in how AI workloads behave. They run on accelerators, pull data in large bursts and spread one job across many machines, so a slow disk, a congested link or one throttled GPU shows up as a slower job long before any host alarm fires. Inference adds a second problem: users feel latency within seconds, and every idle GPU hour still costs money.
Getting ahead of that means extending infrastructure observability down to the GPU, the job and the request. In this blog, you will see what AI workloads are, the main types and the AI infrastructure they depend on, where costs leak, and how to monitor training and inference jobs with clear metrics, a troubleshooting flow and the numbers business leaders should ask for.
What are AI Workloads?
AI workloads are the compute, data and storage jobs that prepare data, train models and serve predictions in production. Most of them lean on GPUs or other accelerators far more than a typical business application does.
Put simply, an AI workload is anything that turns data into a model, or a model into an answer. A nightly job that retrains a fraud model counts. So does the API that scores each card payment in milliseconds, and so does the pipeline that cleans the transaction history both of them use.
How AI Workloads Differ from Traditional Workloads
Traditional applications are mostly CPU-bound, steady and easy to size. AI workloads behave differently on almost every axis an operations lead or a finance partner cares about.
Trait | Traditional application | AI workload |
Main resource | CPU and memory | GPU compute and GPU memory |
Load pattern | Steady, follows business hours | Long training runs, spiky inference traffic |
Scaling unit | One more VM or pod | One more GPU node, often bought in groups |
How it fails | Errors and crashes | Slow steps, stalled jobs, drifting answers |
Main cost driver | Licenses and servers | Accelerator hours, busy or idle |
Question monitoring answers | "Is the service up?" | "Is the job making progress, and at what cost?" |
Those differences show up most clearly once you break AI work into its types.
What are the Main Types of AI Workloads?
The main types of AI workloads follow the model lifecycle. Each stage stresses a different part of the infrastructure, so knowing the stage tells you which signals to watch first. Most organizations running AI in production deal with five of them:
Data processing: Cleaning, labeling and converting raw text, images or logs into training-ready files; heavy on CPU, storage reads and network
Model training: Running large datasets through a model for hours or days until it learns patterns; the most GPU-hungry stage
Fine-tuning: Adapting a pre-trained model to company data; shorter runs, same failure modes as training
Inference: Serving predictions in batches or per request; inference workloads are judged on latency and cost per answer
Retrieval and agent execution: Fetching context from a vector database or chaining tool calls before the model replies; extra hops that need tracing, as our guide to agent observability explains
Machine learning workloads on tabular data, such as forecasting or risk scoring, usually stop at training and batch inference. The lifecycle work around them, from versioning to retraining, is what MLOps practices manage.
You'll also see AI workloads grouped by task: deep learning, natural language processing (NLP), computer vision and generative AI. Those labels describe what the model does. The lifecycle stages above describe what the infrastructure has to do, and that view matters more for capacity, cost and observability.
Common Examples of AI Workloads
Common examples of AI workloads include:
Fraud scoring on card payments
Demand forecasting for retail stock
Support chatbots and internal assistants
Defect detection on factory camera feeds
Document classification for claims or contracts
Underneath, all of them share one AI processing pattern: move data to an accelerator, run the math, return a result. The infrastructure that carries that pattern comes next.
What AI Infrastructure Runs These Workloads?
AI infrastructure is the stack of accelerators, storage, networking and orchestration that keeps those jobs fed and scheduled. It has four layers, and a weak one slows every job above it.
1. Compute and GPU Accelerators
GPUs, TPUs and similar accelerators do the parallel matrix math. Two numbers decide most sizing conversations: how busy the compute cores are, and how much GPU memory a model needs.
For example, a model too large for one GPU's memory gets split across several GPUs. Once that happens, the network takes part in every training step, so interconnect health starts to affect training speed.
2. Storage Architecture for AI Workloads
Most AI workloads storage architecture decisions come down to three access patterns:
Training reads: Large, parallel, repeated reads of the dataset every epoch
Checkpoint writes: Heavy write bursts every few hundred or few thousand steps
Model loading: One big read each time an inference server starts or scales out
Here, throughput under parallel reads matters as much as IOPS, because dozens of data loader workers hit the same files at once. Our roundup of storage monitoring tools covers how to track both.
3. Networking and Interconnects
Distributed training syncs gradients between GPUs after every step. Inside a server, that traffic uses NVLink or PCIe; between servers, it rides InfiniBand or high-speed Ethernet, and one congested link makes every other GPU wait.
Location matters too. Many organizations train on-premises and run inference in the cloud, which makes hybrid cloud visibility part of the same job.
4. Orchestration and Scheduling
Kubernetes with a GPU device plugin, or a batch scheduler such as Slurm, decides which job gets which GPUs. Container orchestration keeps an expensive cluster shared; it also means one queued job can hold GPUs that another job is waiting for.
Each of those layers is also where money and time leak, which is why AI workloads bring a distinct set of challenges.
What are the Biggest Challenges of Running AI Workloads?
The biggest challenges of running AI workloads are cost, capacity and visibility, and they tend to arrive together. Six come up in almost every AI infrastructure review:
High cost per hour: GPU nodes cost far more than general-purpose servers, so idle time hurts the budget quickly
Scarce capacity: Long lead times for accelerators and pressure to share one cluster across projects
Power and cooling: Dense GPU racks push facilities hard, so data center monitoring becomes part of AI planning
Contention on shared clusters: One oversized job delays everyone queued behind it
Data security and governance: Training data and model weights are valuable assets that need access control and audit trails
Fragmented visibility: GPU tools, Kubernetes dashboards and cloud monitoring tools each show one slice of the same job
Most of these come back to knowing what each GPU is doing right now and which project it is working for. Observability is how organizations get that answer.
Why is Observability Critical for AI Workloads?
Why observability is critical for AI workloads comes down to one fact: their failures are slow, expensive and hard to see from host-level checks. A stalled training job keeps every GPU allocated, and a slow inference endpoint loses users before a single error appears.
The money involved raises the stakes. According to Gartner's forecast, worldwide AI spending will reach about USD 2.67 trillion in 2026; AI infrastructure accounts for roughly USD 1.48 trillion of it. IDC's tracker puts AI infrastructure spending at USD 121.4 billion in the second quarter of 2026 alone, up 53% on the year before. With budgets that size, observability pays back in four places:
Utilization: Proof that paid-for GPUs do useful work, by job and by project
Delivery: Early warning when a training run will miss its date
User experience: Latency and errors on the endpoints customers touch
Capacity: Trend data behind the next GPU or storage purchase
Questions Business Leaders Should Be Able to Answer
A CIO or finance lead doesn't need GPU counters. They need a short list of answers, each backed by one metric the platform already collects.
Business question | Metric that answers it |
"Are we using the GPUs we pay for?" | GPU utilization by project, plus allocated but idle GPU hours |
"Will the model ship on time?" | Training step time and throughput against the plan |
"Are customers getting fast answers?" | Time to first token and p95 latency against the agreed service level objective (SLO) |
"What does each answer cost?" | Cost per 1,000 requests or tokens |
"When do we need more capacity?" | Forecast saturation date for GPU memory and storage |
These five answers are also the strongest case for how observability lowers costs once AI moves past the pilot stage. Getting there starts with treating training and inference as two different observability problems.
How Should Observability Differ for Training and Inference Jobs?
Observability differs for training and inference jobs because one tracks progress toward a finished model and the other tracks the speed and cost of each answer. This means the same reading can point to a problem in one job type and normal behavior in the other, as the comparison below shows.
Question | Training jobs | Inference jobs |
Runtime | Hours to weeks | Always on, request by request |
What success looks like | Steady step time, falling loss | Low latency at a predictable cost |
Usual bottleneck | Data loading, gradient sync, checkpoints | Queueing, GPU memory, batching |
First warning sign | Step time creeps up | Queue wait and time to first token climb |
Alert style | Progress and stall alerts | SLO and error budget alerts |
Cost unit | GPU hours per finished run | Cost per 1,000 requests or tokens |
Who acts first | ML platform engineers | SREs and application owners |
Inference fits the familiar golden signals of latency, traffic, errors and saturation; training needs progress signals on top. Keep the two in separate dashboards and alert policies; if they share one view, a training stall can hide behind busy inference graphs.
How Can You Monitor AI Training Jobs?
You monitor AI training jobs by tracking progress, meaning step time and throughput, next to the GPU, storage and network signals that explain it. Host CPU and memory still count, although on their own they rarely explain a slow run, because the bottleneck usually lies in the GPU, storage or network path.
Training Job Metrics Worth Alerting On
Start with these signals. The alert points below are starting values, and results vary by model and hardware, so tune each one against a couple of weeks of your own job history.
Metric | What it tells you | Starting alert point |
Step time | "Is the job slowing down?" | 20% above the run's own median for 10 minutes |
Samples or tokens per second | Training throughput, per job | Well below the last run of the same config |
GPU utilization and SM activity | How busy the GPU's compute cores (SMs) are | Sustained drop mid-run |
GPU memory used | Headroom before an out-of-memory crash | Above 95% of GPU memory |
Data loader wait time | GPUs idle while input arrives | Any steady rise |
Checkpoint write duration | Storage pressure at each save | Longer with every save |
ECC and Xid errors | Error codes that flag failing GPU memory, hardware or drivers | Any uncorrectable error, at once |
Loss value | Whether training is still healthy | NaN, or a sudden jump |
Interconnect throughput | Gradient sync health | One node far below its peers |
Tag each metric with job, project and node so a slowdown can be traced to its owner. Those labels multiply series quickly, so plan for high-cardinality metrics from the start.
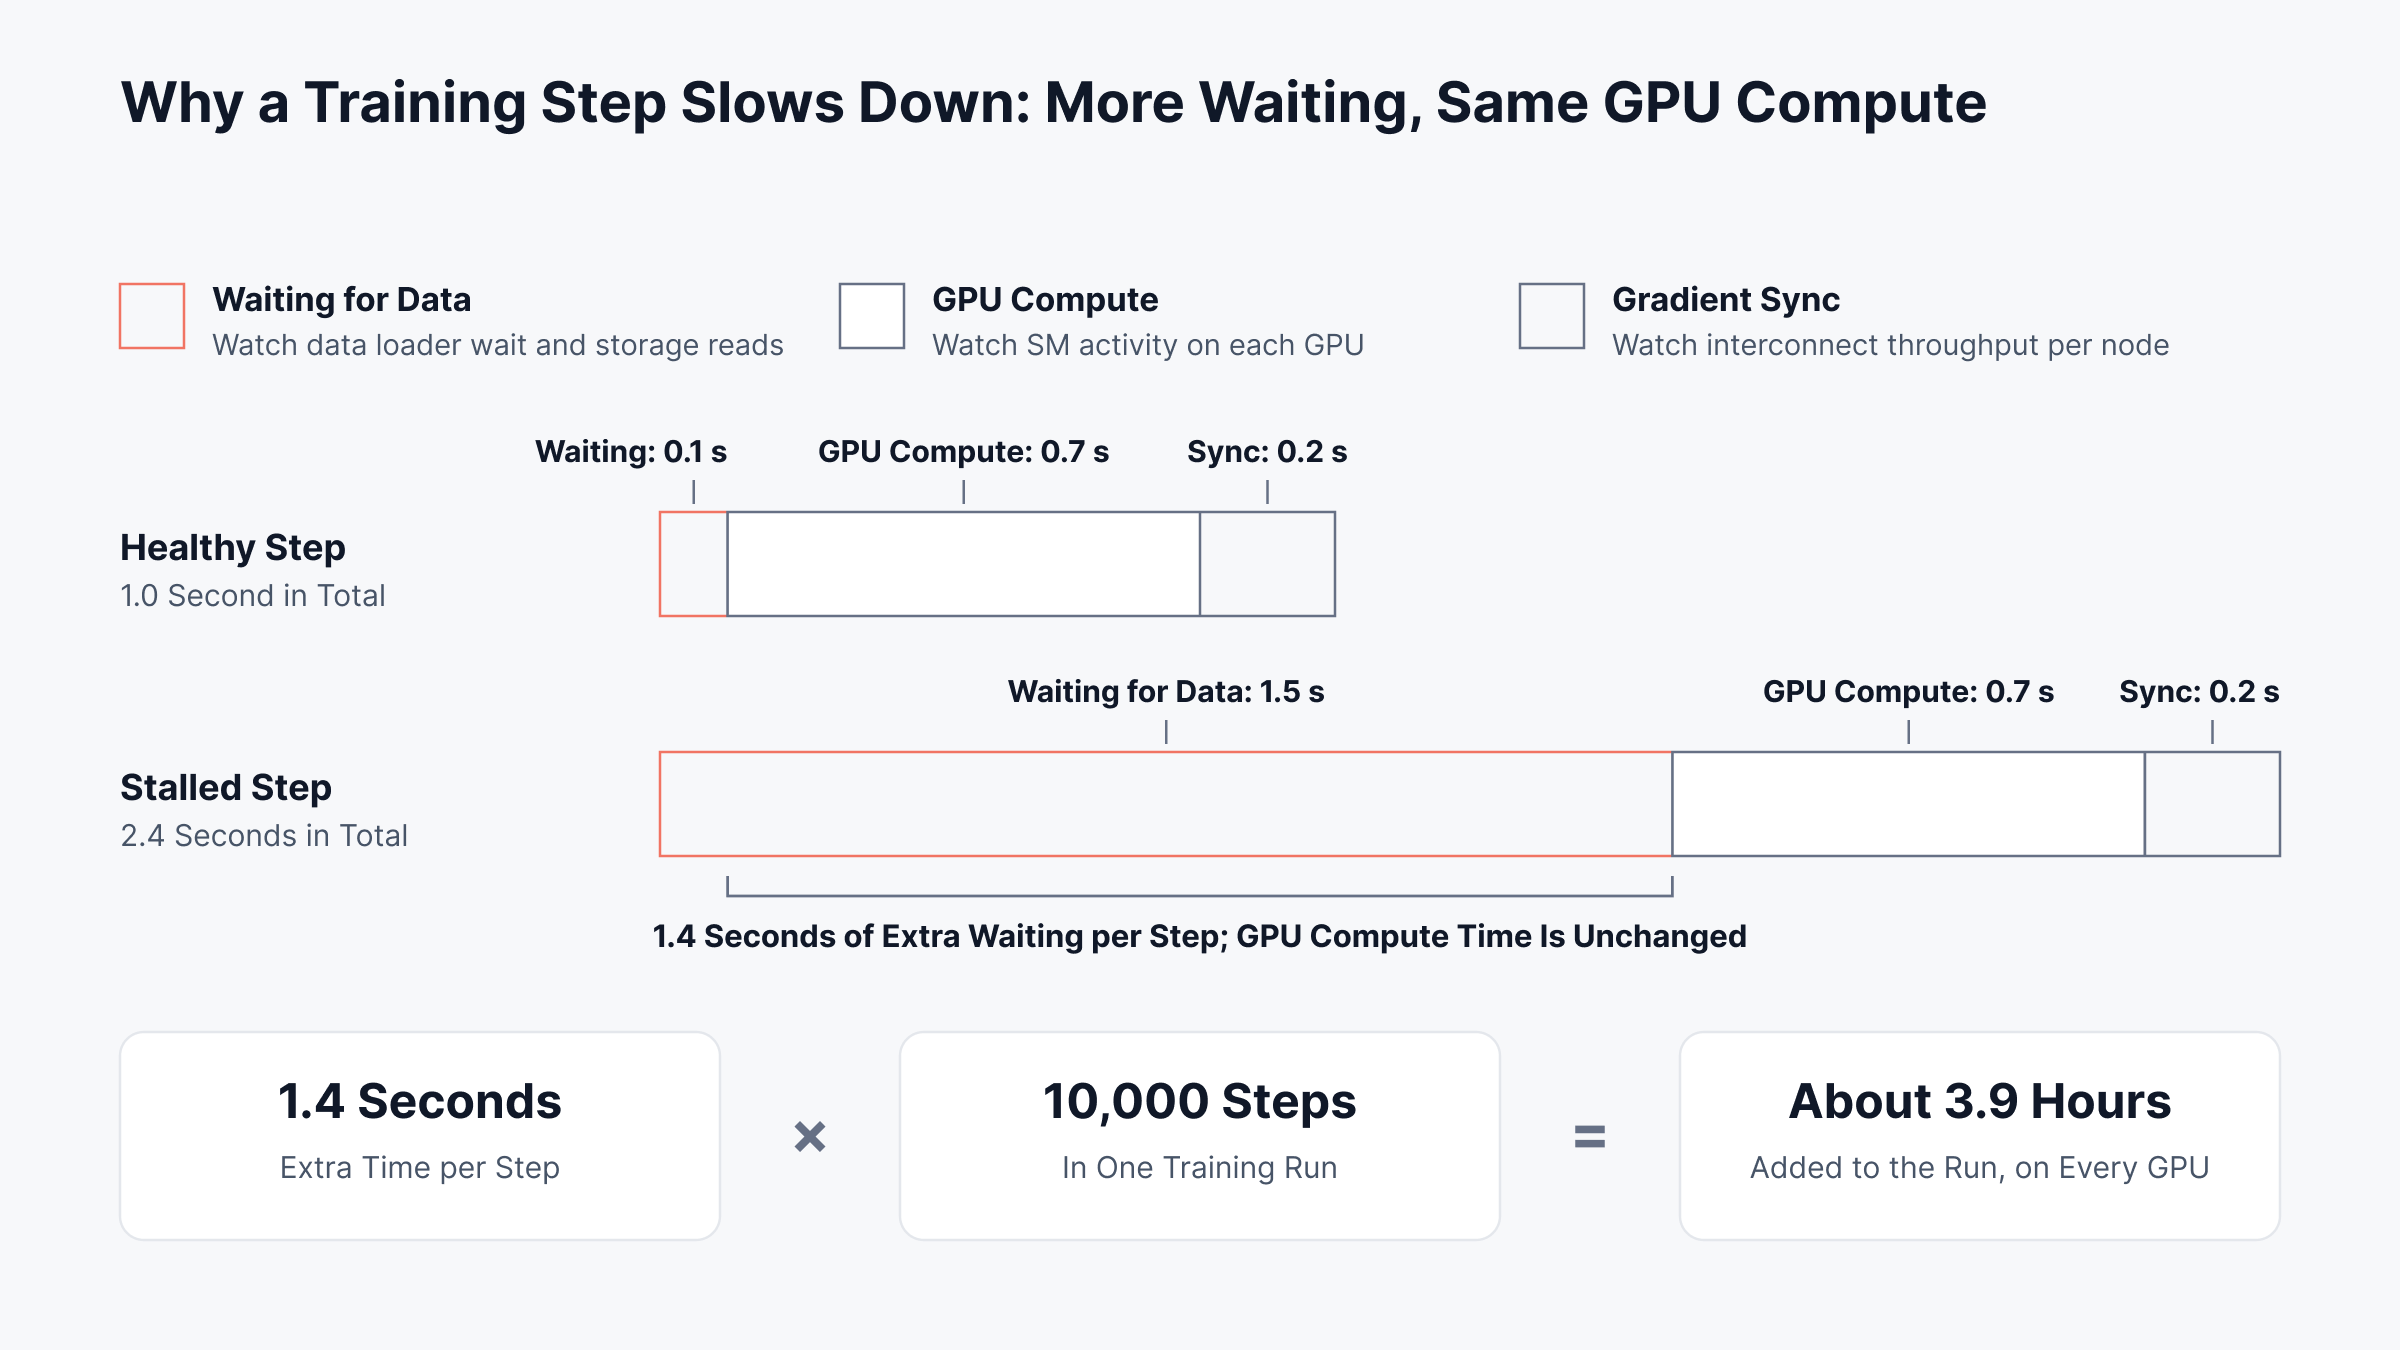
Step time is the first number to watch, because every stall shows up there before anywhere else. The example below splits one slow step into compute time and waiting time, then shows what the extra seconds cost across a full run.
Commands to Check GPU Health on a Training Node
When a job slows down, GPU monitoring starts on the node itself, and these commands give the on-call engineer first answers. nvidia-smi ships with the NVIDIA driver; dcgmi needs NVIDIA DCGM installed, and kubectl needs cluster access.
Command | What it tells you |
nvidia-smi --query-gpu=utilization.gpu,memory.used --format=csv -l 5 | GPU utilization and memory used, every 5 seconds |
nvidia-smi -q -d PERFORMANCE | Whether clocks are throttled, and why |
nvidia-smi -q -d ECC | Corrected and uncorrected memory error counts |
nvidia-smi topo -m | How GPUs connect: NVLink or PCIe paths |
dcgmi dmon -e 1002,1004 | SM activity and Tensor Core activity, closer to useful work |
journalctl -k -g Xid | Kernel log lines for GPU Xid errors |
kubectl describe node gpu-node-01 | GPUs allocatable versus already allocated |
If utilization reads high while SM activity stays low, kernels are running but using only part of the chip. Small batches or memory-bound operations are the usual suspects. In this case, test a larger batch size before you add GPUs.
A Five-Step Workflow for a Slow Training Job
Work through the layers in this order, because each step rules out one cause before you move to the next.
Confirm the slowdown: Step time against the job's own baseline, or the last run of the same config
Check GPU activity: Low SM activity plus rising data loader wait points to input; go to storage next
Check storage and network: Read throughput, file system latency and per-node interconnect traffic
Check the hardware: Throttle reasons, ECC counts and Xid errors on the slowest node
Check the job itself: Loss values, checkpoint duration and recent data changes; our guide on training data quality covers that upstream side
For example, suppose a fine-tuning job on an eight-GPU node slows down every half hour. GPU utilization drops close to zero for a few minutes each time, then recovers.
The timing matches checkpoint saves to a shared NFS volume that other jobs also write to. Saving checkpoints to local NVMe and copying them off in the background removes the stall, and every later run gets those GPU hours back.
How Can You Monitor AI Inference Jobs?
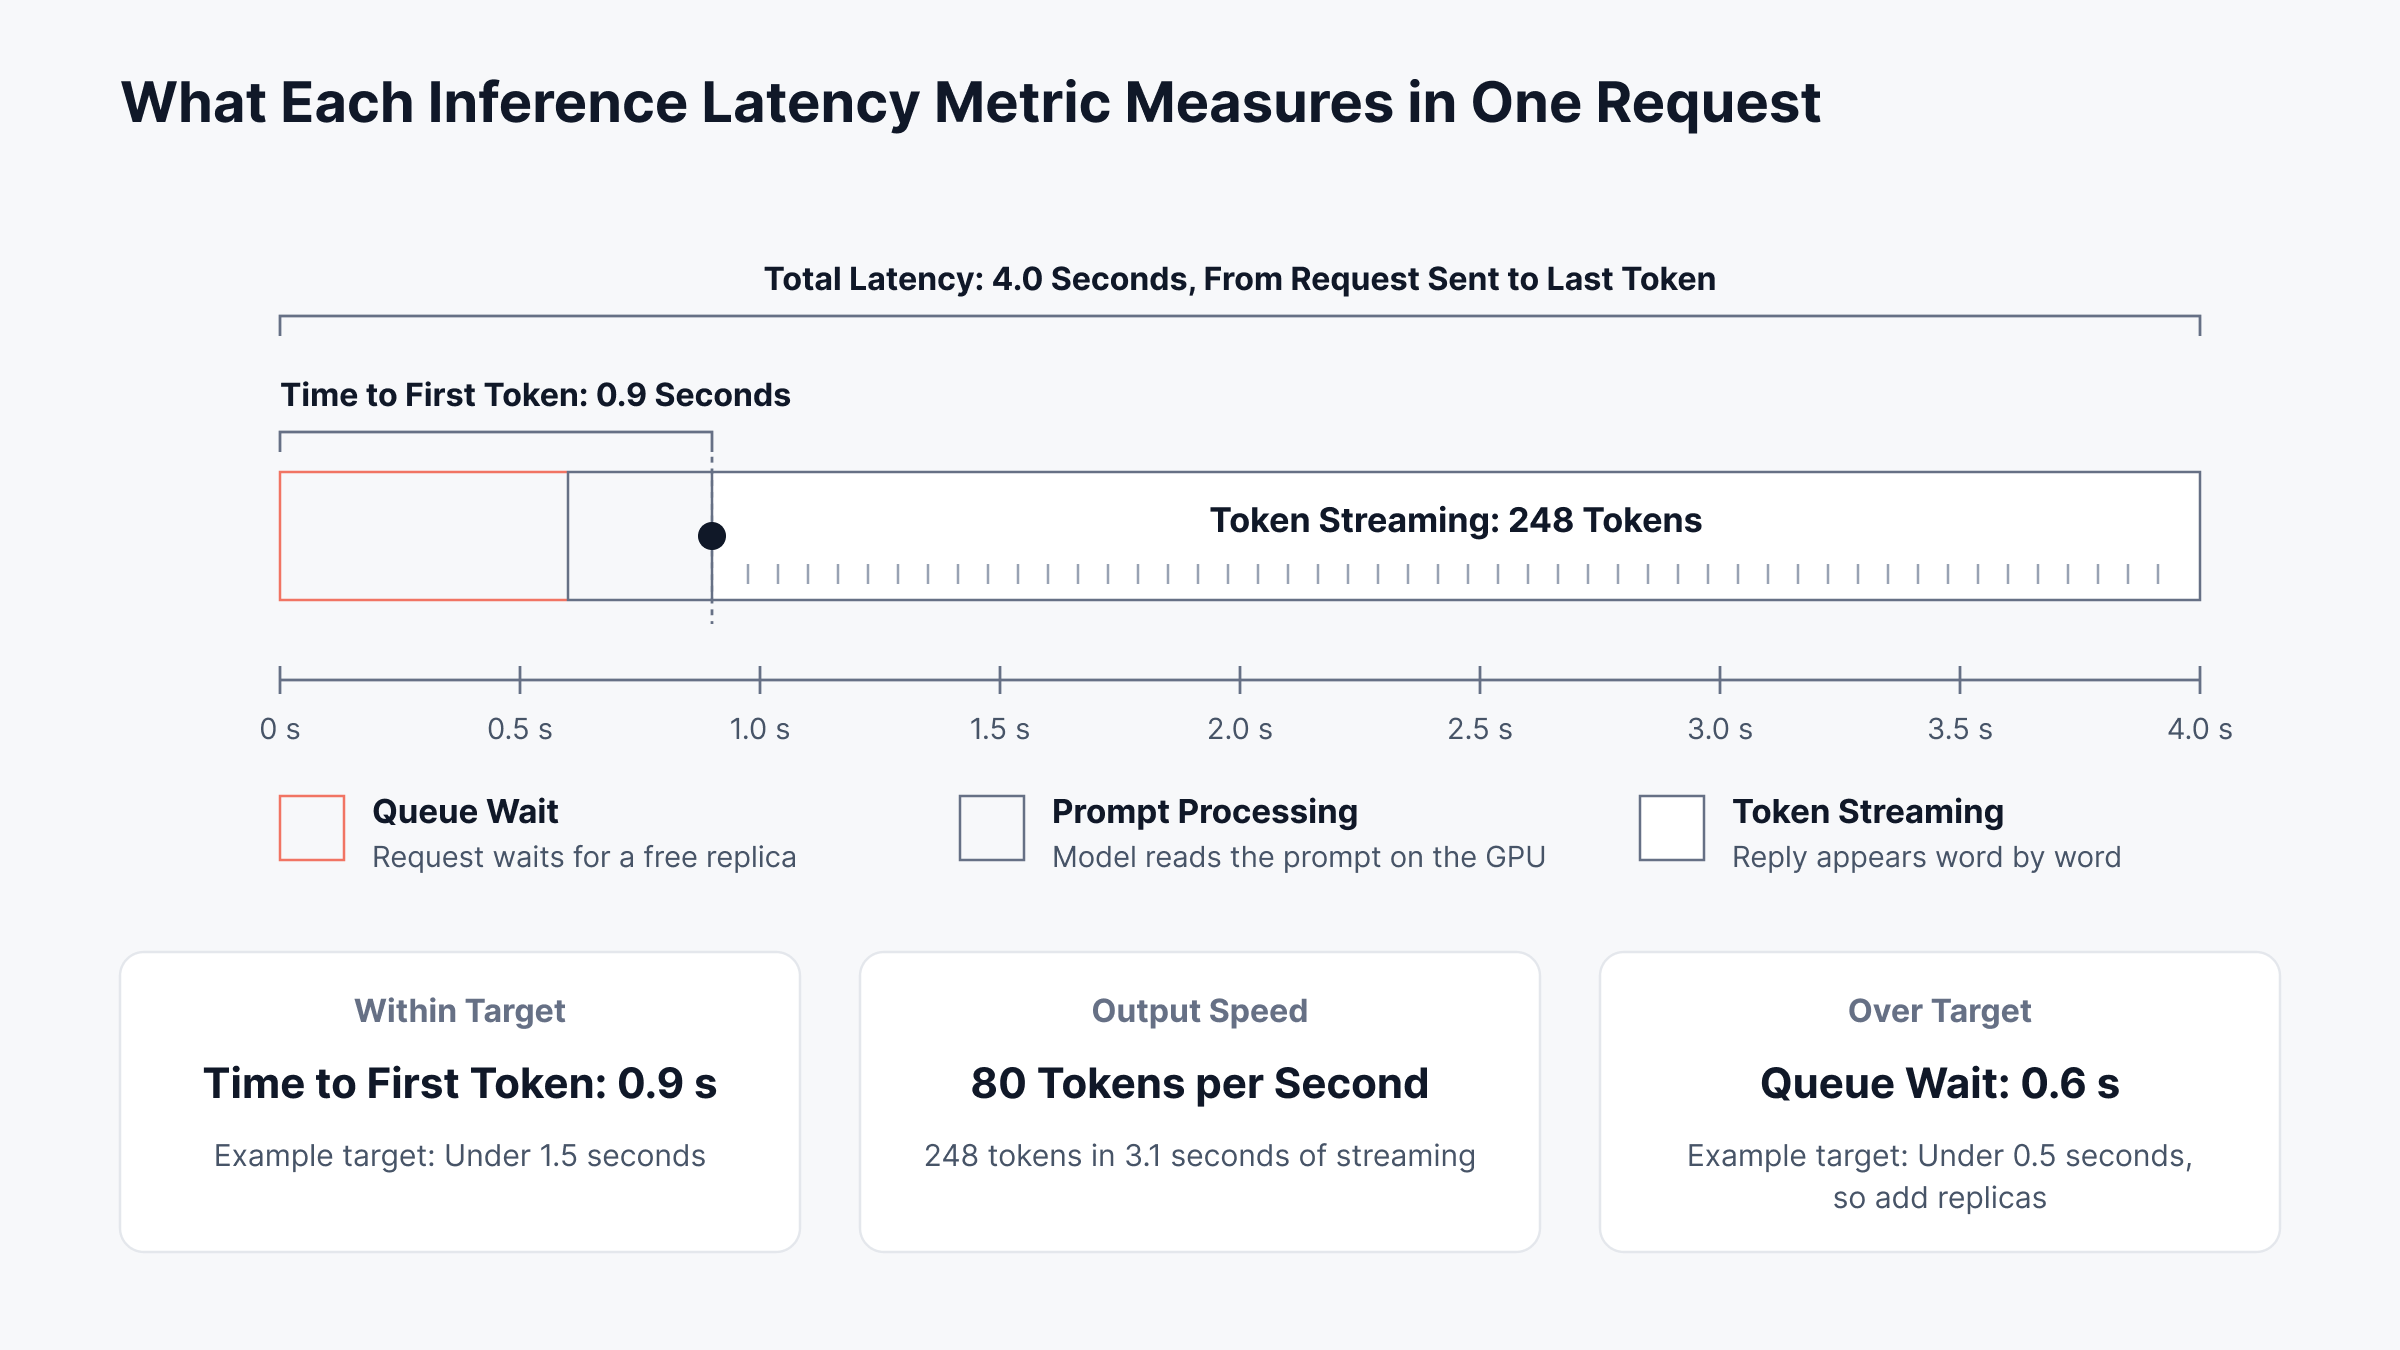
You monitor AI inference jobs by measuring what a user waits for: queue time, time to first token and streaming speed, plus the errors and cost behind each answer. Training is about finishing on time; inference is about every customer interaction, so the metrics shift toward user experience.
Inference Metrics That Track User Experience
These signals move first when an endpoint struggles. Prompt, token and answer-quality tracking at the application layer is covered in our guide to LLM observability.
Metric | What it tells you | Starting alert point |
Time to first token (TTFT) | "How long before the reply starts?" | p95 above your SLO for 5 minutes |
Output tokens per second | Streaming speed per request | Drops while traffic stays flat |
p95 and p99 latency | The slow tail users remember | Above your SLO for 5 minutes |
Queue wait time and depth | Demand against serving capacity | Rising while GPUs are already busy |
GPU memory in use (KV cache) | Room left to serve more users at once | Above 90%, sustained |
Error and timeout rate | Failed or rejected requests, including HTTP 429 and 5xx | Above 1% of requests |
Cost per 1,000 requests | Unit economics of the endpoint | Up week over week with flat traffic |
Averages hide the slow tail. p99 latency shows what the slowest 1% of requests go through, and that is usually where complaints start.
Several of these metrics overlap inside a single request, which is why they are easy to mix up in a review meeting. The timeline below lays one streamed reply against a clock and marks exactly what each metric measures.
Choosing the Right Signal for Inference Autoscaling
Consider a support assistant that slows down at month-end. The autoscaler watches CPU, which stays low because the work happens on the GPU; queue depth climbs, time to first token doubles and no new replicas start.
If queue depth keeps rising while CPU stays flat, switch the scaling trigger to queue depth or in-flight requests per replica. GPU utilization makes a weak trigger by itself, because a well-batched server can report near-full utilization even with spare capacity left.
How to Use Edge Computing for AI Workloads
Edge computing for AI workloads means running inference close to where data is produced, such as a camera on a factory line, a retail kiosk or a branch server. Knowing how to use edge computing for AI workloads starts with choosing what runs locally: latency-sensitive inference stays on site, while training stays central.
Observability changes once models leave the data center. Devices are many and small, links drop, and model updates roll out site by site, so watch:
Inference latency on the device itself
Model version per site, to catch half-finished rollouts
Uplink health and store-and-forward backlog
Device temperature and accelerator health
Our guide to edge AI covers the use cases and what they mean for IT operations. Whether models run at the edge or in a central cluster, most of them now run in containers.
How Can You Manage Containerized AI Workloads at Scale?
Managing containerized AI workloads at scale means treating GPUs as a scheduled, shared resource and watching the cluster for waste and queueing. Most questions about how to manage containerized AI workloads at scale come back to four controls:
GPU requests and quotas per namespace: A fair share per project, with no idle GPUs held for days
Separate node pools: Training and inference on different GPU nodes, so a large run never starves a live endpoint
Pending and restarting pods: Pending pods signal a capacity gap; repeated restarts or OOMKilled events signal memory sizing problems
Cost by namespace or label: GPU hours charged back to the product or department that used them
Kubernetes metrics such as pod restarts, failed pods per namespace and Job duration cover much of this list. Our primer on Kubernetes monitoring explains the basics.
How Can You Secure AI Workloads in Data Centers?
To secure AI workloads in data centers, protect the three assets attackers want most: training data, model weights and the GPU capacity itself. A practical answer to how to secure AI workloads in data centers pairs access control with observability:
Isolation: Separate namespaces, node pools or clusters for sensitive models
Weights and datasets: Role-based access, encrypted storage, logged reads
Patching: GPU drivers and container images on a tracked patch cycle
Unusual usage: GPU time on unknown jobs or at odd hours, a common sign of cryptomining
Egress: Large outbound transfers from training storage
Centralized log management brings audit logs from storage, Kubernetes and identity systems into one searchable place. With security in view, the remaining step is pulling every signal into one checklist.
What Belongs on an AI Workload Observability Checklist?
An AI workload observability checklist covers four layers, from the chip up to the service users call:
Hardware: GPU utilization and SM activity, GPU memory, temperature, throttle reasons, ECC and Xid errors
Platform: Node and pod status, pending pods, restarts, storage throughput, interconnect traffic
Job: Step time, throughput, loss, checkpoint duration, Job status and duration
Service: Time to first token, p99 latency, queue depth, error rate, cost per 1,000 requests
Once the checklist is in place, the next decision is what each warning should trigger. The table below maps common conditions to the first check and the next action.
If you see | Check first | Then |
Step time 20% above the run's median, with SM activity falling | Data loader wait and storage read throughput | Move hot data or checkpoints to faster local storage |
One node's interconnect throughput far below its peers | Link errors and the GPU topology on that node | Drain the node and rerun from the last checkpoint |
An uncorrectable ECC or Xid error | Kernel log entries for that GPU | Cordon the node so new work avoids it |
Queue wait rising while GPUs are already busy | Replica count and the autoscaling trigger | Scale on queue depth or in-flight requests |
Pods stuck in Pending | GPU quotas and node pool capacity | Release idle GPU allocations or add GPU nodes |
Cost per 1,000 requests rising with flat traffic | Utilization per replica | Consolidate under-used replicas |
Where traffic follows a daily or weekly cycle, set baselines before fixed thresholds; anomaly detection handles those patterns well. A static latency limit that suits the morning peak fires all night.
How Can Motadata ObserveOps Monitor Your AI Workloads?
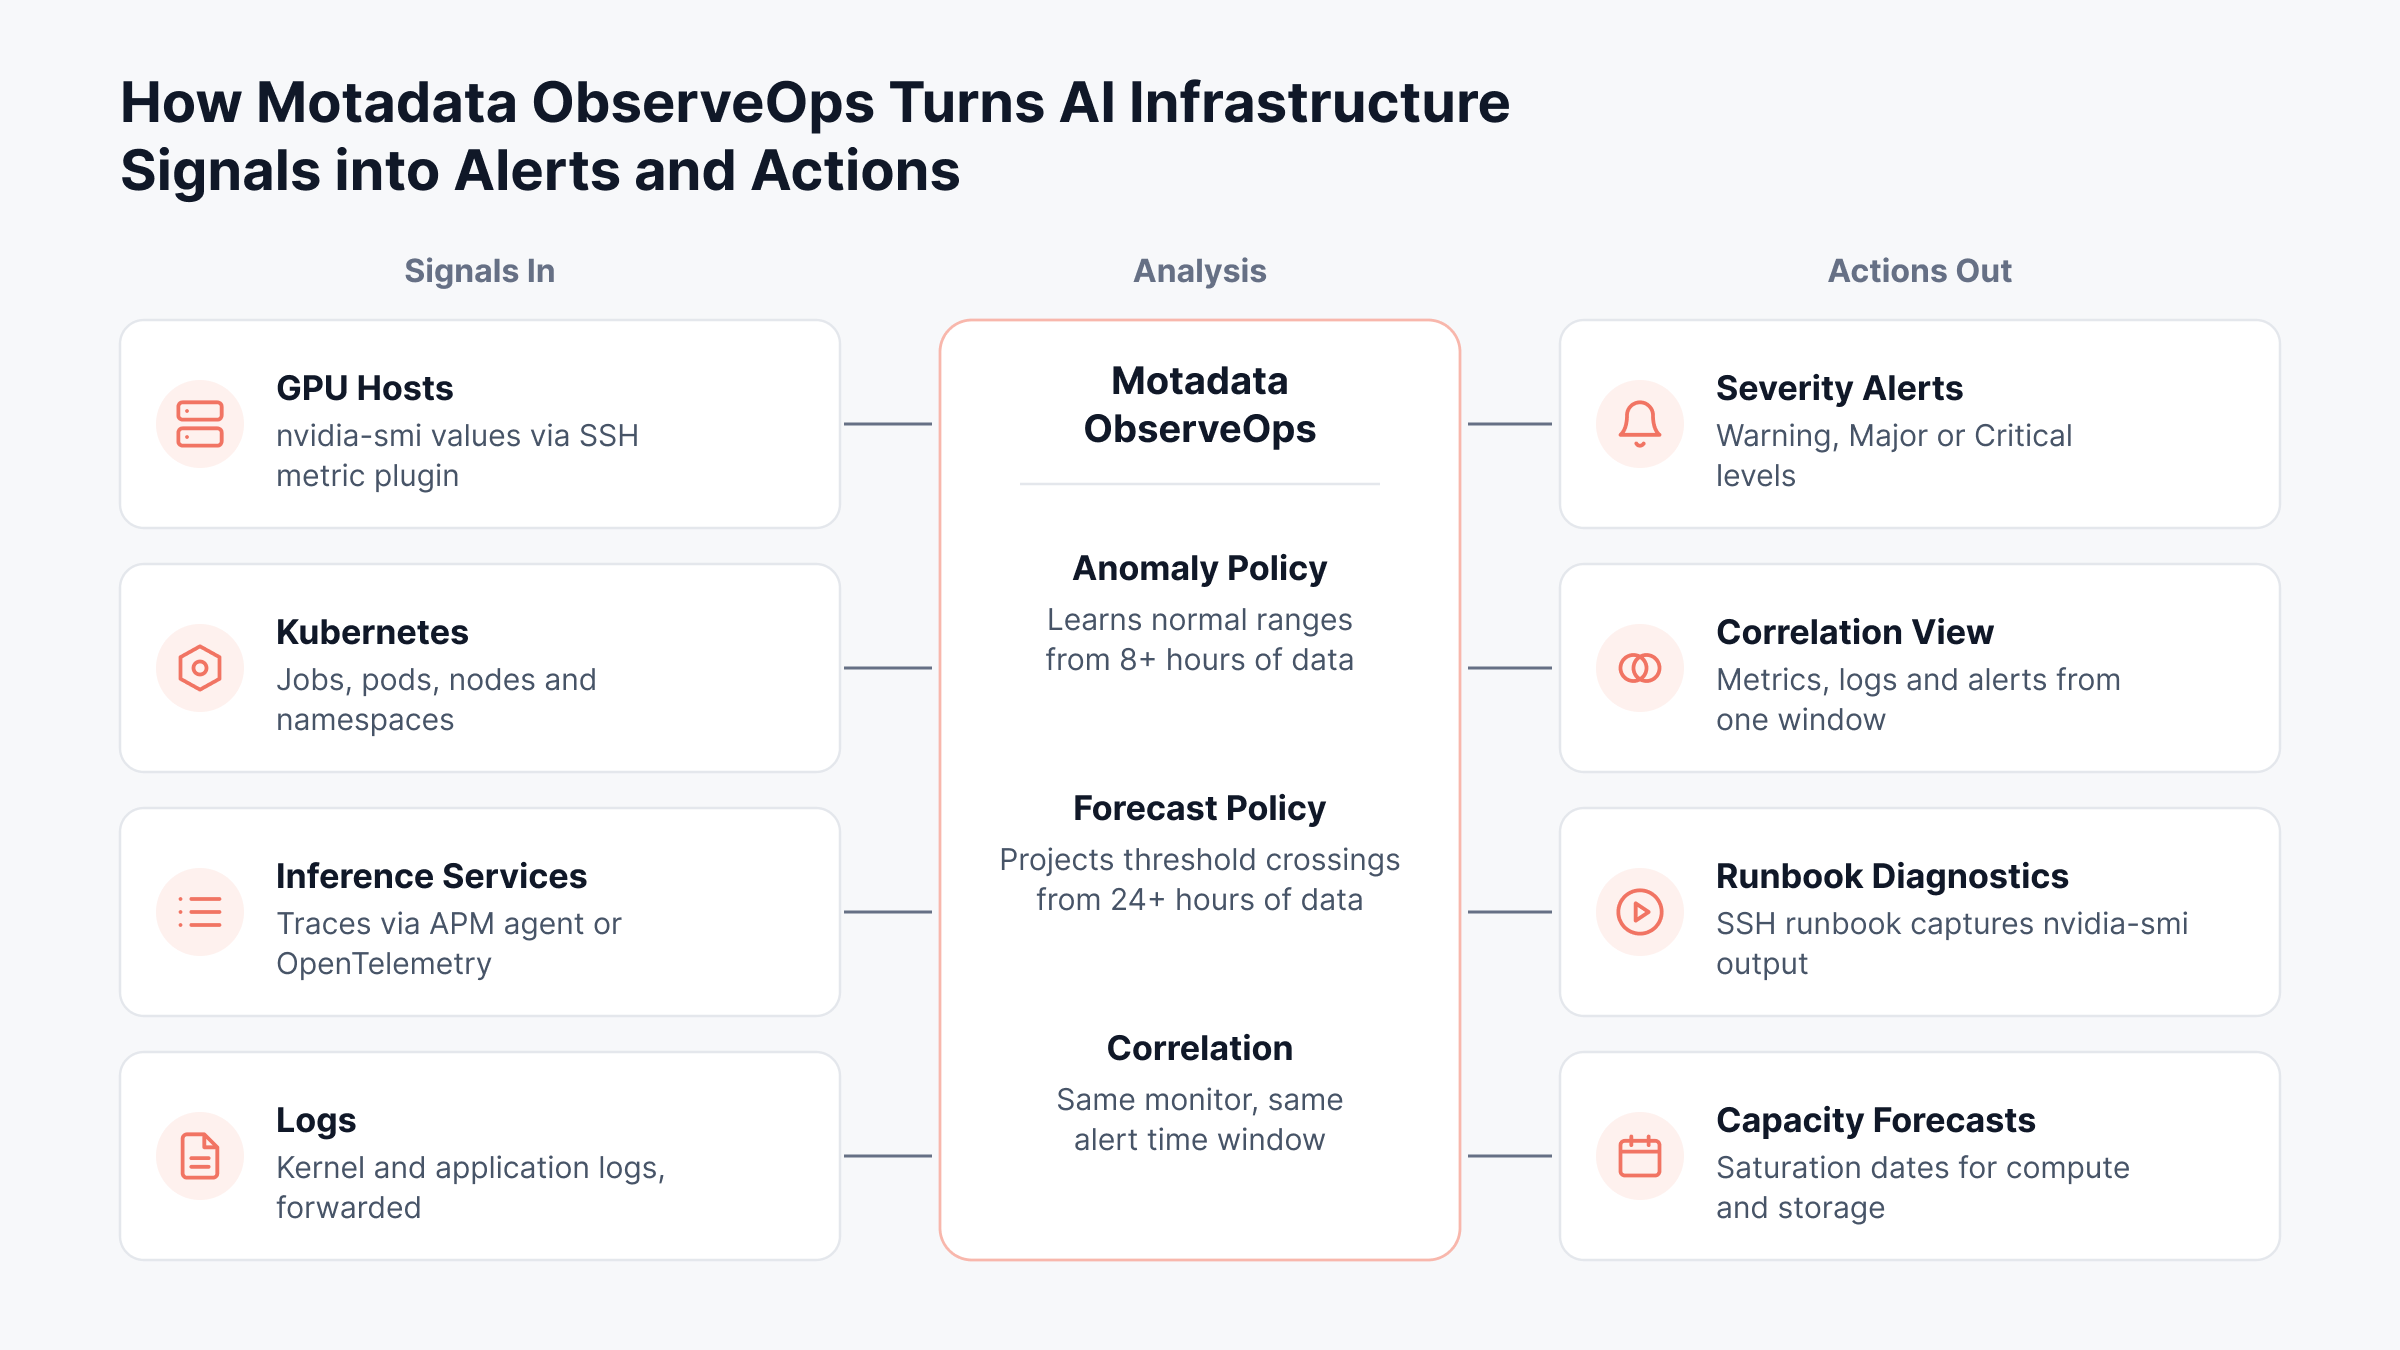
Motadata ObserveOps monitors AI workloads by bringing Kubernetes, GPU host, application and log signals into one platform, then applying baselines, forecasts and correlation to them. We built our hybrid infrastructure monitoring for mixed on-premises and cloud environments, and GPU clusters fit that pattern with expensive accelerators attached.
Getting started takes five steps in ObserveOps:
Discover the cluster: Under Settings > Discovery Settings, create an SSH credential profile for the Kubernetes master node, then a discovery profile of type Container Orchestration > Kubernetes, and select Save and Run
Register inference services: Under Settings > APM > Application Registration, choose the Kubernetes instrumentation type and deploy the Motadata Operator and APM agent with Helm
Add GPU counters: Under Settings > Plugin Library > Metric, create an SSH metric plugin that runs nvidia-smi on each GPU host
Set policies: Under Settings > Policy Settings > Metric Policy, create an Anomaly or Forecast policy for the counters that matter most
Attach a response: In the same policy, use Take Action to run a runbook when the alert triggers
Here is how each part maps to the checklist above.
1. Kubernetes Jobs, Pods and Nodes in One View
Our Kubernetes integration tracks nodes, pods, containers, namespaces, services and Jobs. Training runs submitted as Kubernetes Jobs report status, start and completion times and duration. It also reports pod restarts, pending and failed pods per namespace, and CPU and memory usage against requests and limits.
2. GPU Metrics Collected Through SSH Metric Plugins
GPU counters come from vendor tools such as nvidia-smi, so we collect them with custom metric plugins. In Settings > Plugin Library > Metric, choose SSH, add the nvidia-smi query as the SSH script and write a short Go or Python parsing script that turns its output into metrics.
Click Test against a GPU host, then Create Metric. Once the plugin is assigned, its values are polled on the next cycle and show up as ObserveOps metrics next to the host's other counters.
3. Inference Services Traced Without Code Changes
Many inference APIs are Python services running on Kubernetes. Our Kubernetes APM instruments these services through a Kubernetes Operator and OpenTelemetry-based agents, without code changes, and supports Python, Java, Go, Node.js, .NET and C++. Once a service is registered, its traces appear in APM Explorer, so you can follow each request from entry to execution.
We built our OpenTelemetry support so that traces from services already instrumented with OpenTelemetry reach ObserveOps APM without a translation layer.
4. Baselines and Forecasts Where Fixed Thresholds Fall Short
Inference traffic rises and falls daily, so one fixed latency threshold either fires all night or misses the morning peak. Our Anomaly policy, created under Settings > Policy Settings > Metric Policy, learns each metric's expected range from at least 8 hours of polling data and evaluates every 15 minutes; Sample Lookup and percentage settings decide whether anomalous samples raise a Warning, Major or Critical alert.
The Forecast policy needs at least 24 hours of history and alerts when a metric is projected to cross a value you set, such as storage filling up within the forecast window. Our capacity planning capability adds saturation date predictions for compute and storage, which is the number budget owners ask for.
5. From Alert to Correlated Context and Runbook Action
When an alert fires, the Correlation button opens four tabs for the same monitor and alert window:
Correlated Metrics: Process-level CPU, memory, I/O and network charts from the same device
Correlated Logs: Logs from that monitor, once log forwarding is on
Correlated Alerts: Other metric alerts active on the monitor at the time
Log Pattern: Recurring patterns in those logs, with count and severity
With kernel logs forwarded, a slow training node and its Xid errors appear in the same view. Under Take Action, the policy can also run a runbook as the alert triggers; an SSH runbook, for example, can capture nvidia-smi output from the affected host, so the diagnostics are ready before anyone logs in.
Seen together, these pieces form one path from a raw GPU or Kubernetes signal to an alert someone can act on. The overview below shows which signals ObserveOps takes in, what it does with them and what comes out the other side.
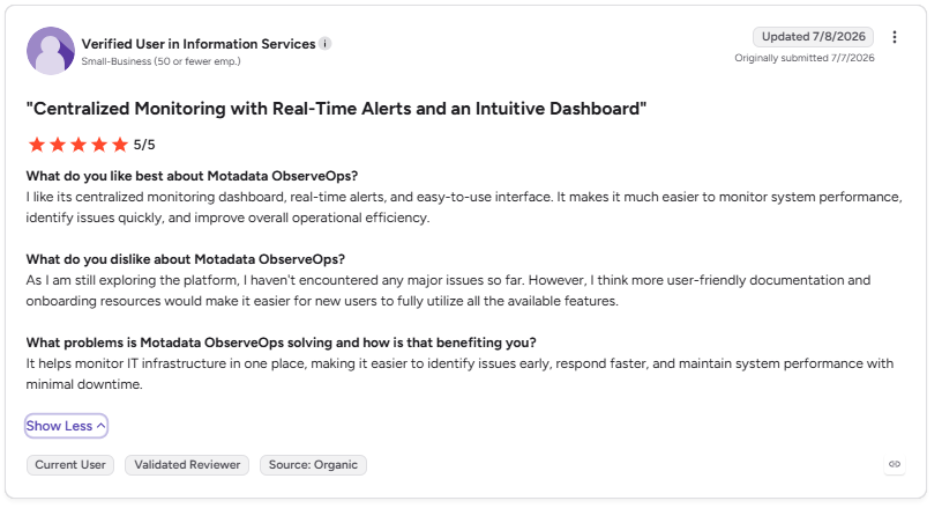
This is what one of our clients says about Motadata ObserveOps on G2:
Move from Host Checks to Job-Level AI Workload Visibility with Motadata ObserveOps
AI workloads put the most expensive hardware in the data center behind the quietest failure modes. Many monitoring setups stop at the host, which is how a stalled training job or a slow endpoint can look healthy for hours while the bill keeps growing.
Three places to start:
Training: Track step time and GPU utilization per job, tagged by project
Inference: Put time to first token and queue wait on every endpoint, measured against an SLO
Spend: Report GPU hours and cost per 1,000 requests by project each month
ObserveOps carries the view down to Kubernetes Jobs, GPU counters, traced inference requests and capacity forecasts, with correlation and runbooks attached to each alert. Answer quality is one thing no infrastructure platform can judge, ours included; model evaluation stays with the ML engineers. Everything underneath it, from GPU health to cost per request, belongs in one place, and that is the part we cover.
FAQs
What are some examples of AI workloads?
Common examples include fraud scoring on payments, demand forecasting, support chatbots, defect detection on camera feeds and document classification. Each one combines data processing, model training and inference, although the balance between those stages differs widely from one use case to the next.
What is the difference between training and inference workloads?
Training builds a model by running large datasets through it for hours or weeks, so it is judged on progress and GPU efficiency. Inference serves the finished model to users, so it is judged on latency, error rate and cost per request.
Which GPU metrics matter most for AI workloads?
Start with GPU utilization, SM activity, GPU memory used, temperature, throttle reasons and ECC or Xid errors. Utilization alone can mislead, so pair it with step time for training jobs and with queue wait or time to first token for inference.
Can you monitor AI workloads running on Kubernetes?
Yes. Kubernetes exposes Job status and duration, pod restarts, pending pods and resource usage, which together cover much of the platform layer. Motadata ObserveOps tracks these alongside GPU host metrics collected through custom plugins and traces from Python inference services.
How do you choose a storage architecture for AI workloads?
Match storage to each access pattern: fast parallel reads for training data, burst write capacity for checkpoints and quick model loading for inference. Watching read throughput, latency and checkpoint duration shows whether storage holds GPUs back, and Motadata ObserveOps can forecast when that capacity runs out.
Author
Poonam Lalani
Content Strategist
Poonam Lalani is a B2B content strategist and writer with a background in computer engineering and experience across enterprise technology domains, including AI, cloud, DevOps, data engineering, and IT operations. She specializes in creating research-driven content that simplifies complex ideas and supports product education, thought leadership, and business growth.