Edge Monitoring Guide for Remote Sites and Devices
How do you find out that a store, a plant or a clinic has a problem when the first report comes from a customer at the counter? At many distributed businesses, that call is the earliest alert IT receives. By then the outage already has a cost, and someone still has to work out which device at the site caused it.
The pattern repeats at every location that runs without local IT staff. A WAN circuit degrades overnight, a UPS battery ages out, or an edge server fills its disk while the dashboard at head office shows nothing unusual. From the center, each site appears healthy until the moment it stops working.
Edge monitoring gives those locations the same visibility as the data center, and it is the foundation of remote infrastructure management. In this blog, you will see what edge monitoring is, why it matters to the business, how its architecture copes with weak links, which metrics and alert rules count at a remote site, and how to roll it out across hundreds of locations.
What is Edge Monitoring?
Edge monitoring is the practice of collecting health, performance and availability data from devices and sites that run outside the central data center, then analyzing and alerting on that data from one place. Collection happens close to the devices, so a site keeps its record even when its connection to head office is weak.
The edge covers more locations than most inventories show:
Branch offices and retail stores: Switches, firewalls, wireless access points, point-of-sale servers and the WAN circuits that connect them
Plants, warehouses and depots: Edge servers, industrial gateways, scanners and factory-floor networks
Micro data centers and edge server rooms: Compute that runs local applications or AI models close to users
Unstaffed locations: Cell sites, kiosks, pumping stations and other places nobody visits on a schedule
Each of these locations earns revenue, serves customers or keeps production running. That's why the monitoring question is less about one device and more about whether the whole site can do its job.
Edge Device Monitoring vs Edge Computing Monitoring
The three terms overlap, but each one covers a different layer of the site:
Edge device monitoring: Tracks the hardware, such as availability, CPU, memory, interfaces and power
Edge computing monitoring: Watches the workloads on local compute, such as store applications, containers, industrial IoT platforms and edge AI models
Edge infrastructure monitoring: Covers the circuits, power and cooling that keep the whole site running
For example, if a store's point-of-sale application slows down while the server's CPU looks normal, edge computing monitoring shows the delay that device metrics miss. Most organizations need all three layers, because a healthy server behind a failed circuit is still an outage.
Our earlier piece on edge network monitoring covers the network side of this picture.
What is an Edge Monitoring System?
An edge monitoring system is the set of collection points, local storage, transport and central analysis that keeps distributed sites observable. It usually has five parts:
Collection points: Agents on edge servers and collectors at each site that poll local devices over SNMP, the standard protocol network devices use to report status, or over vendor APIs
Local buffer: Storage at the agent or site that holds data while the uplink is down
Transport: An encrypted, bandwidth-aware path from each site to the central platform
Central analysis: Thresholds, baselines, anomaly detection and correlation across every site
Workflow handoff: A route from alert to ticket, owner and fix
The design is a form of distributed monitoring, with collection spread across the sites and analysis kept in one place. The next question is how far that analysis should go.
How is Edge Monitoring Different from Edge Observability?
Edge observability extends monitoring from known failure checks to open questions about why a site behaves the way it does. The difference starts to matter once a fleet grows past the point where anyone remembers each site's quirks.
Aspect | Edge monitoring | Edge observability |
Main question | Are the site and its equipment working? | Why is this site slower or less stable than similar sites? |
Data used | Metrics, availability checks and device alerts | Metrics, logs, traffic flows, topology and path data, correlated |
Typical output | Threshold alerts and uptime reports | Root-cause leads and comparisons across sites |
Best fit | First rollouts and uniform fleets | Large, mixed fleets with recurring unexplained issues |
For example, if checkout at one store runs slower than at similar stores, flow records and path history can show whether the cause is the circuit, the server or the application. Most programs start with monitoring and then add logs and traffic flow records site by site, as each link's bandwidth allows.
Why does Edge Monitoring Matter for the Business?
Edge monitoring matters for the business because more revenue, service and production now depend on sites where IT has no staff, and downtime at those sites turns straight into lost sales or output. For example, a store that loses its link during the busiest trading hours can't take card payments, so every minute of the outage is revenue the business doesn't recover.
According to IDC, worldwide spending on edge computing reached $265 billion in 2025 and is expected to nearly double by 2029, so the number of locations to protect keeps growing. For leadership, the value shows up in a handful of outcomes:
Fewer site visits: Engineers diagnose faults remotely and travel only when hardware needs replacing, with the right part in hand
Shorter outages at revenue sites: A silent store or clinic raises an alert in minutes, before staff or customers call it in
Better conversations with carriers: Latency and loss history per circuit gives facts to bring to providers about their service levels
Faster site openings: A monitoring template per site type lets a new location go live fully monitored on its first day
Planned spending: Capacity trends show which sites need more bandwidth or new hardware before they fail
Take a 150-store grocery chain where each unplanned site visit means a day of travel for one engineer. If edge monitoring lets the support desk fix even a share of those faults remotely, the savings recur every month, and the stores that stay online keep trading.
Why is Edge Infrastructure Harder to Monitor than a Data Center?
Edge infrastructure is harder to monitor because it depends on shared, unreliable links, at sites with no technical staff, under power and room conditions nobody controls. Each of these constraints lets a fault go unnoticed for longer at the edge, so the monitoring design has to account for all five.
1. WAN Links Fail More Often than the Devices Behind Them
Most edge outages begin in the connection. Uptime Institute's 2026 outage analysis finds that network problems remain the most frequently reported cause of IT service disruptions, and that fiber and connectivity failures are rising and tend to last longer. Third-party network providers are a leading contributor, so the fault is often on a circuit the organization doesn't operate.
That's why edge network monitoring has to measure the link itself: latency, jitter and packet loss in both directions. In ObserveOps, WAN Link monitoring takes these measurements with IP SLA probes sent from the site router. Our guide to WAN link monitoring covers those measurements in detail.
2. Edge Sites Have No One on Site to Check
At a data center, an engineer can walk to the rack. At a store or a depot, the nearest technician may be hours away, and each unplanned visit costs a working day. The same Uptime research shows how quickly the bill grows: 57% of survey respondents say their most recent major outage cost more than $100,000.
So remote monitoring has to start inside the site, where the devices are.
3. Monitoring Traffic Competes with Business Traffic
A branch circuit already carries card payments, voice calls and cloud applications. Monitoring traffic has to fit alongside them, especially after a site fails over to a slower backup connection. Shipping every raw log line to head office can take more of that link than the business can spare.
4. Power and Cooling at Edge Sites Go Unwatched
Edge equipment often runs in a back room or a closet without cooling alarms. A UPS that switches to battery several times a week is an early warning of a power problem, provided something reads it. UPS monitoring and room temperature belong in the same view as the network.
5. Edge Site Configurations Drift Over Time
Sites start from a standard build and then change. A contractor adds a switch, a vendor swaps a gateway, or an address range moves. Without automatic discovery and per-site templates, the monitoring inventory falls behind the hardware within months.
How does Edge Monitoring Work?
Edge monitoring works by collecting data close to each device, keeping it locally when the uplink drops, and sending a filtered stream to a central platform that analyzes it and raises alerts. Because collection happens inside the site, a WAN outage delays the data on its way to head office without erasing it.
The Three Tiers of an Edge Monitoring Architecture
Most designs follow three tiers:
Device tier: Agents on edge servers report CPU, memory, disk and services, while switches, UPS units and sensors answer polls and push traps, which are short alerts a device sends on its own
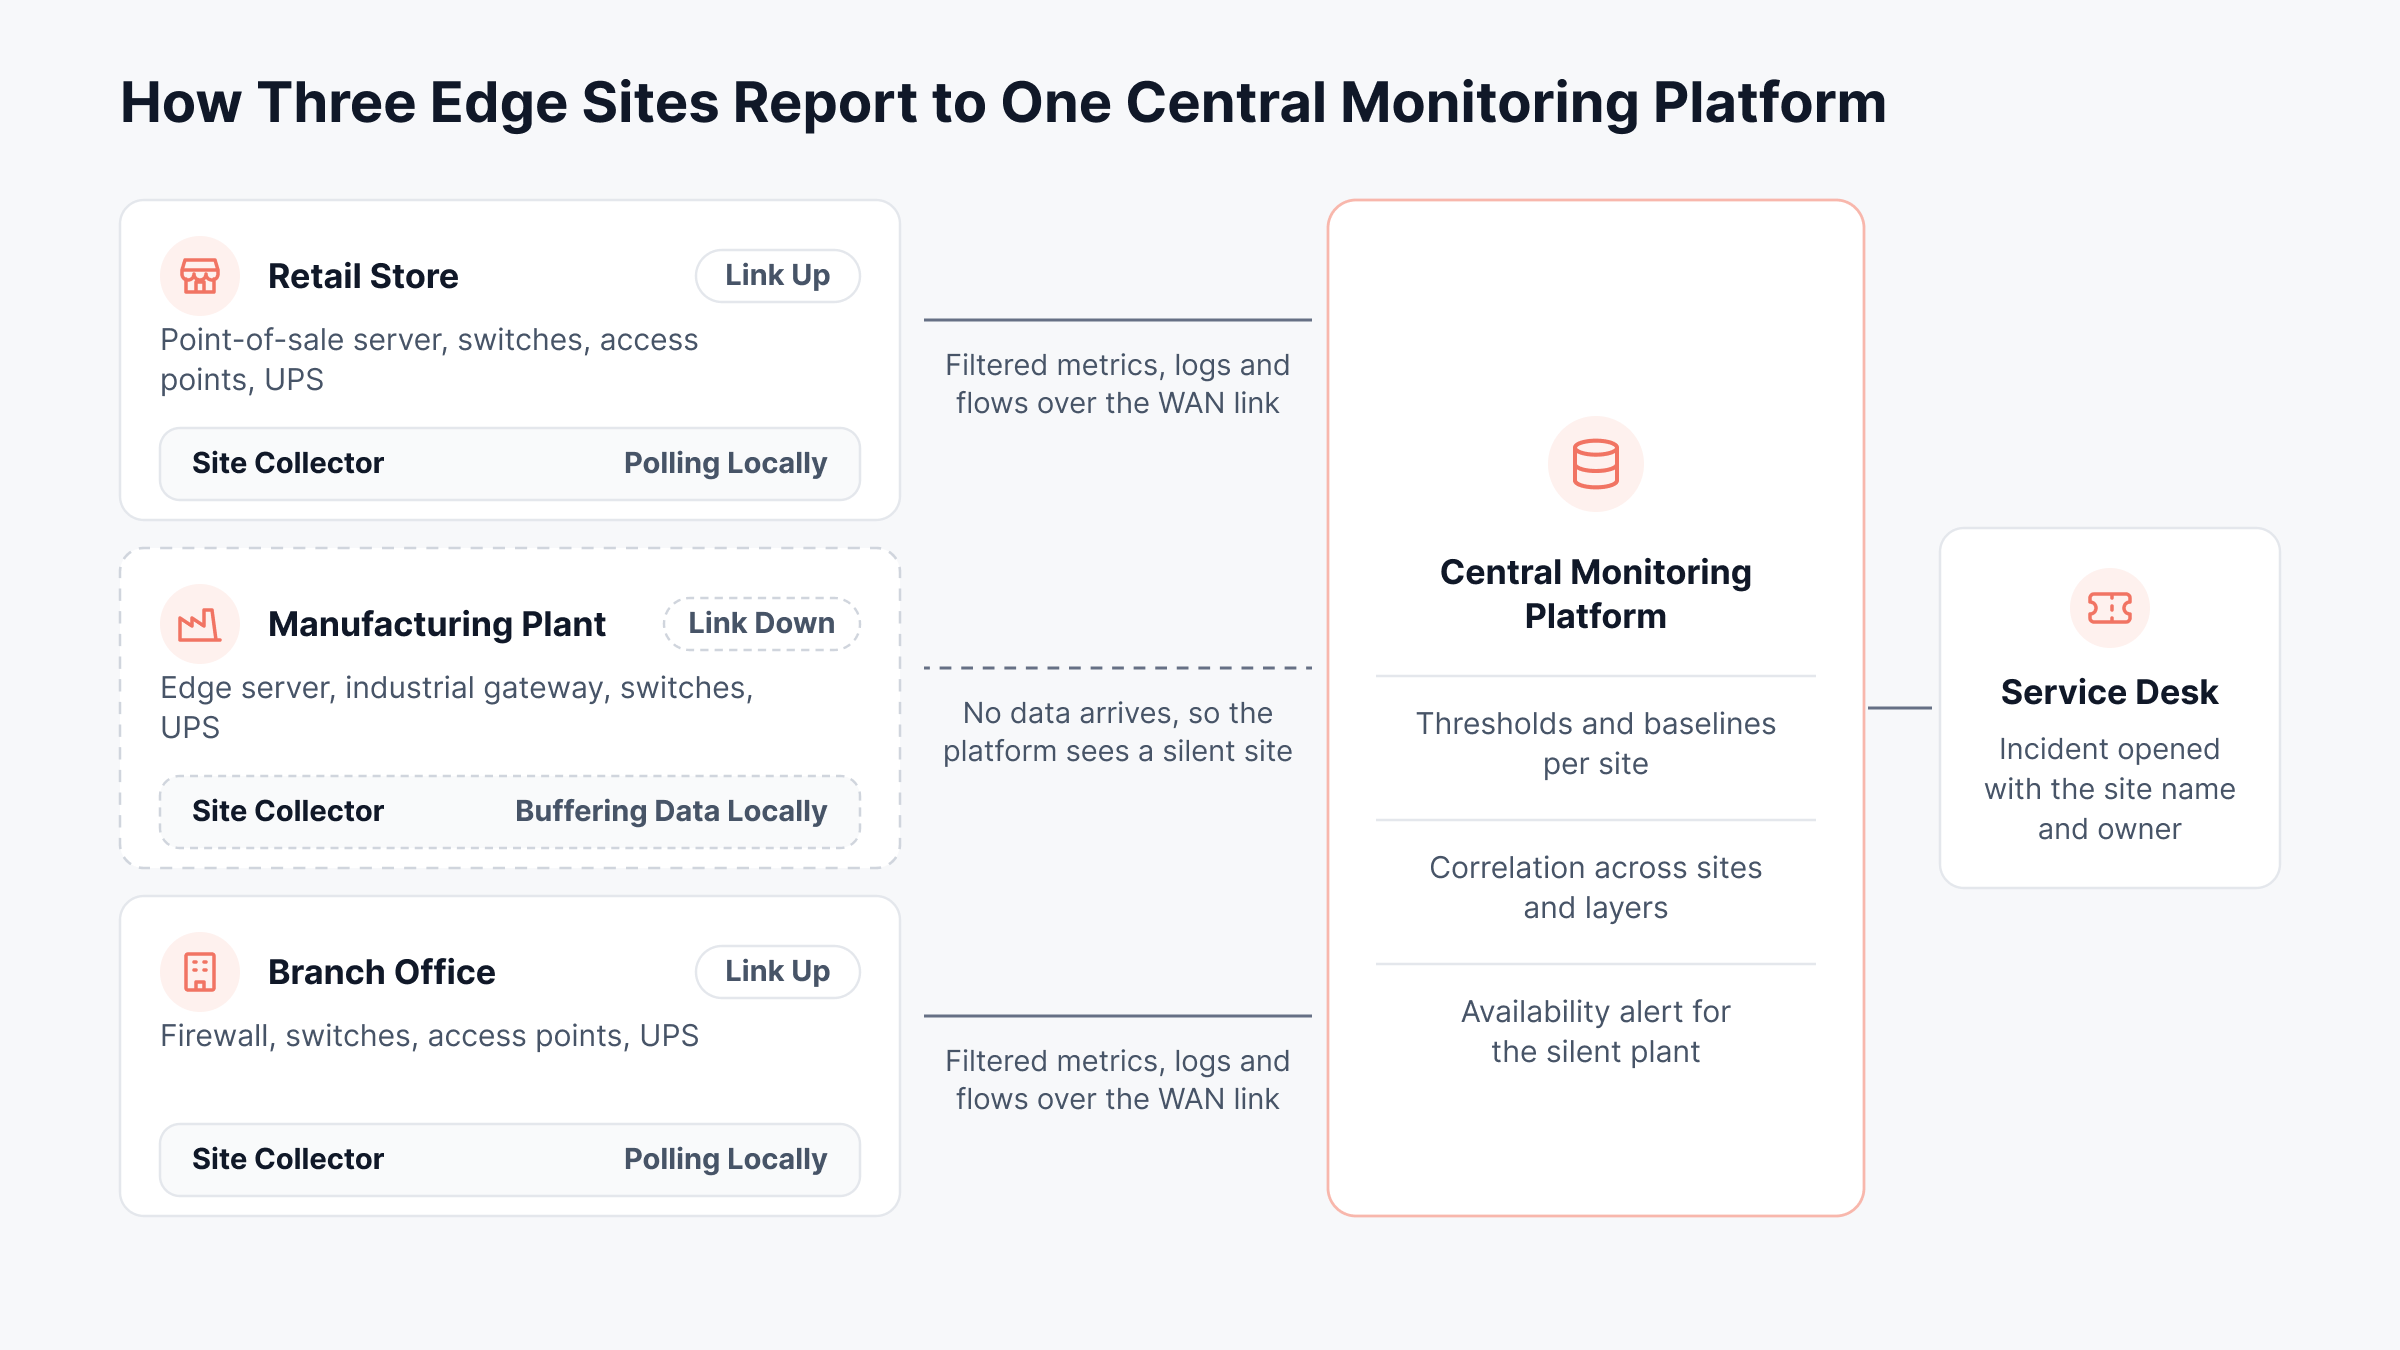
Site tier: A collector at the site polls local devices, receives traps and logs, and forwards results upstream, so polling traffic stays on the local network
Central tier: The platform stores data, applies thresholds and baselines, correlates events across sites and hands incidents to the service desk
A collector at each site keeps most polling traffic off the WAN. The diagram below follows three typical sites into one central platform, including a plant whose link is down.
How Store-and-Forward Protects Data During Outages
The site tier only helps if it keeps data through an outage, and that's the job of store-and-forward. The agent or collector holds data locally while the uplink is down and sends it once the link returns, so the charts show what happened at the exact moment the site needs investigating.
Size the buffer to the longest outage you expect. If a backup circuit sometimes takes a full working day to restore, a buffer measured in minutes won't cover it. Plan the catch-up as well, since a site that reconnects and pushes a day of data at once can flood a slow link just as the business needs it back.
IoT in Monitoring with Edge Gateways
The role of IoT in monitoring with edge gateways comes down to volume. Sensors report often and in small packets, so the gateway aggregates readings, forwards summaries and raises local alerts when a value crosses a limit.
That makes the gateway a device to monitor in its own right, including its uplink, its buffer and its own health. The IoT monitoring guide covers sensor-level metrics.
Which Metrics Should You Track at Edge Sites?
The metrics to track at edge sites cover reachability, the WAN link, compute, network devices, power, environment and the monitoring pipeline itself. Treat the values below as common starting points and tune them after two weeks of baselining, since normal behavior varies by site type.
Layer | Metrics to track | Common starting alert point |
Site reachability | Ping response, time since last data received | No data for 5 minutes, or 3 failed polls in a row |
WAN link | Latency, jitter and packet loss in both directions | Loss above 1%, or latency 50% over the site baseline for 10 minutes |
Edge servers | CPU, memory, free disk, critical services | Disk above 85%, or a service down for 2 polls |
Network devices | Interface status, errors, discards, utilization | Errors rising for 15 minutes, or utilization above 80% |
Power | UPS on battery, battery runtime remaining | Any switch to battery, or runtime under 15 minutes |
Environment | Rack or room temperature | Above the equipment vendor's rated range |
Monitoring pipeline | Collector or agent heartbeat, buffer usage | Heartbeat missed for 2 intervals |
The last row is the one most often skipped. When a collector stops reporting, every device behind it goes quiet at once, and that silence should raise an alert of its own as part of uptime assurance for the site.
Device metrics tell engineers what broke. Leadership needs a few fleet-level numbers that show whether network availability is improving across all sites:
Sites reporting: Share of sites that sent data in the last 15 minutes
Time to detect a site outage: Minutes from failure to alert, tracked per site
Sites on backup links: Locations running on their failover circuit right now
Avoidable site visits: Visits where the fault turned out to be fixable remotely
Alerts per site per week: A rising count that points to noisy rules or a failing site
In ObserveOps, Geo Map gives leadership that fleet view directly, with each cluster showing the worst status among the sites in its region.
How Much Bandwidth does Edge Monitoring Use?
Edge monitoring uses little bandwidth for metrics and a great deal for raw logs, so the collection plan matters more than link speed. This matters because monitoring traffic shares the circuit with payments and voice, so an oversized log stream can slow the business applications it is meant to protect.
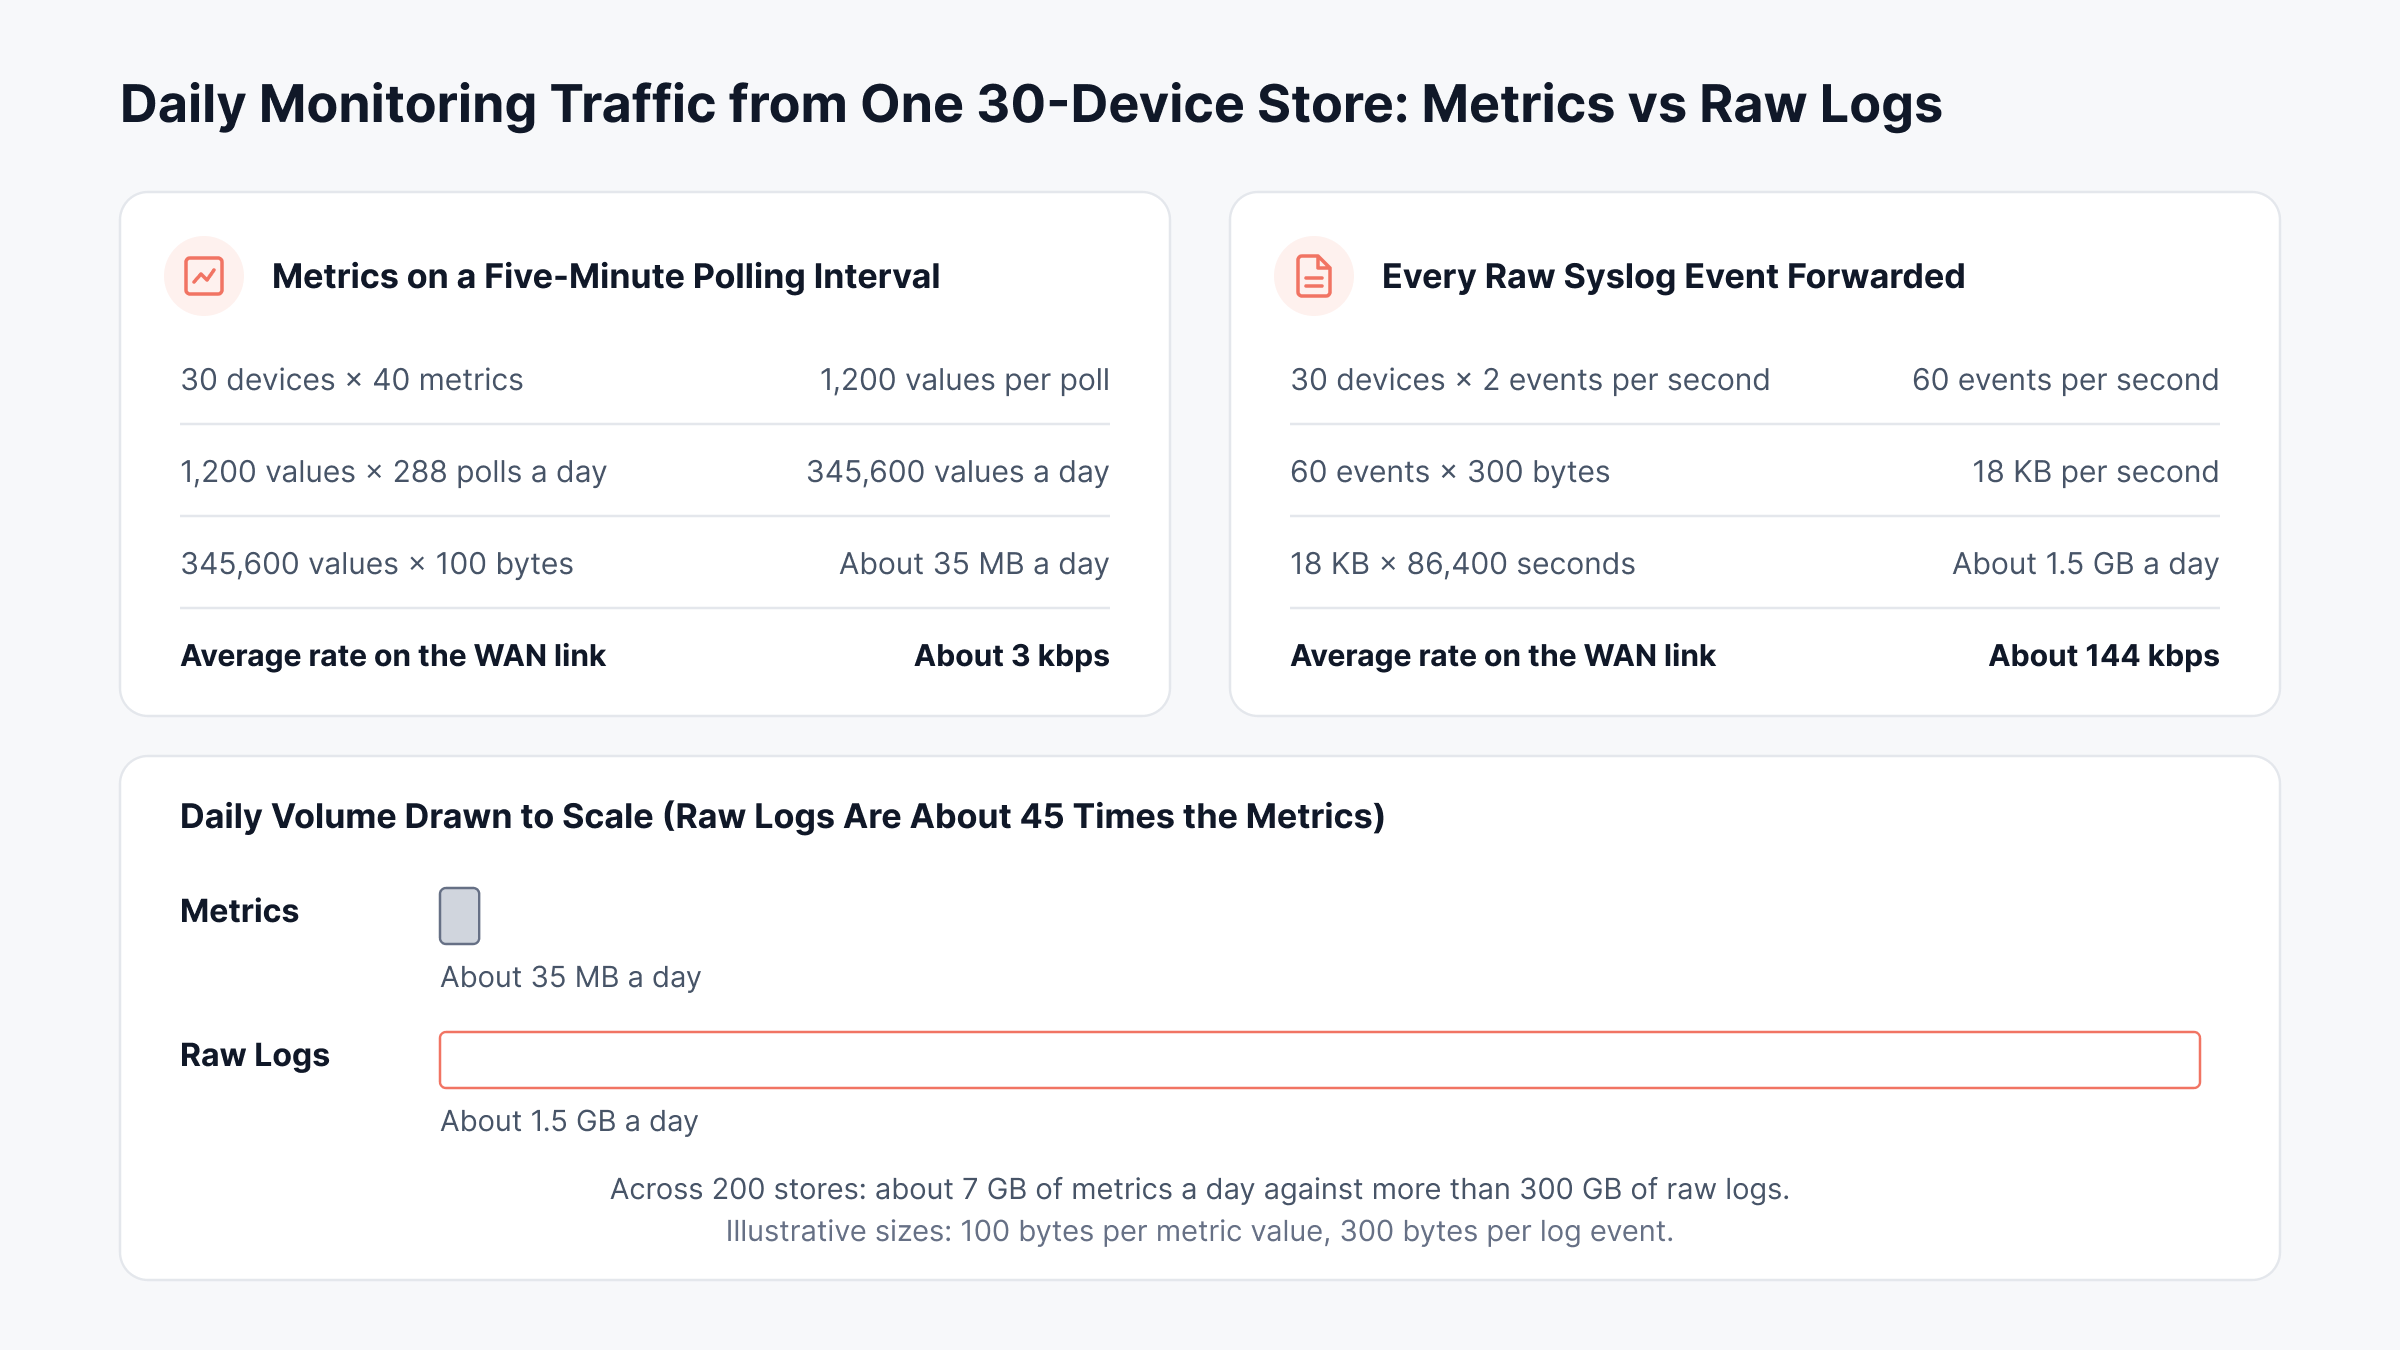
Take a retail store with 30 monitored devices, each reporting 40 metrics on a five-minute polling interval:
Values per poll: 30 devices × 40 metrics = 1,200 values
Values per day: 1,200 × 288 polls = 345,600 values
Daily volume: At roughly 100 bytes per value on the wire, about 35 MB a day, or close to 3 kbps on average
Now forward every raw syslog event from the same store, at 2 events per second per device and 300 bytes each:
Bytes per second: 30 devices × 2 events × 300 bytes = 18 KB
Daily volume: About 1.5 GB a day, or 144 kbps on average, roughly 45 times the metric volume
Across 200 stores: About 7 GB of metrics a day against more than 300 GB of raw logs reaching central storage
These figures are illustrative, and actual payload sizes vary by protocol and vendor. Still, the ratio holds in most environments, and it drives storage cost as much as link usage.
Collection choices move the volume far more than device counts do. The walkthrough below sets the metric and log arithmetic side by side, with bars drawn to the 1:45 ratio.
Polling frequency multiplies the metric figure directly, so moving every device from five minutes to one minute makes it five times larger. Three rules keep the budget under control:
Tier the polling: One-minute intervals for WAN links and critical services, five minutes for most devices, and 15 minutes or longer for inventory data
Filter logs at the source: Forward security, error and change events, and drop routine informational lines before they cross the WAN
Sample flows: Use sampled traffic flow records for analysis at busy sites, and save full capture for troubleshooting sessions
In ObserveOps, Collectors receive syslog and flow records inside each site, so that collection runs on the local network before results go to the central server.
How Should You Design Alerts for Sites with Unreliable Links?
Alerts for sites with unreliable links should fire on silence and persistence, follow device dependencies, and carry enough site context for someone far away to act. Without that design, one dropped circuit becomes dozens of alerts.
Consider a regional pharmacy chain that loses the primary circuit at one store overnight. With flat rules, the on-call engineer gets a separate alert for every device in the store. With dependency-aware rules like the ones below, the same event produces one alert that names the store, the likely cause and the state of the backup circuit.
Alert on silence: Treat "no data received" as a condition in its own right, because a quiet site is often a failed one
Require persistence: Fire only after a condition holds for several polls, so a brief wobble on a cellular backup link pages nobody
Follow dependencies: Mark devices behind the edge router as dependent, so their alerts roll up under the site alert
Add site context: Include the site name, address, circuit ID, provider and a local contact in every alert
Respect maintenance windows: Hold alerts during store refits, carrier work and firmware updates
Route by ownership: Send network alerts to the network on-call engineer and power alerts to the facilities contact
In ObserveOps, the Availability policy's down-time window covers the persistence rule, and topology shows which devices are behind a failed router. Once these rules are in place, each common edge condition should map to a clear first action. The table below pairs the signals engineers see most often with the check to run before anyone travels.
If this condition holds | It typically means | First action |
No data from the site for 5 minutes and the WAN probe shows loss | The primary circuit is down or degraded | Check whether the backup link took over, then raise a carrier ticket with the circuit ID |
No data from the site while the WAN probe looks healthy | The collector or agent has stopped | Check the collector or agent heartbeat and the server it runs on before dispatching anyone |
The UPS reports it is on battery | Utility power at the site is lost | Check the runtime remaining and alert the facilities contact if power doesn't return |
Latency stays 50% above baseline for 10 minutes | Congestion or a provider routing change | Compare path history for a route change before escalating to the provider |
Disk on an edge server passes 85% | Logs or buffered data are filling local storage | Review log retention and buffer size before the disk fills |
Grouping and holding back the follow-on alerts is a discipline of its own, and alert suppression explains how to set it up without hiding a second, unrelated fault.
What is a Practical Workflow for Rolling Out Edge Monitoring?
A practical edge monitoring rollout moves from inventory to pilot to fleet in seven steps, with a review before each expansion. Because each wave starts from a tested template, a problem found at a pilot site gets fixed once for the whole fleet. With the alert design settled, the sequence below suits most retail, branch and industrial networks.
Inventory and tag sites: Record site type, business criticality, circuits, providers and local contacts, and tag every device by site
Choose a collection method per site: Agents for edge servers, a collector where a site has many devices, and controller APIs for SD-WAN or cloud-managed gear, a choice our agent vs agentless comparison explains
Set polling tiers: Apply the tiers from the bandwidth section, then check the total against each site's backup link
Build site templates: One template per site type, so a new store inherits dashboards, thresholds and alert rules on its first day
Write alert rules for silence and dependencies: Start with reachability, WAN quality, power and the monitoring heartbeat
Connect alerts to the service desk: Create incidents with site context and an owner, then track incident resolution through to a confirmed fix
Pilot two sites, then expand: Run two contrasting sites for two weeks, tune thresholds from the baseline, then roll out in waves
Edge Monitoring Best Practices Checklist
Before a site goes live, a short check catches most configuration gaps ahead of the first live incident. These edge monitoring best practices apply to every site type:
Every device at the site appears in the inventory with its site tag
The collector or agent heartbeat raises an alert when it stops
A test link failure and a test power cut each produce one clear alert
Alerts reach the right on-call person with the site address and circuit ID
The site dashboard still loads while the site runs on its backup link
What Should You Look for in Edge Monitoring Tools?
Edge monitoring tools should collect locally, survive link failures, cover many vendors and pass alerts to the service desk. Feature lists tend to look alike, so test each point against your own sites:
Local collection and buffering: Ask where polling runs and what happens to data when a site loses its uplink
Multi-vendor coverage: SNMP, vendor APIs and SD-WAN controllers, since most sites mix brands
WAN path visibility: Latency, jitter and loss per circuit, plus hop-level views when a provider is at fault
Dependency-aware alerting: Downstream device alerts grouped under the site that failed
Location view: A map that shows the worst status per region, so trouble stands out at fleet scale
Service desk integration: Incidents created from alerts with site context, and alerts cleared when tickets close
Deployment options: On-premises, private cloud or high availability across locations, to match data residency rules
Licensing at scale: A cost model that stays predictable as sites and devices grow
Each gap shows up later as an extra site visit, a longer outage or a monitoring bill that grows faster than the fleet. The rest of this article shows how we approach these points in Motadata ObserveOps.
How does Motadata ObserveOps Bring Observability to Edge Sites?
Motadata ObserveOps brings observability to edge sites by collecting data inside each location, measuring every WAN circuit and showing all sites in one view, with alerts that flow into Motadata ServiceOps. We built our hybrid infrastructure monitoring for distributed networks where the people who fix problems are rarely at the site.
1. Place a Motadata Collector at Each Edge Site
In a multi-site deployment, Motadata Collectors run at branch and remote sites, poll local resources and forward the results to the central server. Each discovery profile names the collector that should poll a device range, so a store's devices are polled from inside the store.
Collectors can also receive logs and traffic flow records directly from devices at the site, once the matching ports are open on the collector:
Syslog: UDP 514, or TCP 5140 for encrypted log ingestion
NetFlow: UDP 2055
sFlow: UDP 6343
If head office itself needs resilience, High Availability over WAN places the primary and secondary servers in different locations. Collectors then connect to them through an FQDN.
2. Run MotaAgent on Edge Servers
MotaAgent runs on Linux and Windows servers and can poll as often as once a second. It identifies a device by hostname, so a server whose IP address changes keeps its history.
When the connection to the ObserveOps server is disrupted, the agent stores collected data locally for a specified period. That makes it a good fit for edge server monitoring on unstable links.
3. Measure Every WAN Circuit and Its Path
WAN Link monitoring runs test probes from the site router, which must support Cisco IP SLA. The probes measure response time, jitter, packet loss and latency in both directions, plus hop-by-hop response times along the path. Each WAN link is added to an existing network monitor with a few settings:
Path: Source interface and destination IP
Provider: ISP name
Probe: Payload size, frequency and timeout
NetRoute then draws the full route, detects route changes and keeps a history of path availability and latency. That history helps show whether the provider or the site is at fault.
For SD-WAN fleets, our Cisco SD-WAN integration reports tunnel latency, loss and jitter alongside edge device health. Cloud-managed branch networks connect through the Cisco Meraki integration using a Meraki API key. Together they give the network path visibility that remote site monitoring depends on.
4. Alert on Silent Sites, Anomalies and Forecasts
ObserveOps policies match the alert design described earlier:
Availability policies: Use the "Notify if Monitor/Instance is down for" setting, so a silent site raises an alert once the outage outlasts that window, without paging on every blip
Anomaly policies: Learn normal behavior once at least eight hours of data exist, then evaluate 30-minute aggregated samples every 15 minutes and flag unusual values
Forecast policies: Use at least 24 hours of history to project trends such as a filling disk
SNMP traps: Catch events between polls over SNMP v1, v2c and v3, such as a UPS switching to battery
Together these policies keep watch over sites that nobody visits often. For power, our UPS integrations cover vendors such as APC, Eaton, Schneider Electric and Tripp Lite, so UPS status appears beside network health in the same view.
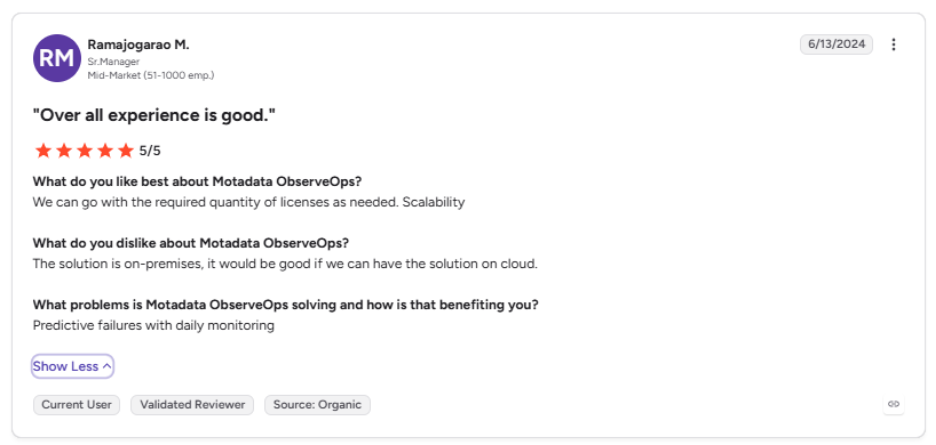
This is what one of our clients says about Motadata ObserveOps on G2:
5. See Every Site on a Map and Trace the Fault
Geo Map plots monitored devices by their configured location and colors markers and clusters by status: Clear, Warning, Critical, Down or Unreachable. Each cluster shows the worst status inside it, so a region with a down site stands out, and filters by Monitor Category, Status, Group and Tag narrow the view to one region or site type.
Topology then shows dependencies inside the site. A single red node on a switch explains why the devices below it are unreachable, and dynamic topology mapping covers how ObserveOps builds these maps.
6. Turn Site Alerts into Tracked Incidents with Motadata ServiceOps
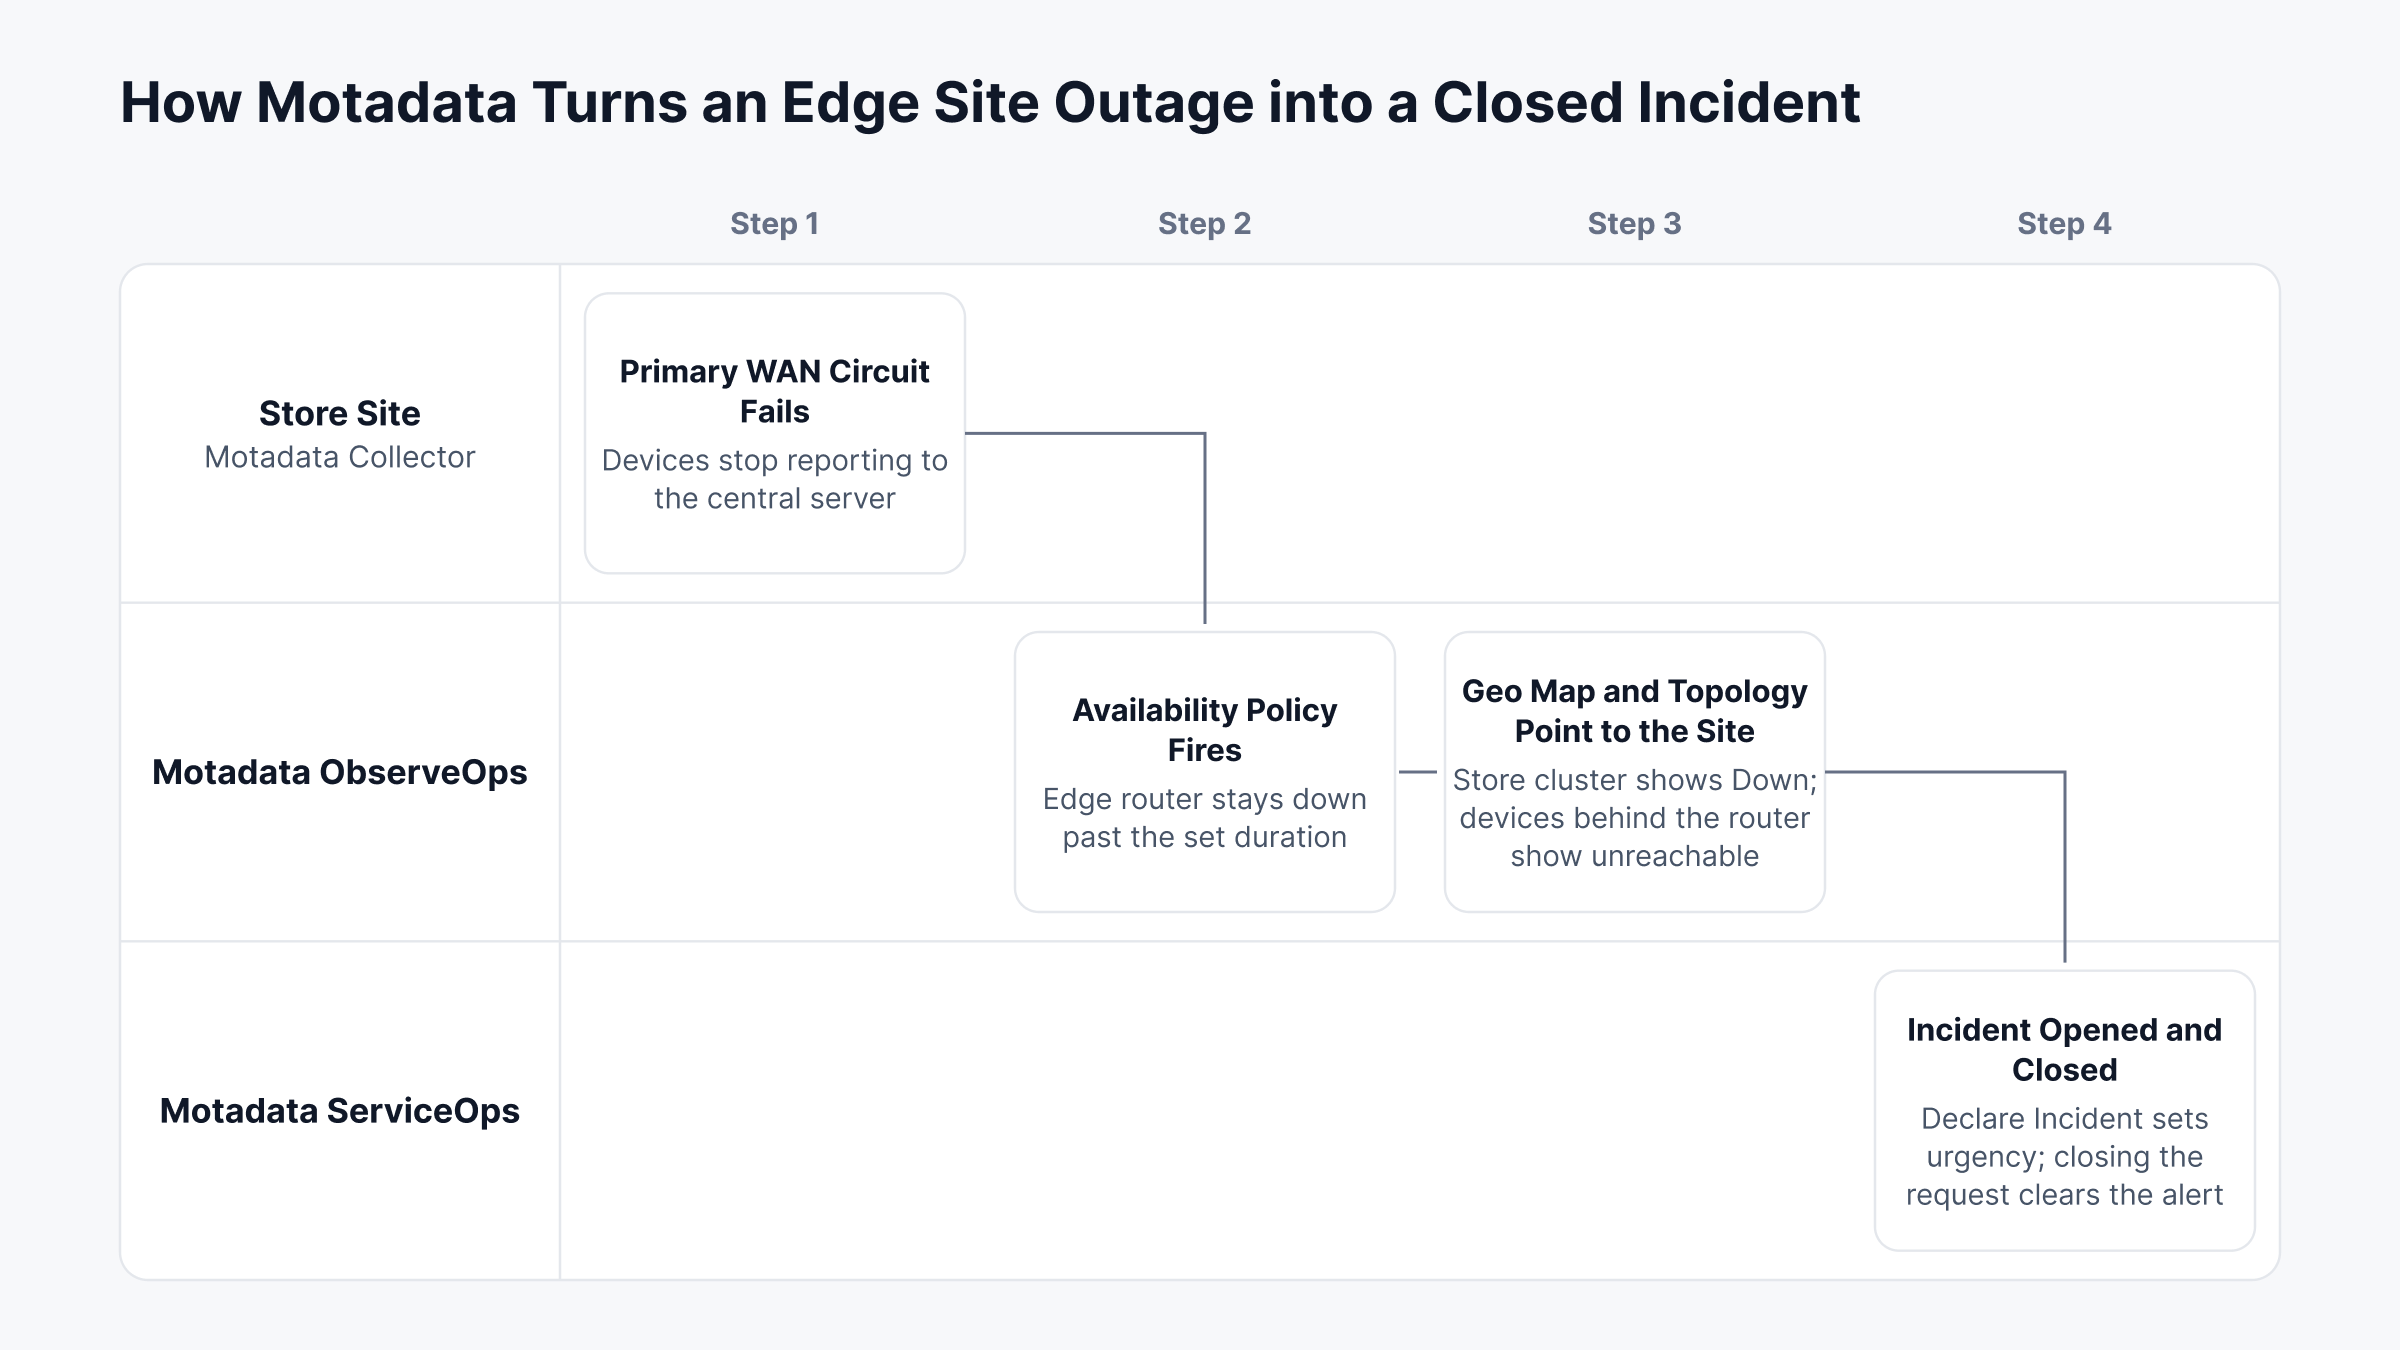
An ObserveOps alert can open a ServiceOps incident through Declare Incident, with urgency set from the alert's severity mapping. We built the bidirectional integration so that closing the ServiceOps request triggers a workflow that clears the matching ObserveOps alert.
Every handoff in this flow carries the site context forward. The swimlane below follows one store outage from the failed circuit to a closed ServiceOps incident.
The same flow holds up at fleet scale. One of India's largest insurers runs more than 2,000 devices across 400+ branches on Motadata, and the 400-branch rollout shows how its engineers trace branch faults along the path to the data center.
For patching at the same sites, Remote Offices in ServiceOps let endpoints download patches and packages from a local relay server. That reduces load on the central server and saves WAN bandwidth.
Move from Site Visits to Continuous Edge Observability with Motadata ObserveOps
Many monitoring setups were designed for one data center and later stretched to cover branches, so local collection, buffering and site context arrive as afterthoughts. ObserveOps is designed around the site. Collectors poll inside each location, WAN probes measure every circuit, Geo Map and topology show where a fault begins, and ServiceOps carries the incident through to closure.
Where to start depends on the fleet, but three steps typically pay back first:
Start with the highest-revenue sites: Place a collector and WAN link probes where an outage costs the business the most
Alert on silence first: Set availability alerts and collector heartbeats before tuning thresholds for individual metrics
Connect the service desk early: Route site alerts into incidents from the first day, so every outage has an owner and a record
No monitoring platform can repair a cut fiber or swap a failed power supply, and some faults will always need someone on site. What edge observability changes is the visit itself: it happens at the right site, with the right part, for a fault that is already diagnosed.
FAQs
Is edge monitoring related to Microsoft Edge or to an edge monitor display?
No. In IT operations, edge monitoring means watching devices, servers and links at sites outside the central data center, such as stores, plants and branch offices. The browser management dashboard for Microsoft Edge and in-vehicle display products sold as edge monitors only share the name.
Can edge monitoring work when a site loses its internet connection?
Yes, if collection runs locally. A site collector or agent keeps polling during an outage and holds the data until the link returns. In Motadata ObserveOps, MotaAgent stores collected data locally for a set period, and an availability alert flags the silent site centrally.
What is the difference between edge monitoring and remote site monitoring?
The two overlap heavily. Remote site monitoring usually means watching branch networks and links from head office, while edge monitoring also covers edge servers, gateways and local compute that process data on site. Most distributed businesses need both in one platform.
Do you need an agent on every edge device?
No. Network devices, UPS units and many sensors are monitored agentlessly over SNMP or vendor APIs, usually through a collector at the site. Agents suit edge servers, where they report detailed metrics at short intervals and keep data locally when the link drops.
What does edge monitoring cost compared with sending everyone to site?
The main costs are software licensing, a small collector at larger sites and the setup time for templates. Against that, each fault fixed remotely saves a day of travel and shortens downtime at a revenue site, so the return grows with the number of locations.
Author
Poonam Lalani
Content Strategist
Poonam Lalani is a B2B content strategist and writer with a background in computer engineering and experience across enterprise technology domains, including AI, cloud, DevOps, data engineering, and IT operations. She specializes in creating research-driven content that simplifies complex ideas and supports product education, thought leadership, and business growth.