Best Email Monitoring Practices to Prevent Outages
Why does the help desk so often hear about an email outage before the monitoring console shows one? The mail server answers ping, its CPU looks normal, and the dashboard reports it as up. Meanwhile, outbound messages keep piling up in a retry queue because the next hop stopped accepting connections an hour ago.
That gap appears because most server checks measure the machine, while users experience the message. Email passes through several services before it reaches a mailbox, and any one of them can fail quietly while the host stays healthy.
Good email monitoring follows the message along that path, and it works best as part of a wider observability practice that connects metrics, logs and alerts. It starts with the host checks in a server monitoring checklist, then adds queue, protocol, DNS and reputation signals that warn of trouble early. In this blog, you will see which signals matter most on Exchange and SMTP servers, which thresholds make sensible starting points, and how to turn them into a workflow that protects the business from mail outages.
What is Email Monitoring?
Email monitoring is the continuous tracking of mail servers, mail flow and delivery results so that IT can detect failures, slowdowns and reputation problems before they interrupt business communication. For example, if a retry queue starts growing overnight, monitoring raises an alert before the next morning's customer mail queues up behind it.
The term covers more ground than many searchers expect. In practice, it splits into four disciplines, and each one answers a different question:
Mail server and service monitoring: Can the server, its services and its queues accept, route and store mail?
Email deliverability monitoring: Do messages reach recipients, or do they bounce, defer or land in spam?
Email security monitoring: Are phishing, spoofing and malware attempts detected and blocked at the gateway?
Content and compliance monitoring: Does outbound content follow data loss prevention and retention policies?
This guide covers the first two, because they decide whether email works at all and they are what most email monitoring tools for IT operations measure. Security and content monitoring carry equal weight, though they run as separate programs with their own tools, policies and legal review.
Monitoring and observability work together here. Monitoring tells you that a queue crossed its limit, while infrastructure observability connects that alert with the disk, service and log data that explain why it happened.
Why does Email Monitoring Matter to the Business?
Email monitoring matters to the business because email still carries orders, invoices, approvals and customer conversations, so downtime in mail flow turns quickly into lost revenue and slower service. This means a gap in email monitoring usually shows up first as a business delay, well before anyone raises a ticket.
Revenue and cash flow: Quotes, purchase orders and invoices stop moving when inbound or outbound mail stalls
Customer experience: Support replies and account notifications arrive late, which customers read as poor service
Employee productivity: Every stalled mailbox becomes a help desk ticket and lost working time for the people affected
Contractual commitments: Delayed mail can breach a service level agreement that promises response times to customers
The cost of a serious outage adds up fast. In Uptime Institute's 2026 outage analysis, 57% of survey respondents said their most recent major outage cost more than $100,000.
Why does Email Fail Even When the Server Looks Healthy?
Email fails on healthy-looking servers because an availability check confirms only that the host is running, while mail delivery depends on a chain of services that can each break on their own. For example, a host can answer ping while its transport service is stopped, so every new message waits in a queue that no availability check looks at.
Map every hop your mail takes before you decide what to monitor on it. The diagram below follows a message from sender to inbox and marks where it most often stalls.
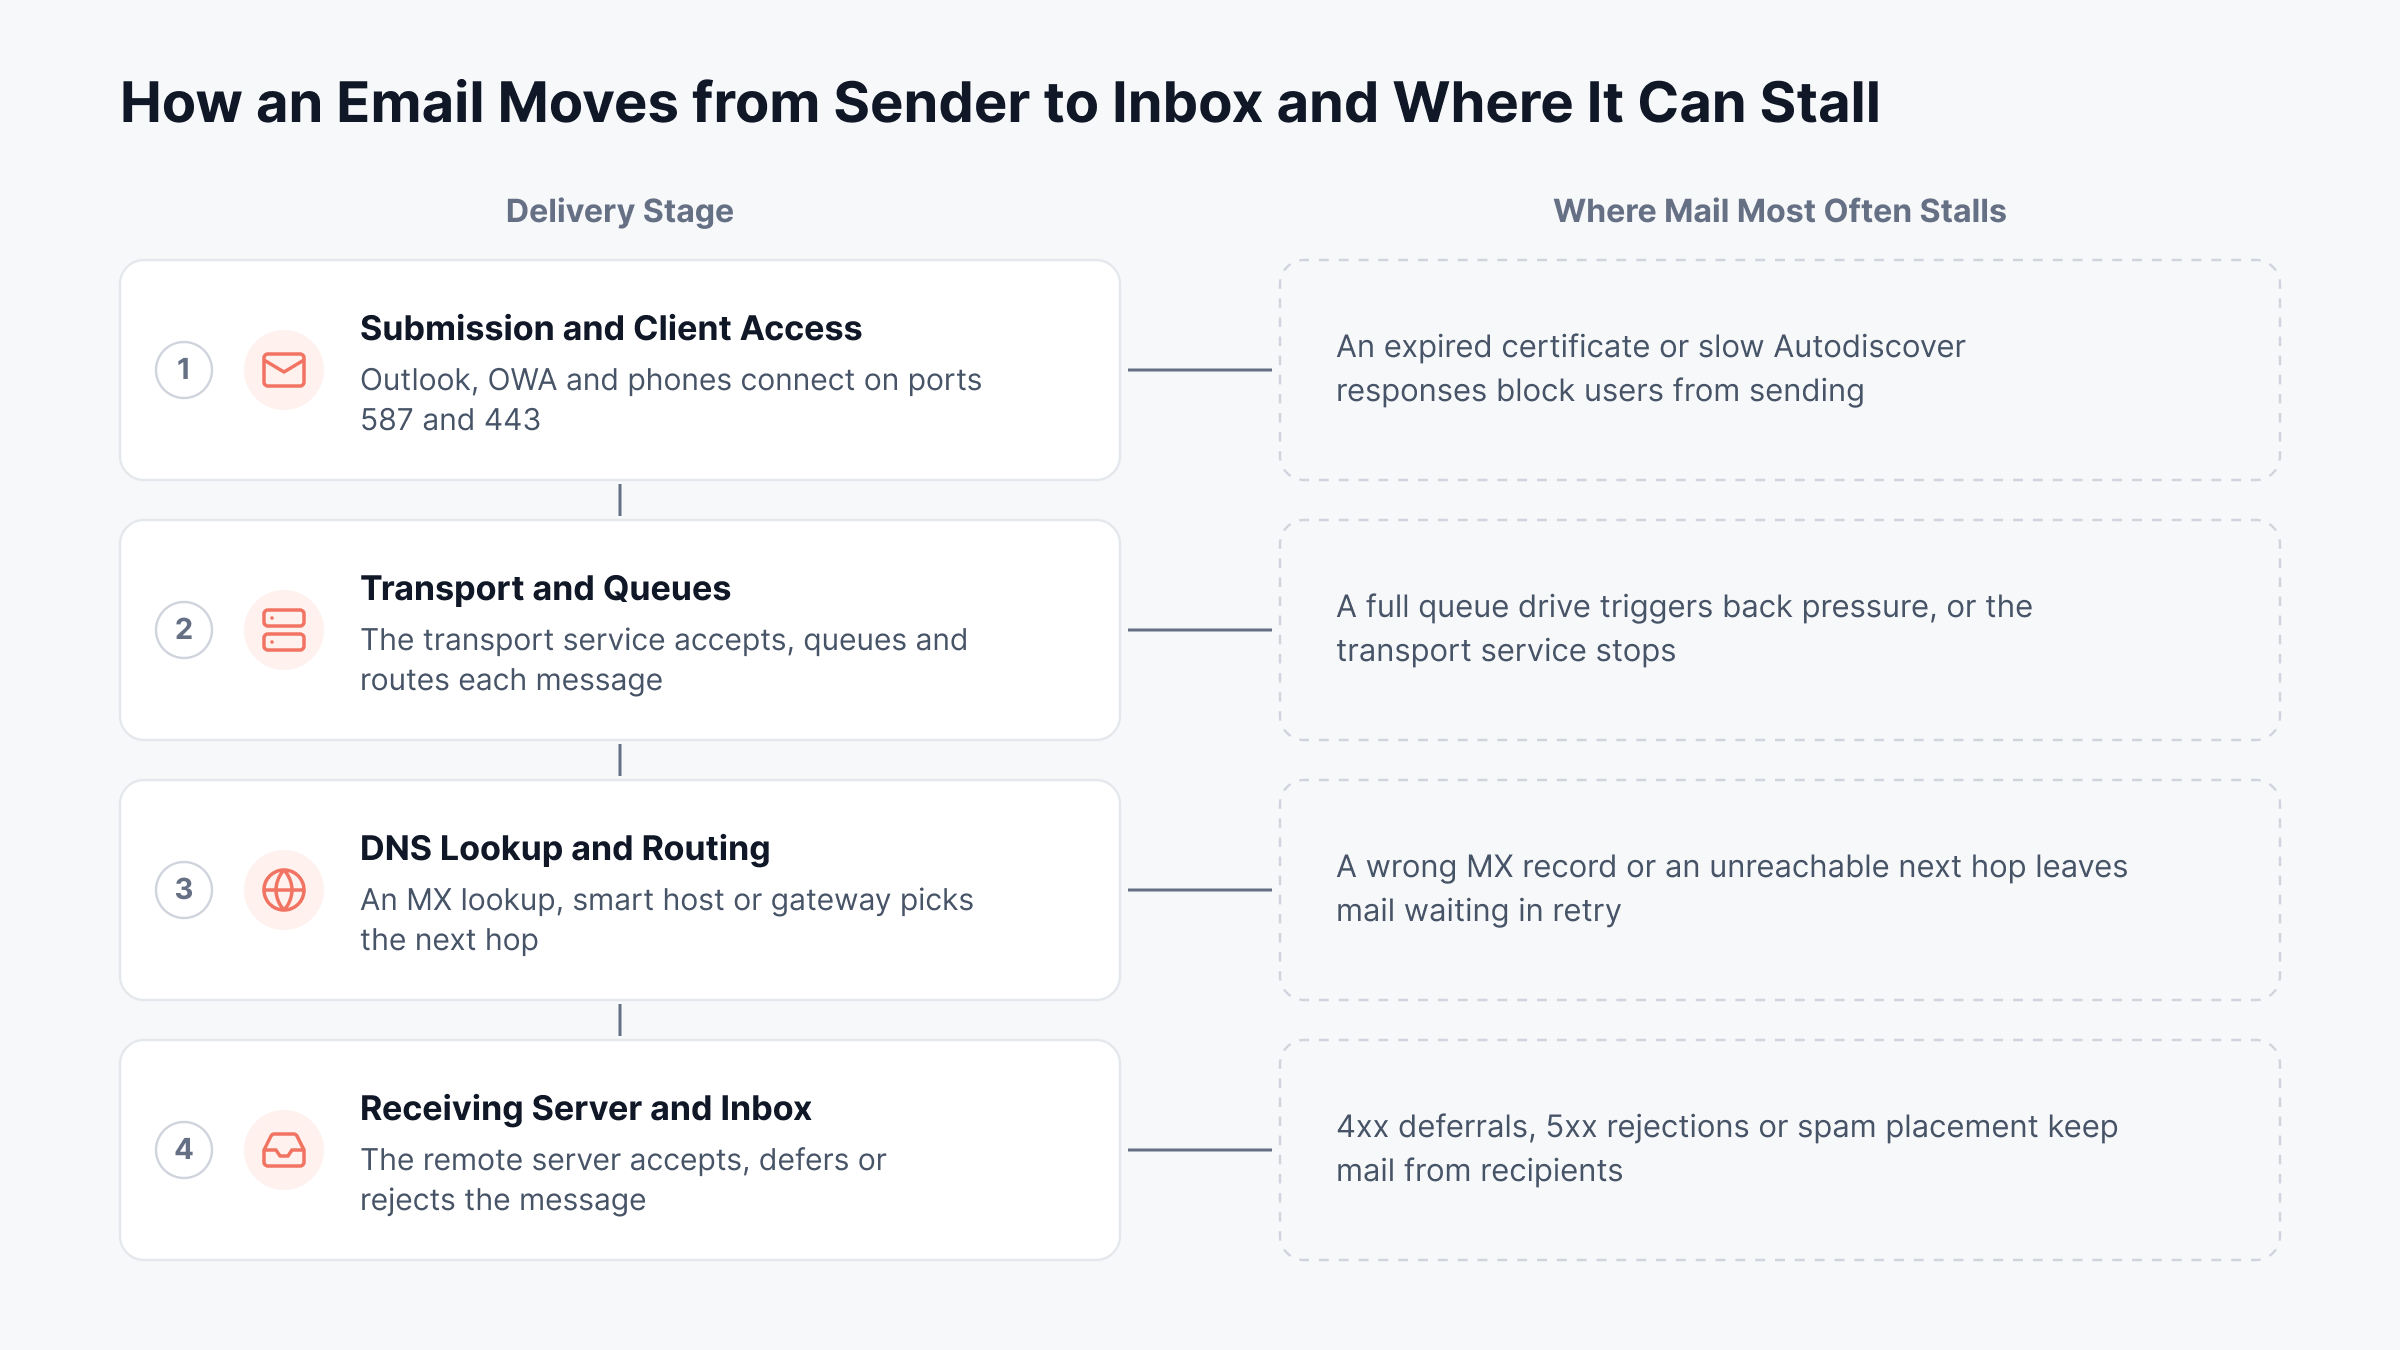
Consider a 900-person distributor that runs Exchange on-premises. Transport logs and a forgotten diagnostic trace slowly fill the drive that holds the queue database. Once that drive passes 96% used, Exchange starts rejecting mail from non-Exchange servers, which includes every customer and supplier on the internet.
The host still answers ping, and its CPU stays low, so the first alert comes from a sales manager asking why no customer orders have arrived since the morning. That chain of quiet failures is why a useful signal list starts at the server and works outward toward the recipient.
What Should You Track in Email Server Monitoring?
Email server monitoring should track ten signal groups, ordered here from the server outward to the recipient. Because each hop depends on the one before it, a failure close to the server typically stops more mail than one further out. Each one below covers what the signal shows, why it predicts an outage and what to watch for.
1. Mail Queue Length and Message Age
Mail queue monitoring counts how many messages are waiting for delivery and how long the oldest one has waited. Track both, because a queue can hold a steady count while it stalls if messages arrive and leave at the same pace. Message age is also the figure users feel, since it shows how late their mail will arrive.
Active and retry queues: A growing retry queue for one next-hop domain points to a remote server or routing problem
Unreachable and poison queues: Messages here either have no route or repeatedly failed transport processing, so even one deserves a look
Oldest message age: For internal and transactional mail, an oldest message older than 30 minutes is worth investigating
If bulk mail and newsletters share the same queues, give that traffic its own threshold. Otherwise its longer wait times can hide a stall in business mail.
2. Exchange Back Pressure and Transport Resources
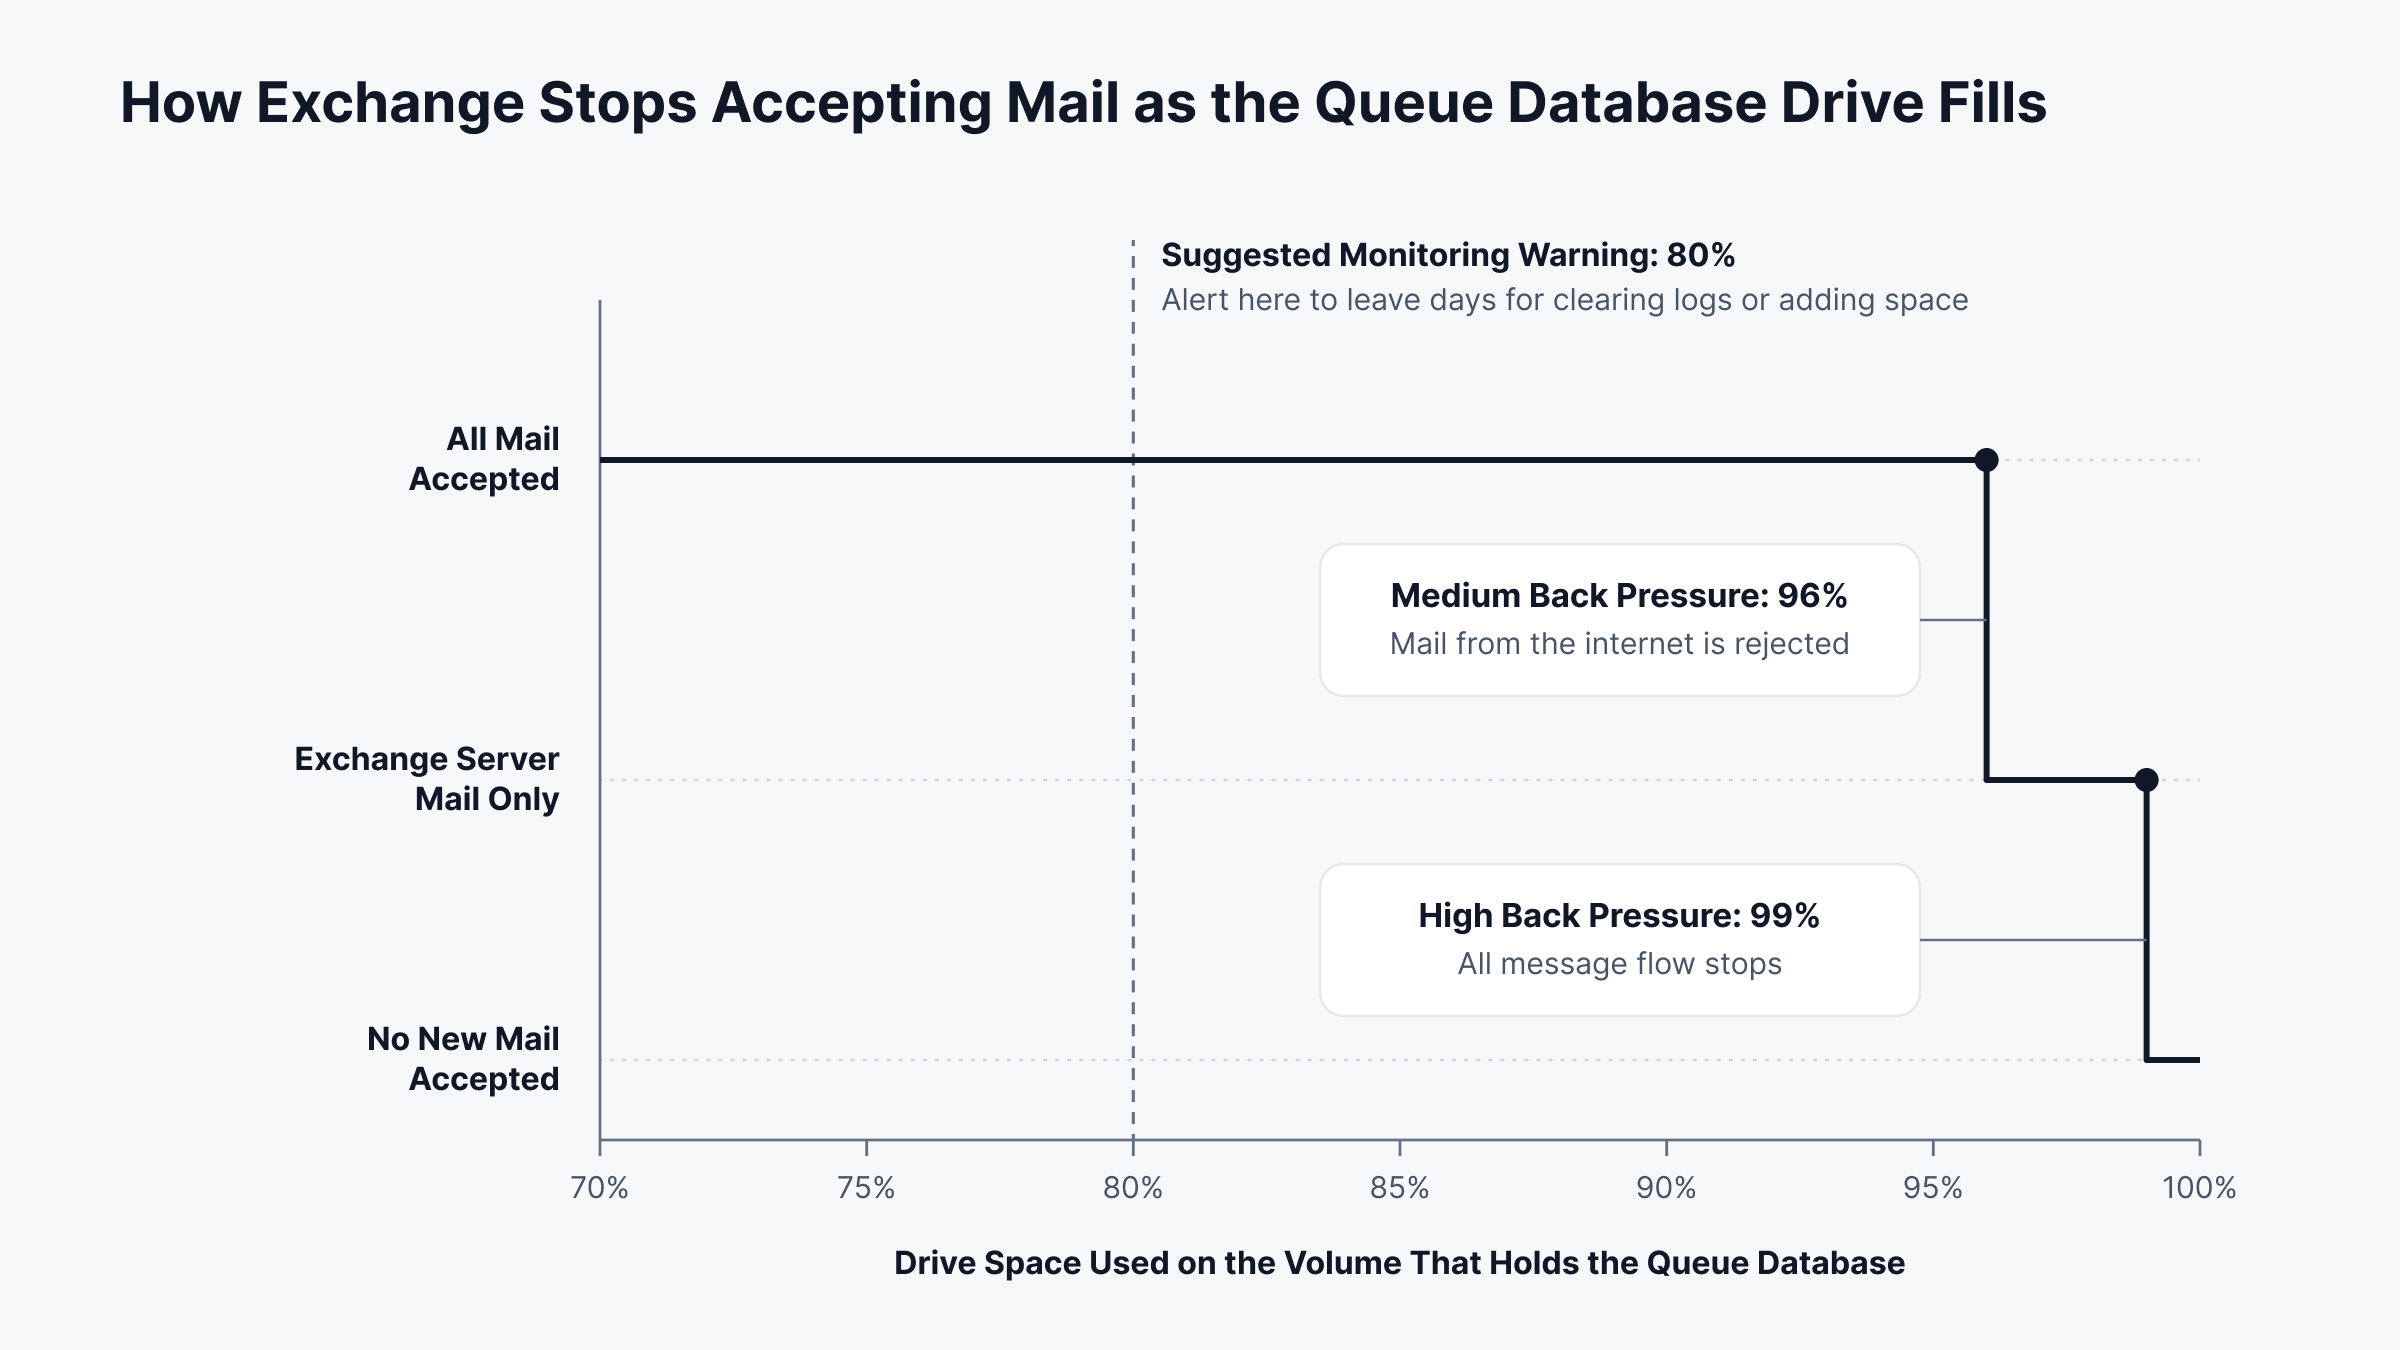
Back pressure is the Exchange transport feature that slows or rejects mail when the queue drive, memory or uncommitted transactions climb too high. It protects the server, though it also stops mail flow, including inbound mail from customers, before anything looks wrong at the host level.
Microsoft's back pressure documentation lists the default trigger points:
Queue database drive: Medium pressure begins at 96% used and high pressure at 99%
EdgeTransport.exe memory: Medium pressure begins at 72% of physical memory and high pressure at 75%
Submission queue: Medium pressure begins at 9,999 messages and high pressure at 15,000
Once a resource passes its medium threshold, Exchange starts rejecting mail from outside sources, and at the high threshold all message flow stops. Note that event 15004 in the Windows event log records rising resource pressure, while event 15006 records rejections caused by low disk space.
Set your own warning well below the point where Exchange takes action. The chart below shows how much mail Exchange still accepts as the queue drive fills past each default threshold.
3. SMTP Port Availability and Response Time
SMTP monitoring checks that each mail endpoint accepts connections on its port and answers with the expected greeting, called a banner, within a normal response time. Test each port separately, since each one serves a different job:
Port 25: Relay between mail transfer agents, the servers that pass mail from one organization to another
Port 587: Authenticated submission from mail clients, upgraded to encryption with the STARTTLS command
Port 465: Client submission over a connection that is encrypted from the start
If users retrieve mail over IMAP or POP3, check ports 993 and 995 as well. Once each port answers, track connection time and banner response alongside plain availability.
A slow banner often points to slow reverse DNS lookups or an overloaded transport service, and it typically appears before connections start failing. This is the core of smtp server monitoring on any mail platform, and it catches problems that would otherwise surface as partner complaints about bounced mail.
4. End-to-End Round-Trip Email Delivery
Round-trip monitoring sends a test message through the mail system and measures how long it takes to arrive in a target mailbox. It comes closest to what a user experiences, because one pass exercises submission, transport, routing and mailbox delivery. The method is a form of synthetic monitoring applied to mail flow, and many organizations run the external loop from an email monitoring service so the test starts outside their own network.
Internal loop: Mailbox to mailbox inside the organization, which isolates your own servers
External loop: Out to an external mailbox and back, which adds DNS, MX lookups and remote acceptance
Trend alert: A round trip that drifts from seconds to minutes is an early warning, even while every message still arrives
5. Mailbox Database Health, Replication and Capacity
Mailbox database monitoring tracks whether each database is mounted, how quickly it reads and writes, and whether its passive copies keep up inside a database availability group (DAG). A DAG is the Exchange feature that keeps standby copies of each database on other servers.
Copy queue length and replay queue length matter most here. A rising copy queue means log files are not reaching the passive copy, which weakens failover at the moment the business may need it. For example, if the network link between two DAG members slows down, the copy queue on the passive server keeps growing even though users notice nothing.
Database status and content index state: A dismounted database or a failed index takes mailboxes or search offline
Copy and replay queues: Sustained growth means a passive copy is falling behind
Read and write latency: Slow disk I/O on database and log volumes shows up here before users see Outlook hang
Mailbox size and quota: Users who reach their send quota stop sending mail, so warn them and the mail administrator before that point
6. Outlook and Client Access Latency
Client access monitoring measures how fast Outlook, Outlook on the web (OWA), mobile ActiveSync clients and Autodiscover, the service Outlook uses to find its mailbox settings, get a response from the server. These counters catch complaints that sound like outages while mail still flows, such as Outlook freezing or phones that stop syncing. Each of those complaints costs working time across every affected user, even though no message is lost.
RPC latency and request volume: Compare the delay on Outlook's calls to the mailbox server against its own baseline, since sustained growth usually points to storage or CPU pressure
ActiveSync pending commands: A climbing count means mobile devices are waiting on the server
Worker process restarts: Frequent restarts of an IIS application pool signal a failing web service behind OWA or Autodiscover
7. DNS, MX and Reverse DNS Records
DNS monitoring for email confirms that MX records, reverse DNS entries and authentication records resolve correctly and quickly. A wrong MX record after a migration sends inbound mail to a retired host. A missing PTR record, the reverse DNS entry that maps an IP address back to a name, leads many receivers to reject outbound mail.
These commands give a quick first read from any Windows workstation:
Command | What it tells you |
nslookup -type=mx example.com | Which hosts receive mail for the domain, in priority order |
nslookup -type=txt example.com | Whether SPF and other TXT records are published |
nslookup 203.0.113.25 | Whether the sending IP address has a reverse DNS name |
If the PTR name does not match the name your server announces in its SMTP greeting, expect stricter receivers to defer or reject its mail. Our guide to DNS monitoring covers resolver latency and record checks in more detail.
8. TLS Certificates on Mail Endpoints
Certificate monitoring tracks the expiry date and validity of every certificate bound to SMTP connectors, OWA, Autodiscover and hybrid connectors. An expired certificate rarely announces itself until the SSL handshake fails. After that, Outlook shows security prompts, partners that enforce TLS start deferring mail, and hybrid mail flow with Exchange Online can stop.
Days to expiry: Alert at 30 days and again at 7, so the renewal fits a normal change window
Service binding: Once you've renewed a certificate, run Get-ExchangeCertificate in the Exchange Management Shell to confirm which services it is assigned to and when it expires
9. Mail Server Host Resources and Windows Services
Mail server monitoring at the host level covers disk space, memory, disk queue length and the state of the Windows services that Exchange depends on. Disk is a frequent cause of email outages, because queue databases, transaction logs and protocol logs all grow without anyone touching them. Steady disk space monitoring on those volumes catches a common trigger of back pressure before it starts.
Free space on queue, log and database volumes: Trend daily growth and estimate when each volume will fill
Exchange services: Alert the moment Microsoft Exchange Transport or Microsoft Exchange Information Store stops or changes its startup type
Directory dependency: Slow Active Directory responses delay authentication and recipient lookups across every role
10. Bounces, Deferrals and Spam Complaint Rate
Email deliverability monitoring tracks what happens after a message leaves your server, including whether receivers accept it, defer it with a 4xx code or reject it with a 5xx code. A sudden rise in 4xx deferrals to one provider usually means throttling or greylisting, where a receiver refuses a first attempt to filter out spam. A jump in 5xx rejections points instead to a policy, authentication or reputation problem.
Bounces by code and domain: Group them by receiving domain so one provider's problem stands out
SPF, DKIM and DMARC results: Rising authentication failures usually follow a DNS change or a new sending service that was never added to the domain's records
Blocklist listings: Treat any listing of your sending IP address as a high-severity event
Spam complaint rate: Google's sender guidelines ask senders to keep the spam rate reported in Postmaster Tools below 0.3%
Consider a regional insurer that sends renewal campaigns and customer invoices from the same domain. A campaign to an old contact list raises the complaint rate, and large mailbox providers start deferring invoice mail along with the campaign. Moving bulk mail to its own subdomain, and watching complaint rates for each mail stream, keeps billing mail out of that risk.
What Thresholds Should Trigger an Email Alert?
Email alert thresholds should fire early enough to leave time for a fix, which means warning well below the point where the mail system starts rejecting messages. If a warning fires only at the limit, the fix starts after users are already affected. The table below gives starting values to tune after two weeks of baselining, since traffic patterns differ from one organization to the next.
Signal | Starting warning | Escalate when | Why it matters |
Oldest message age, business mail | 30 minutes | 1 hour | Users feel delays before queues look large |
Retry or unreachable queue | Above the server's normal range | Growth continues for 15 minutes | Points to a routing or remote server failure |
Queue database drive used | 80% | 90% | Exchange back pressure starts at 96% by default |
EdgeTransport.exe memory | 60% of physical memory | 70% of physical memory | Medium back pressure starts at 72% by default |
Round-trip delivery time | Twice the baseline | Five times the baseline or a missed loop | Mirrors what users experience |
Certificate days to expiry | 30 days | 7 days | Renewals need a change window |
Spam complaint rate | 0.1% | 0.3% | Google's stated limit for senders |
Most email monitoring software offers three threshold types. Fixed thresholds suit hard ceilings such as disk space and certificate expiry, while signals with a daily rhythm, such as message rates and client latency, work better with baselines that learn normal behavior for each hour and weekday. Forecasting adds a third option, warning when a trend is on course to cross a limit, which fits slow-filling disks and growing databases.
Once an alert fires, the first check depends on the signal. The table below maps the most common conditions to what to check first and what to do next.
If this happens | Check first | Then |
Retry queue grows for one next-hop domain | DNS resolution and the response codes from that domain | Hold bulk sends to that domain and contact its mail administrator if 4xx deferrals continue |
Queue database drive passes 80% | Which logs are growing on that volume | Clear or move transport and protocol logs, then add disk space before 96% |
Banner response time rises above baseline | Reverse DNS lookup time and transport service CPU | Fix resolver latency first, then review transport load |
Copy queue keeps growing on a passive copy | Network and disk latency between DAG members | Restore replication before any planned failover or maintenance |
Certificate reaches 30 days to expiry | Which services the certificate is bound to | Renew it, bind the new certificate to the same services and confirm the new expiry date |
Spam complaint rate passes 0.1% | Which mail stream and list sent the affected campaign | Pause that stream and move bulk mail to its own subdomain |
Whichever type you choose, route real-time alerts by severity, so a warning reaches the mail administrator during the working day while a critical alert reaches the on-call engineer at once.
How is Exchange Monitoring Different from Exchange Online Monitoring?
Exchange monitoring on-premises covers the servers, queues and databases you run yourself, while Exchange Online monitoring focuses on tenant activity, mail flow and the connections between your environment and Microsoft's service. This means the signals you watch change with the deployment model, even though the business impact of a mail outage stays the same.
The difference matters more since Microsoft ended support for Exchange Server 2016 and 2019 on October 14, 2025. Many organizations now run Exchange Server Subscription Edition, Exchange Online or a hybrid of the two, and each option shifts what IT still has to watch.
Area | Exchange Server on-premises | Exchange Online |
Who runs transport and queues | Your IT staff | Microsoft |
Signals to watch | Queues, back pressure, DAG copy queues, disk and services | Mail sent and received, active users, mailbox storage and service health |
What stays with you | Everything from hardware to certificates | Hybrid connectors, DNS records, certificates and authentication changes |
Common failure | Full queue drive or stopped transport service | Expired hybrid certificate or retired sign-in method |
Authentication changes deserve their own watch item on the Exchange Online side. Our guide to SMTP AUTH migration explains how alert emails and email-to-ticket workflows break when basic authentication retires, and how to move them to Microsoft Graph.
How do You Build an Email Observability Workflow That Prevents Outages?
An email observability workflow that prevents outages links six steps, starting with a map of the mail path and ending with a review of every incident. Because each step feeds the next, skipping the baseline typically leads to thresholds that either fire constantly or never fire at all.
Map the mail path: List every hop from client access through transport, gateways and smart hosts to the receiving side, and record who owns each one
Baseline for two weeks: Record normal queue sizes, message rates and round-trip times by hour and weekday before turning on dynamic alerts
Layer the alerts: Pair a fixed limit for each hard ceiling with a baseline or forecast alert for the trend beneath it
Correlate before escalating: Review queue, disk, service and log data for the same server in one view, so one cause does not page several people
Route by business impact: Map alert severity to incident priority so a stalled inbound queue outranks a slow search index
Review after every event: Add the signal that would have warned earliest, then retire the alerts nobody acted on
The review step pays off most over time. Monitoring alone cannot stop every Exchange server failure, though each review moves detection earlier and lowers MTTD, the mean time to detect a problem.
That discipline also cuts noise. Fewer, better-placed alerts mean responders trust the ones that fire, a goal our guide to alert noise reduction covers step by step.
What Should You Look for in Email Monitoring Software?
Email monitoring software should give IT and business leaders one view of mail servers, cloud mail and the infrastructure beneath them, with alerts early enough to act on and a clear path into incident handling. If these pieces live in separate tools, each incident starts with someone collecting evidence from several consoles. Use these questions when you compare options, since each one ties a capability to a business result:
Coverage: Does it watch on-premises Exchange, Exchange Online and the gateways between them in one console, so a hybrid migration does not create blind spots?
Early warning: Can it forecast when a disk or queue will reach its limit, so the fix happens during working hours before users notice?
Context: Does it correlate metrics, logs and alerts for the same server, which shortens investigations and keeps senior engineers on planned work?
Service desk handoff: Can an alert open a prioritized incident automatically, so ownership starts without manual triage?
Leadership reporting: Can it show availability and incident trends in a form that managers and auditors can read, in line with business service reliability goals?
A tool that answers yes to most of these lowers both the cost of outages and the cost of running separate products for each layer. The next section shows how we built ObserveOps around those questions, from Exchange role metrics to the Declare Incident handoff into ServiceOps.
How does Motadata ObserveOps Monitor Email Servers?
Motadata ObserveOps monitors email servers by collecting Exchange role metrics, testing mail endpoints with service checks and evaluating both through threshold, baseline, anomaly and forecast policies.
We built this coverage around the delivery path described above. Each hop has its own signals inside the same hybrid infrastructure monitoring platform that already watches the servers, storage and network underneath the mail system.
Exchange Role Metrics from Mailbox to Edge Transport
For Exchange server monitoring on-premises, we collect metrics from the Mailbox, Client Access and Edge Transport roles:
Edge Transport queues: Submission, retry, unreachable and poison queue lengths, along with messages sent and received per second
Mailbox role: Database status, copy and replay queue lengths, replication check results, DAG witness details and mailbox quota values
Client Access role: RPC latency, OWA request rates, ActiveSync pending commands, Autodiscover requests and worker process restarts
For Exchange Online, our Office 365 integration connects with the tenant's Client ID, Tenant ID and Secret Key, then reports tenant-level email sent and received, active and inactive users, mailbox counts and storage used. That lets you watch both sides of a hybrid deployment from one console during a migration.
Service Checks for SMTP and Supporting Services
We built the Email service check so that it connects to a mail endpoint on port 25, on 465 with SSL or on 587 with TLS. It records connection time and email latency, and it confirms the hostname, the banner match and the reverse DNS match.
DNS check: Lookup time and DNS latency for the resolvers your mail servers depend on
SSL Certificate check: Remaining days before expiry for web-facing endpoints such as OWA and Autodiscover
Windows monitoring: Status and startup type of the Exchange services on each server
Email gateways: Inbound, outbound and deferred message counts from Barracuda Email Gateway over SNMP, using a community string or SNMPv3 credentials, with a separate Symantec Email Gateway integration
Together, these checks form the availability layer of our uptime assurance capability for mail services. An availability policy then alerts once a check reports Down for the number of consecutive polls set in its Abnormality occurrence field.
Forecast and Anomaly Policies for Slow-Building Email Failures
Most email outages build slowly, so we pair fixed thresholds with policies that learn from history:
Baseline alerts: Compare a metric with its learned normal range for the same time of day and day of week
Anomaly policies: Need at least 8 hours of polling data, then evaluate recent samples against the baseline every 15 minutes, with severity set by the share of anomalous samples in the Sample Lookup window
Forecast policies: Need at least 24 hours of history, then raise an alert when a queue drive or database is on course to cross its limit within the forecast range you set
Use forecasting for slow problems such as a filling queue drive. The worked example below shows how much warning a forecast alert can give before back pressure starts in a hypothetical environment.
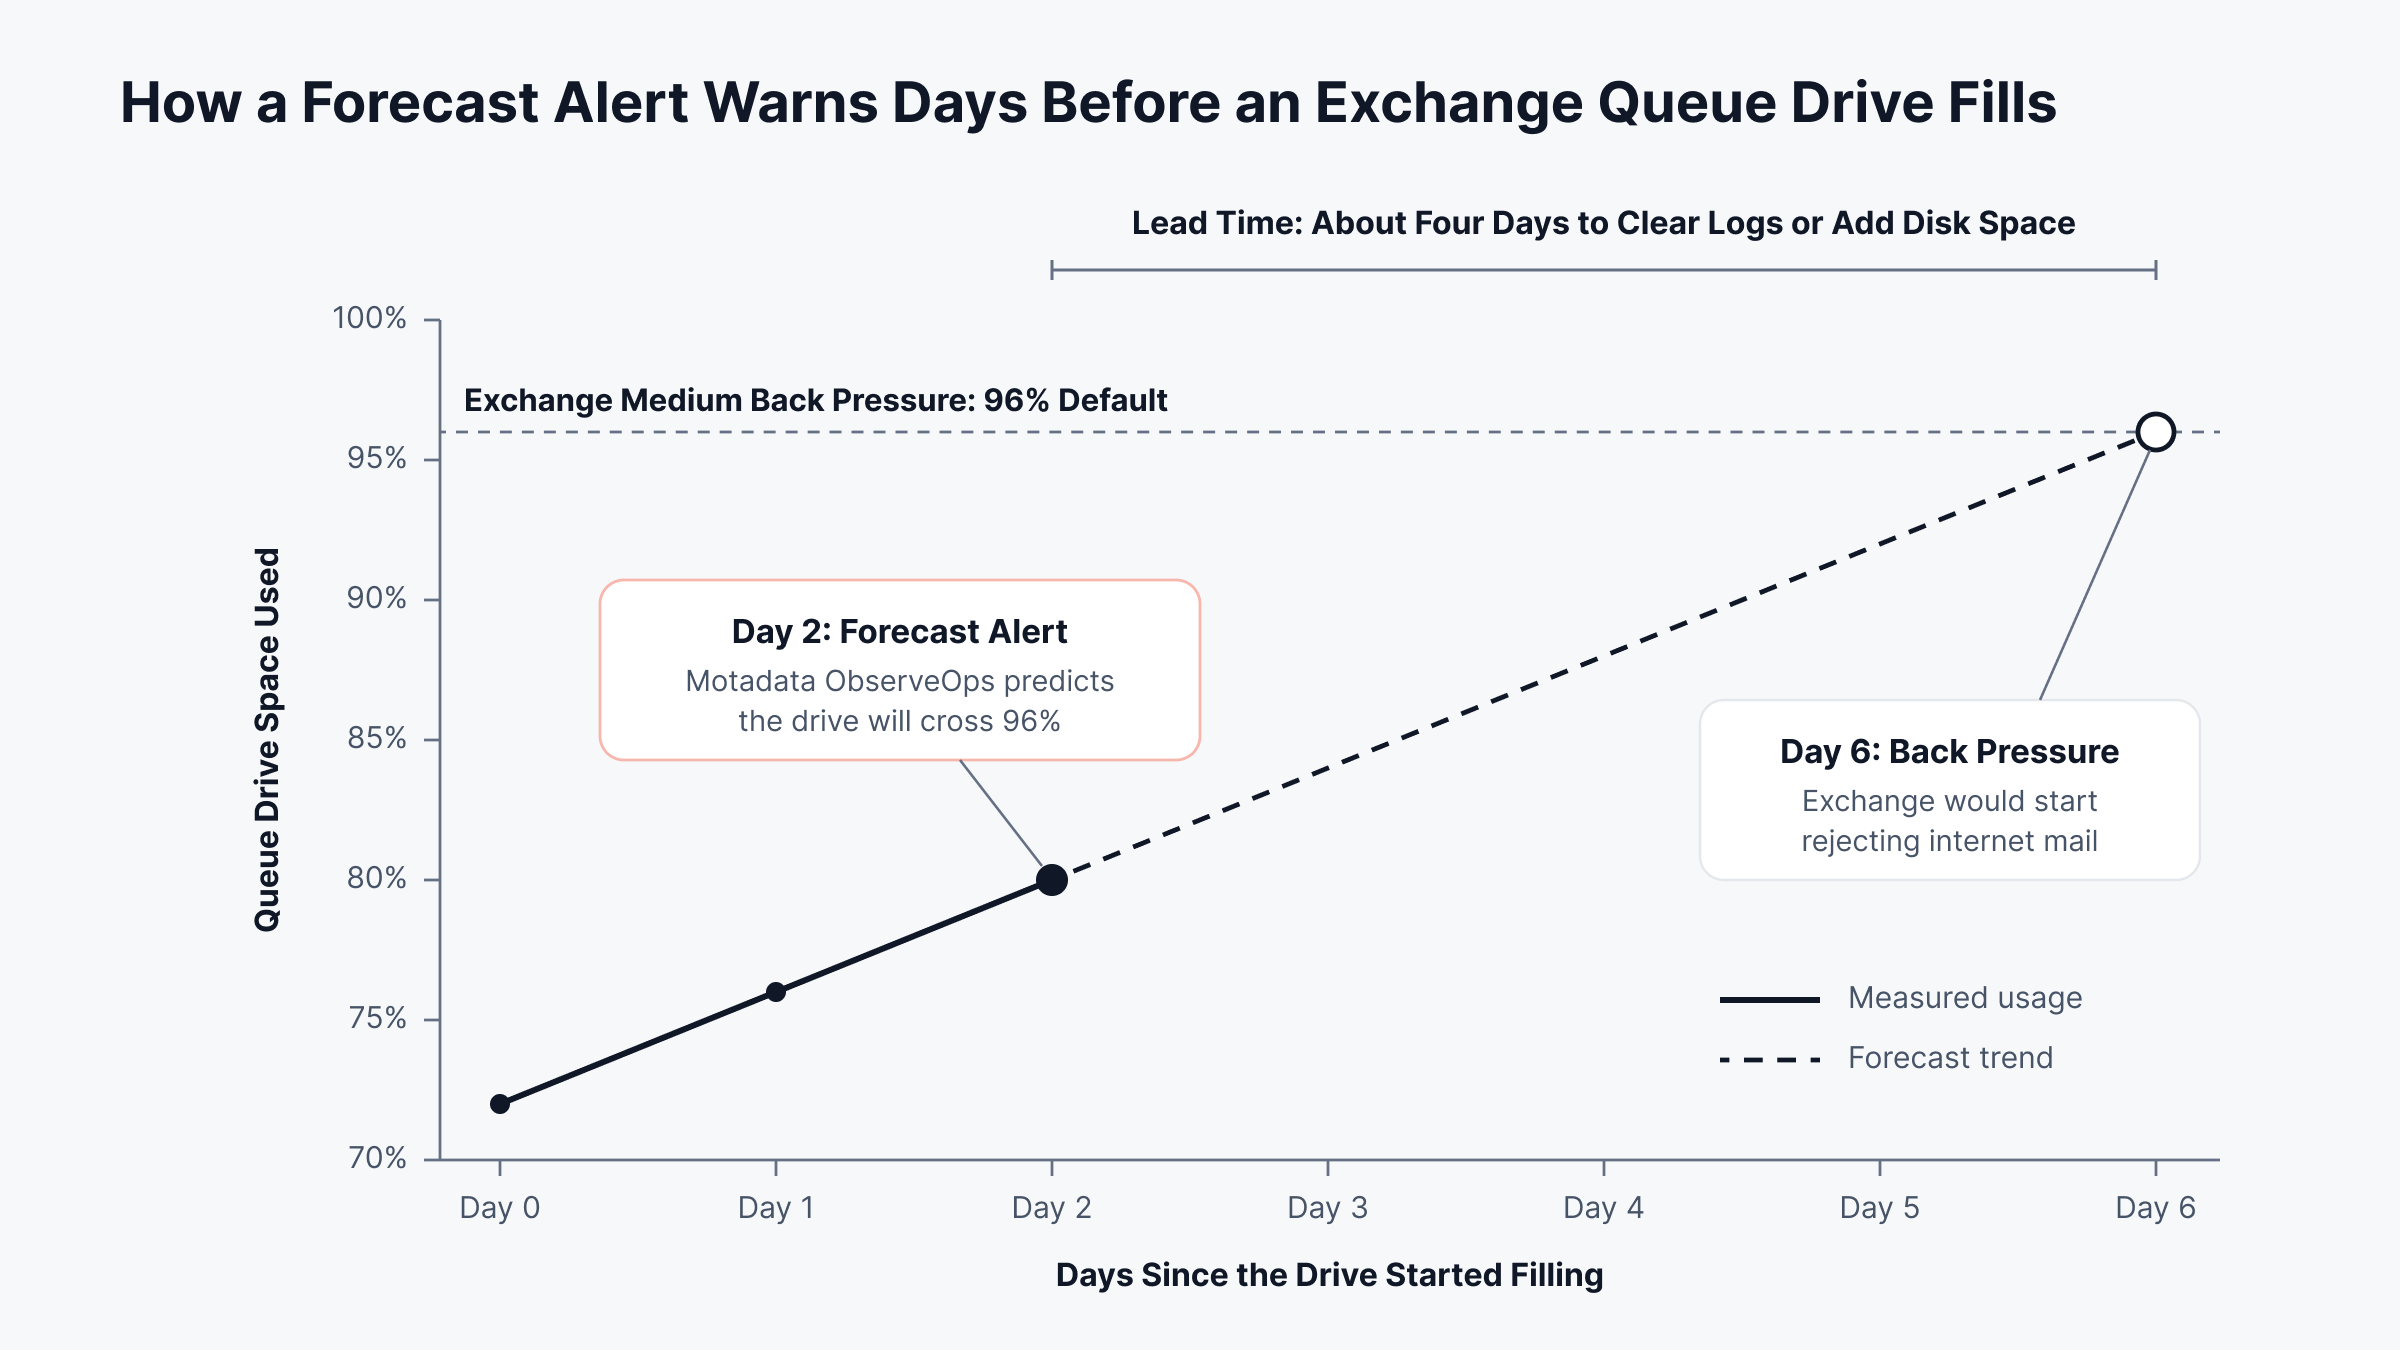
To set up a forecast policy, go to Settings, then Policy Settings, then Metric Policy, select Create Policy and choose the Forecast card. Our capacity planning capability applies the same forecasting to storage and compute across the wider infrastructure.
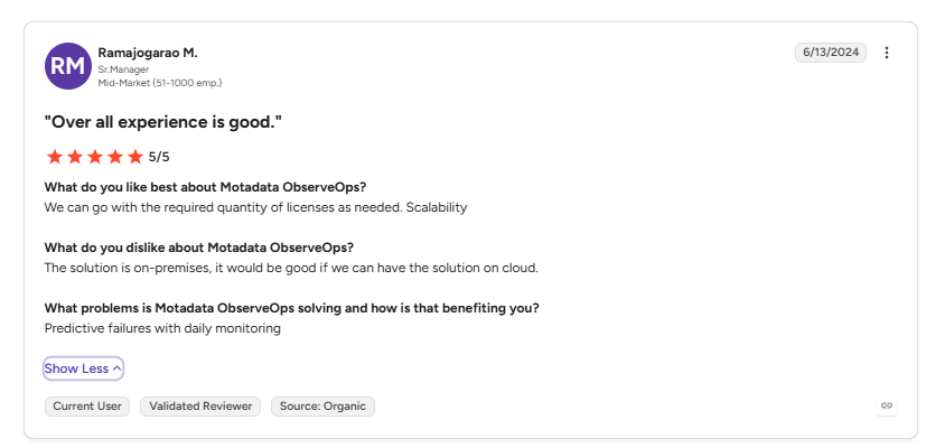
This is what one of our clients says about Motadata ObserveOps on G2:
From an Exchange Alert to a ServiceOps Incident
When a policy fires, the handoff from detection to action runs in three steps:
Notify: The alert reaches the right people by email, Microsoft Teams or Slack, routed by the policy's If severity is setting
Investigate: Alert correlation shows the metrics, logs and other alerts active on the same monitor during the alert window, grouped into the Correlated Metrics, Correlated Logs, Correlated Alerts and Log Pattern tabs, which narrows the root cause analysis
Hand off: Through the Declare Incident setting, an alert at a chosen severity opens an incident in Motadata ServiceOps, with impact and urgency mapped from the alert severity
Runbooks can also run automatically when an alert triggers. In the ServiceOps integration profile, priority can be set to Lock, which keeps it fixed, or Dynamic, which updates it while the ticket stays open. This means the incident opens with a priority the service desk can act on, which supports faster incident resolution.
Turn User-Reported Email Outages into Early Warnings with Motadata ObserveOps
Email rarely fails all at once. It degrades through a growing queue, a filling disk, an expiring certificate or a receiver that starts deferring, and each of those leaves a signal hours or days before customers and staff notice. No monitoring platform sees everything, either, since inbox placement at the large providers still comes from their own postmaster consoles and content compliance needs its own controls.
If you are starting from scratch, four steps cover the most common failures first:
Alert on free space for the queue, log and database volumes, and on the state of the Exchange Transport service
Add an SMTP check for each mail endpoint and record its connection time
Track certificate expiry at 30 days and again at 7 days
Baseline queue age and round-trip time for two weeks, then turn on forecast alerts
What we can do is bring the server-side picture into one view and tie it to the business. ObserveOps brings Exchange role metrics, SMTP checks and forecasting into one place, and ServiceOps carries each alert into an incident through the Declare Incident setting. Once those four steps are in place, extend coverage to the other signals above and let the policies warn you while there is still time to act.
FAQs
What is email monitoring?
Email monitoring is the ongoing tracking of mail servers, mail flow and delivery results so that problems surface before users report them. It covers server health, queues, protocol checks, DNS, certificates and deliverability signals such as bounces and spam complaints. Some organizations also use the term for security and content monitoring.
Can your email be monitored?
Yes. Organizations can monitor the mail systems they own, including server performance, mail flow and, under a stated policy, message content on corporate accounts. Content monitoring must follow local privacy and employment law, so most organizations plan it with legal and HR review before switching it on.
What is the difference between SMTP monitoring and email deliverability monitoring?
SMTP monitoring checks that your mail endpoints accept connections and respond correctly on ports such as 25 and 587. Deliverability monitoring looks at what happens after a message leaves your server, including deferrals, bounces, blocklist listings and the spam complaint rate reported by receiving providers.
How often should an email server be checked?
Availability and service checks work well at one-minute intervals, while capacity metrics such as disk and database size can be polled less often. In Motadata ObserveOps, anomaly policies evaluate every 15 minutes, which suits trend signals that do not need second-by-second checks.
What should an email monitoring tool cover?
A capable email monitoring tool should cover queues, transport resources, SMTP endpoints, round-trip delivery, DNS, certificates and host health in one view. Motadata ObserveOps adds forecast and anomaly policies and can open a ServiceOps incident automatically when an alert reaches a chosen severity.
Author
Poonam Lalani
Content Strategist
Poonam Lalani is a B2B content strategist and writer with a background in computer engineering and experience across enterprise technology domains, including AI, cloud, DevOps, data engineering, and IT operations. She specializes in creating research-driven content that simplifies complex ideas and supports product education, thought leadership, and business growth.