Serverless Monitoring: Metrics, Challenges and Best Practices
Serverless monitoring is the ability to observe the various functions being triggered. These functions execute on on servers which you will never get to see.
Whether you choose AWS Lambda or Azure Functions, you won't be able to SSH into an underlying VM, nor watch a host CPU graph. Your visibility is limited to the set of metrics exposed by the serverless offering, such as number of invocations, failed and throttled invocations and execution time.
You'll find these metrics become increasingly important to consider in your day-to-day work. Since August 1, 2025, AWS Lambda bills you for the INIT period of every cold start, meaning you'll see this reflected in your billing report and your latency metrics.
In this blog, you will:
Gain an appreciation of the scope of serverless monitoring and the challenges involved.
Become familiar with the key metrics available for AWS Lambda and Azure Functions.
Learn how to implement alerts and tracing, and manage the impact of cold starts.
What Is Serverless Monitoring?
Serverless monitoring means being able to measure the health, speed and cost of your serverless functions and the supporting infrastructure.
Depending on your design, this may include triggers, queues, APIs and databases. Within a serverless architecture, these together comprise the entirety of your solution.
At the heart of the solution is of course the function as a service paradigm. The provider executes your function in response to some stimulus, with no VMs for you to administer or tune, and charges you based solely on the compute consumed.
The consequence of this is that the bulk of metrics you might otherwise generate are made available by your serverless vendor.
So in summary, to effectively monitor your serverless workloads you need to: consume the metrics provided by your vendor; generate and aggregate logging and tracing data from your code; and synthesize these across multiple components.
Why Is Serverless Harder to Monitor Than Servers?
The primary difficulty is that the majority of conventional monitoring points are unavailable or controlled by your cloud provider.
You can't deploy a monitoring daemon to a system you can't access, functions will complete very quickly (and possibly disappear entirely), and a single request may span as many as five independent offerings.
The following are common sources of frustration:
Lack of a host system: With no VM to attach monitoring software to, you'll be reliant on your vendor's metrics and your code's output.
Brevity of execution: Depending on the function, an individual invocation may last as little as 200ms. Once complete, the function instance will cease to exist, so you must rely on higher-level metrics to identify issues.
Cold starts: When there is no pre-warmed function ready to satisfy a given trigger, the vendor will instantiate one. The additional time taken to do so is appended to that invocation, and now forms part of your bill under AWS Lambda.
Maximum concurrent executions: Your AWS account or Azure subscription has a maximum number of parallel invocations that can occur at once. Once exceeded, subsequent invocations will be throttled, potentially causing downstream effects (e.g. a growing backlog in a queue).
Asynchronous flows: A simple flow might involve an API endpoint, one or more functions, a message bus and storage. Without a mechanism to link each step together (e.g. a shared request ID), a failure occurring mid-flow will look like several unrelated events.
Your bill: Given that your serverless spend scales with (execution time × allocated memory), functions with longer execution times will drive a proportionately higher cost.
Fortunately, you should find that your vendor exposes a similar suite of core metrics, the basic ones of which can be collected for free. The question then is: which of these are worth focusing on?
Which Serverless Metrics Should You Track?
The set of metrics that we'd recommend collecting initially includes: invocations, failures, throttles, execution time, cold start time and maximum concurrent executions. Where relevant, iterator age and dead-letter errors would be additional items to monitor.
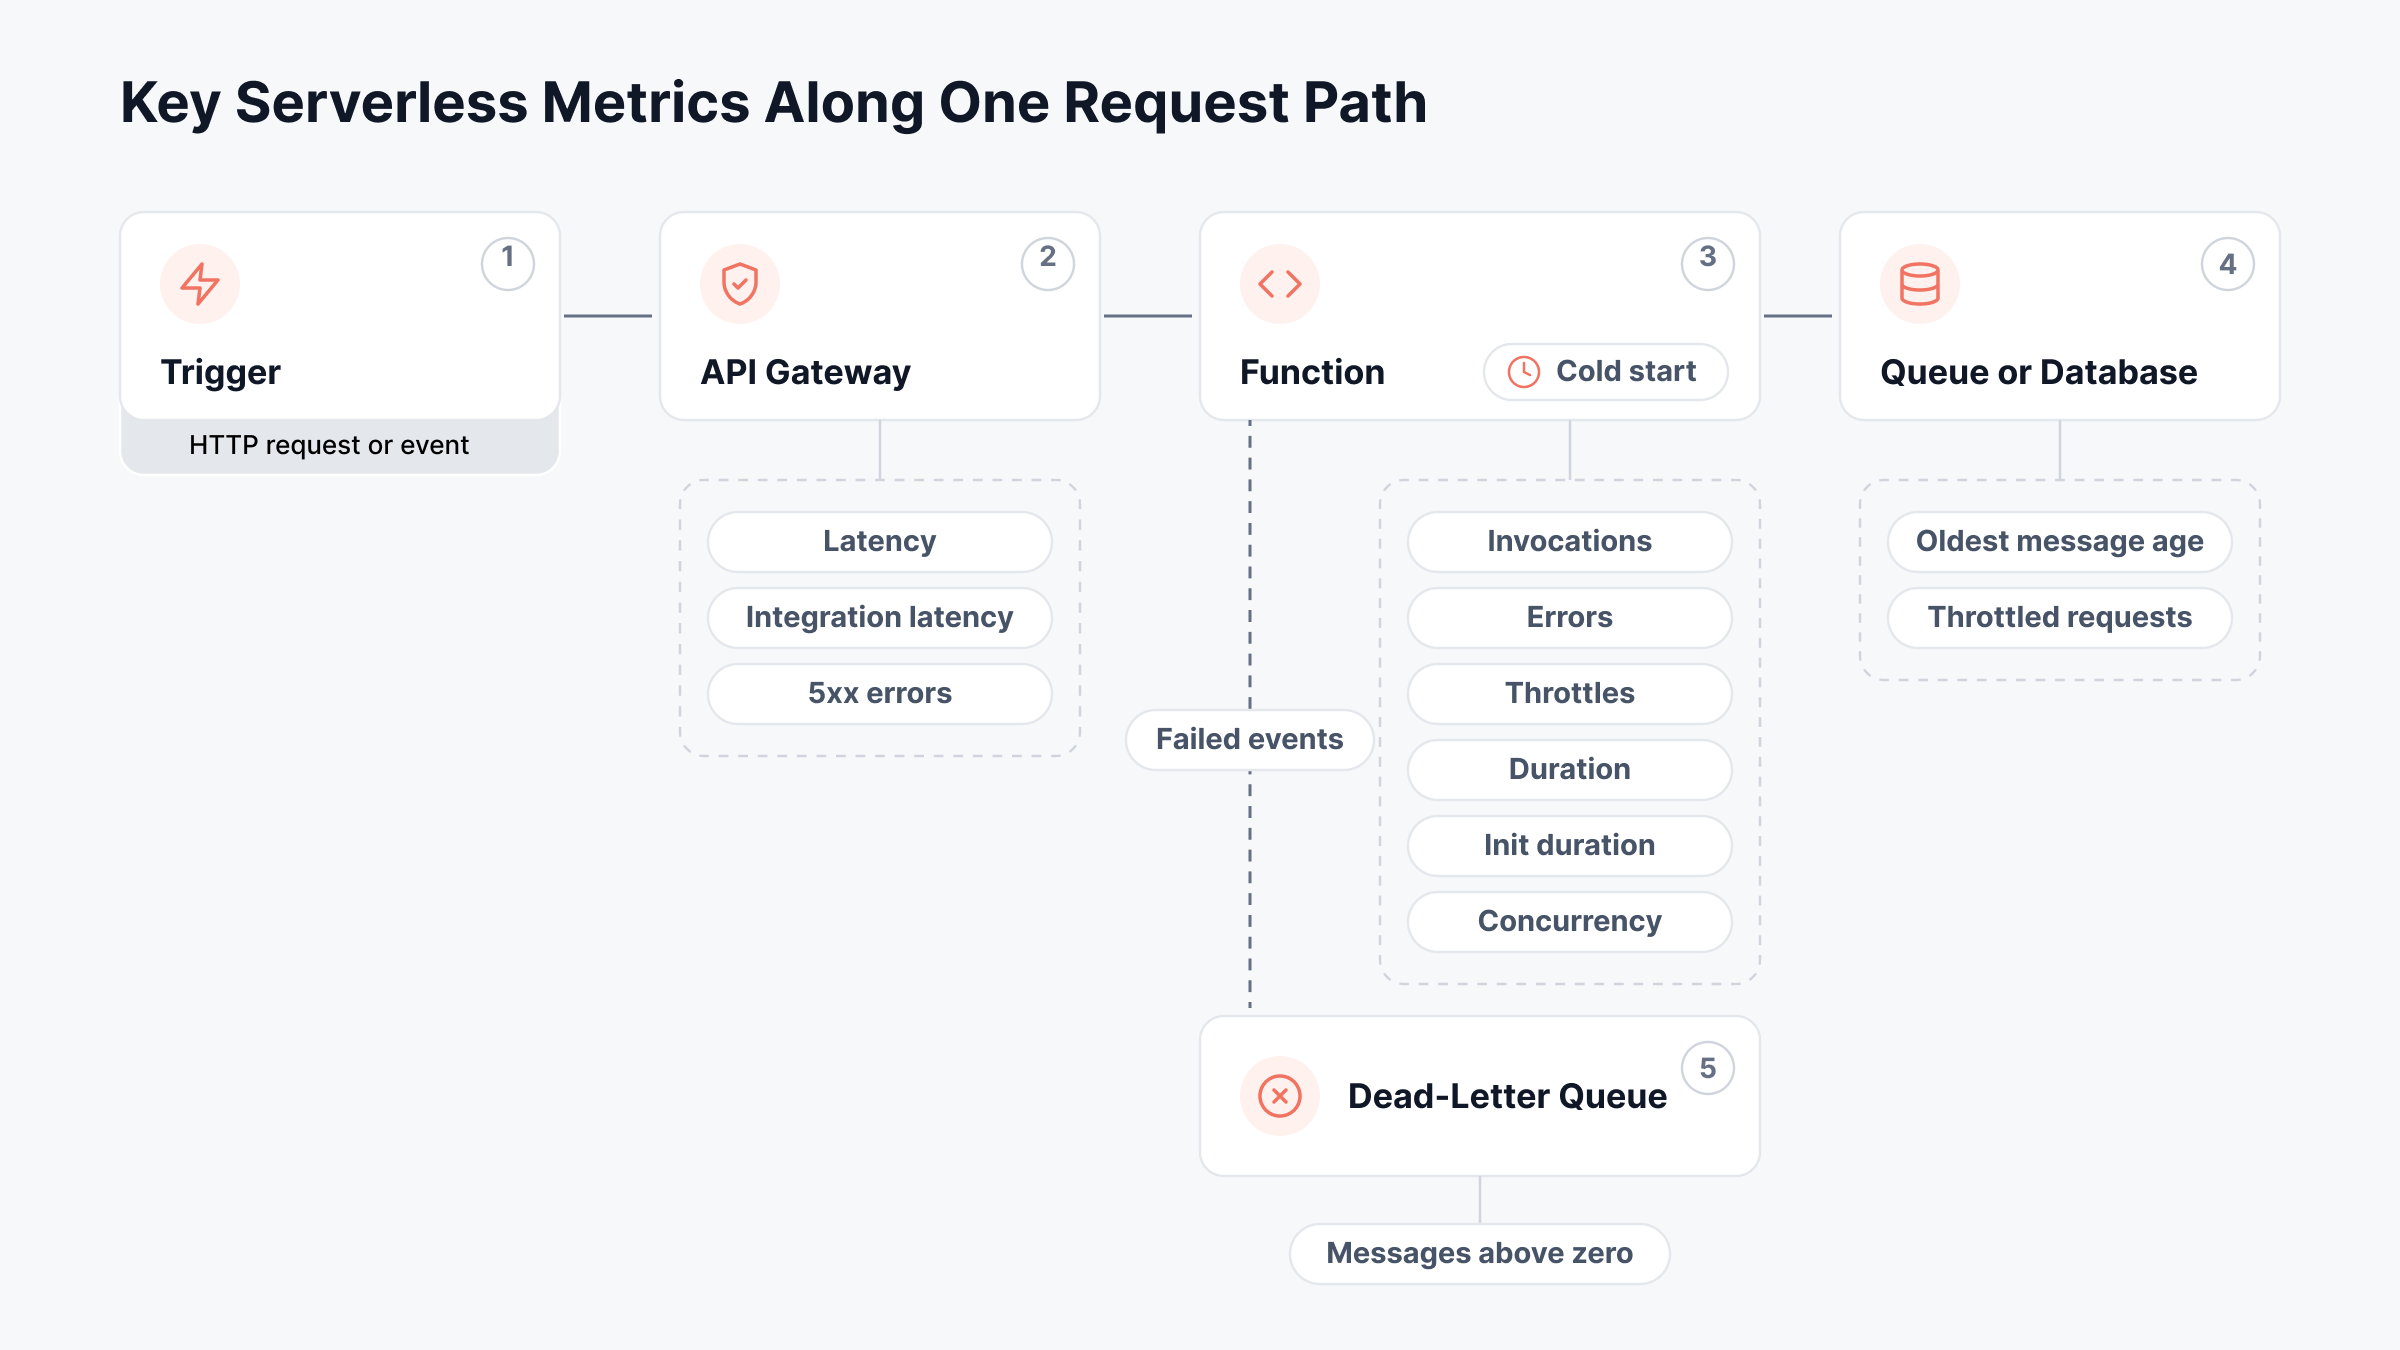
The table below summarizes these for the two platforms we encounter most often:
Signal | AWS Lambda (CloudWatch) | Azure Functions | What It Tells You |
Invocations | Invocations | Function execution count | How much traffic each function handles |
Errors | Errors | Failed executions in Application Insights | Runs that ended in an exception or a timeout |
Throttles | Throttles | Requests waiting in the application queue | Requests held back or rejected because of capacity limits |
Duration | Duration | Execution time in Application Insights | How long each run takes, which drives both latency and cost |
Cold-start time | Init Duration in the REPORT log line | No dedicated metric, so compare first-run times in Application Insights | How long a new instance takes to start |
Concurrency | ConcurrentExecutions | Instance counts in the scale controller logs | How close you are to a concurrency limit |
Iterator age | IteratorAge | Backlog on the Event Hubs or Service Bus trigger | Whether a stream consumer is falling behind |
Dead-letter errors | DeadLetterErrors | Messages in the poison queue | Events that failed every retry |
Memory | Max Memory Used in the REPORT log line | Memory working set | Whether the function has enough memory for its work |
Note that the Lambda metrics of Init Duration and Max Memory Used will only be available from the final log entry of an invocation (the REPORT line).
You'll need to use CloudWatch Lambda Insights or parse your CloudWatch logs to build a time series. Neither of these is presented by default in the CloudWatch console.
Watch the Services Around Your Functions
Finally, you should ensure that you also monitor the services interfacing with your functions. It's easy to assume the request is succeeding if your function is returning success, but this isn't guaranteed. Some useful metrics to consider include:
Service | Metric | Why It Matters |
API Gateway | Latency and IntegrationLatency | The gap between the two is time spent inside the gateway itself |
API Gateway | 5XXError | Server errors your users actually saw, including Lambda throttles and timeouts |
Amazon SQS | ApproximateAgeOfOldestMessage | How far behind your consumer functions are running |
DynamoDB | ReadThrottleEvents and WriteThrottleEvents | Database calls that were turned away and will slow your functions down |
Step Functions | ExecutionsFailed and ExecutionsTimedOut | Workflows that broke partway through |
Why Are Cold Starts Now a Cost Metric?
As explained previously, since August 1, 2025, the INIT stage of a Lambda function incurs a charge. Previously, if you were utilizing the default managed runtimes and deploying your function as a .ZIP file, you would not see any cost attributable to this period.
You will therefore accumulate additional billed time for each cold start, in addition to the normal execution.
A simple back-of-envelope calculation will give you a ballpark figure of the expected spend. Consider a Java-based Lambda with 2GB memory allocation and an INIT time of 3s. If the function sees 10M invocations monthly, and 5% are cold, then we have 500,000 cold starts.
Each will incur 3 × 2GB = 6GB-s of charges, giving a total of 3M GB-s. Using the current x86 price of $0.0000166667/GB-s, we can expect to pay roughly $50 a month.
Naturally, this is in excess of your regular Lambda spend. Multiply that by the number of functions in your environment and the figure can escalate rapidly.
Accordingly, you should also collect the % of invocations that result in a cold start. Upon deploying any change to your function(s), if you observe an increase in either the average INIT time or the % of cold starts, it is likely due to a new library or increased deployment size.
Options to minimize cold starts include enabling Lambda SnapStart or allocating Provisioned Concurrency. Note that the latter will continue to attract a standing cost. Each will need to be factored into your overall cloud cost optimization work.
What Is the Difference Between Serverless Monitoring and Serverless Observability?
While monitoring will alert you that an issue has arisen, observability enables you to determine what has caused it.
Typically, you'll configure monitoring rules to trigger an action when certain values exceed defined levels (e.g. an error rate > 1%, a queue backlog older than five minutes). However, observability tools can provide deeper insight into unexpected behavior.
In the context of a serverless solution, this distinction will be apparent almost immediately. You may receive a notification that your function has been throttled, but without further information, you'll have no idea why.
By instrumenting your entire flow with distributed tracing and ensuring your logs include a common identifier, you'll be able to pinpoint whether e.g. excessive retries from a preceding source have led to the behavior. An example comparison is shown below:
Serverless Monitoring | Serverless Observability | |
Question it answers | Is something wrong? | Why is it wrong? |
Main data | Platform metrics and thresholds | Traces, structured logs and detailed request fields |
Typical output | An alert or a dashboard | A request path you can follow from end to end |
Best for | Failure modes you already know about | Problems you didn't see coming |
Ideally, you'll deploy a combination of both capabilities in your environment. Of course, the split between observability and monitoring applies to non-serverless deployments too, but you'll appreciate the added complexity here.
How Do You Monitor AWS Lambda and Azure Functions?
Both AWS and Azure offer native tooling (Amazon CloudWatch; Azure Monitor and Application Insights) to allow you to begin monitoring your serverless functions. While these are a good base upon which to build, neither goes beyond the edge of its own cloud.
AWS Lambda
By default, a range of metrics will be published to CloudWatch for your functions at no extra cost. You'll also generate log records to CloudWatch on completion of each invocation.
As discussed, the last record (REPORT) contains details of the invocation's execution, including duration, billed duration, memory used and (for cold starts) init time.
If required, you can extend this by turning on CloudWatch Lambda Insights for your busiest functions. This will provision an extension to your deployment and expose a further set of function-specific metrics (memory, CPU and data transferred).
Finally, to gain a view of the end-to-end path of a request, you can utilize AWS X-Ray to trace the activity initiated by an API call and captured by your function(s) and downstream resources (e.g. DynamoDB).
Azure Functions
Similarly, Azure will collect and publish a selection of metrics for your functions to Azure Monitor. For troubleshooting purposes, however, you'll primarily look to Application Insights to obtain execution time, error rates, call volumes to external systems and distributed trace data.
One caveat to note is that if you're currently hosting your Azure Functions on the Linux Consumption plan, Microsoft will retire that plan on September 30, 2028. New features are now going to the Flex Consumption plan, which reports its own set of metrics.
Existing functions running the v3 runtime on the legacy plan ceased to operate after September 30, 2026. You should verify that your reporting and alerting continue to populate once you've migrated.
Deploying functions on both AWS and Azure will necessitate managing two portals, alert configurations and disparate nomenclature. At this stage, many organizations will seek a unified platform to consolidate their views.
What Are the Best Practices for Serverless Monitoring?
Broadly, you'll primarily want to focus on rates, limits and the full path of a request. Here is our starting list of 8:
1. Error rate vs number of errors
You don't want a fixed count to trigger for highly invoked functions, or fail to trigger on low volumes. For example, if a function is called 2 million times per day and generates 400 errors, the error rate is 0.02%. Alternatively, a second function may see 40 errors from 200 invocations, i.e. 20%, despite a count ten times smaller.
2. Concurrency limit
You should raise a warning once your concurrent executions approach the limit (e.g. at roughly 80%) for your AWS (or other) account. Beyond this point, other (unrelated) functions in the account/Region could see throttling.
3. Reserved concurrency
By reserving a certain level of concurrency, you ensure a minimum allocation to that function, and also place a maximum on it. This prevents an individual function monopolizing the available pool.
4. Correlate a request across multiple steps
Inject a unique identifier at the point of ingress, and propagate this through downstream systems e.g. message queues, published events, logs, etc. This will be invaluable if you need to investigate why a given customer order has failed.
5. Structured logging
Having your logs in a format such as JSON, including the function name, associated request ID and whether a cold start occurred, will greatly facilitate querying. You can configure Lambda to output JSON-formatted logs.
6. Monitor DLQ depth
If an event does not succeed after the configured retries, it will be deposited in the dead-letter queue (DLQ). No one will know about this unless you explicitly check, so again a threshold-based alert is recommended (> 0).
7. Cost
Lambda costs are driven by execution time x allocated memory. Plotting cost against performance will highlight any anomalous behavior, and a suitable budget alert (e.g. AWS Budgets, Azure Cost Management) should prevent a large surprise at the end of the billing period.
8. Apply tags
Whether it's by team, logical grouping or environment, you will want to be able to aggregate your data according to the structure of your organization. While it may seem minor at first, this is one of those AWS monitoring best practices that becomes extremely powerful as your deployment of serverless grows.
What Should You Look for in a Serverless Monitoring Tool?
You will expect the product to passively gather function statistics, span all of your clouds and provide visibility into adjacent services. Native offerings will meet the first criterion reasonably well if confined to one ecosystem.
Once you deploy serverless across multiple clouds or in addition to your conventional compute, you will find shortfalls. These are the key things to validate during a proof of concept (POC):
It can gather data from Lambda and Azure Functions without requiring any instrumentation.
It gives visibility of other services that your serverless code interacts with.
It supports rate-based and compound alerts (i.e. combining multiple data points).
It offers unified visualization of your serverless and non-serverless assets.
Finally, if you have predominantly an AWS footprint, it's worth considering the vendor's approach to AWS monitoring across your wider environment. There will usually be other areas of interest beyond just your serverless deployments.
Reading Serverless Signals Together in ObserveOps
It's unlikely that any individual metric will give you the answer to a problem you're experiencing with your serverless stack, but by combining several, it's possible to form a picture.
ObserveOps gathers AWS Lambda and Azure Functions data via the cloud APIs, and extends this to include API Gateway, SQS and DynamoDB. Some illustrative examples follow:
1. Throttles Rise While Concurrency Stays Flat
aws.lambda.throttles / aws.lambda.concurrent.executions / aws.lambda.unreserved.concurrent.executions
The number of invocations returned with a 429 response will indicate that a function has encountered some form of limit. However, further investigation is required to determine which one.
Comparing the above will typically reveal whether a particular function's concurrency has plateaued (likely due to its reserved limit), or if the unreserved pool has become saturated, causing all unreserved functions in the region to be impacted.
2. Spillover Means Provisioned Concurrency Is Too Small
aws.lambda.provisioned.concurrency.utilization.percent / aws.lambda.provisioned.concurrency.spillover.invocations
The former describes the utilization of your Provisioned Concurrency, while the latter gives the volume of invocations that have fallen back onto standard concurrency.
Note that any non-zero reading implies that customers have experienced a cold start, despite you incurring the additional cost to prevent this.
If you observe 95% utilization during your expected high-volume period and spillover reaches 1,200 invocations an hour, you should increase your allocation.
Conversely, if you consistently see 20% utilization throughout the day, you're incurring unnecessary expense.
3. Iterator Age Climbs While Errors Stay at Zero
aws.lambda.iterator.age.ms / aws.lambda.errors
If your function consumes records from e.g. Kinesis Data Streams or DynamoDB Streams, the above metric indicates the age of the final item processed in each consumption batch.
If this keeps climbing while no errors are observed, the function can't keep up, and you may find that you simply need to scale out the function by adding further shards, increasing the batch size and/or allocating more memory.
Of course, if you do observe errors, you should also review aws.lambda.dead.letter.errors. This indicates the number of events that have failed to be written to your DLQ, i.e. completely lost.
3. Gateway Latency Rises While Integration Latency Holds
aws.rest.api.gateway.latency.ms / aws.rest.api.gateway.integration.latency.ms (and equivalent for HTTP APIs)
Both metrics represent the time taken for an incoming HTTP(S) call to complete via API Gateway, with the latter restricted to the period waiting on your target system (typically a function).
Therefore, if you notice the former increase significantly (e.g. from 120 ms to 450 ms) while the latter remains relatively constant (around 100 ms), you should inspect the configuration of API Gateway.
Common culprits include the presence of an authorizer, custom request transformations or a high rate of cache misses (check aws.rest.api.gateway.cache.miss). If they both increase, your function (or any dependent system) is taking longer to respond.
4. Queue Age and Database Throttles Behind a Function
aws.sqs.oldest.message.age.seconds / aws.sqs.hidden.messages / aws.dynamodb.read.throttled.requests & aws.dynamodb.write.throttled.requests
The age of the oldest unread message in a queue, and the number of hidden messages (consumed but not acknowledged) can give an indication of how quickly the downstream function(s) are able to process work.
If the message age increases while the hidden count stays elevated, then the consumer(s) are likely experiencing high load. Alternatively, if the message age rises as the hidden message count reduces, then they may be subject to throttling.
In turn, you should look to aws.dynamodb.read.throttled.requests and aws.dynamodb.write.throttled.requests to establish whether a DynamoDB table has exceeded its capacity, forcing the function to take longer to complete its task. The knock-on effect is increased time held in the concurrency pool.
5. Azure Functions: Queued Requests and Gen 2 Collections
azure.function.request.queued.requests / azure.function.executions / azure.function.gen.2.collections & azure.function.memory.used.bytes / azure.function.execution.units
For Azure, ObserveOps will retrieve these metrics as part of Azure monitoring. The number of queued requests relative to executed functions will similarly indicate whether the application can sustain the incoming volume.
If gen 2 collections and memory used are trending upwards, then the function may be constrained by insufficient memory, triggering costly Gen 2 garbage collection cycles.
Lastly, note that the execution unit is expressed in MB-milliseconds, so dividing azure.function.execution.units by 1,024,000 yields the GB-seconds charged by Microsoft.
One final caveat is that duration and cold-start metrics are not returned by ObserveOps for Lambda, and so must be sourced from CloudWatch and the REPORT entry respectively. Assuming you're happy with that, the following is a reasonable starting point:
Symptom | Signals to Compare | Likely Cause |
Throttles climb while one function's concurrency flattens | aws.lambda.throttles, aws.lambda.concurrent.executions | Reserved concurrency set too low |
Unreserved concurrency hits a ceiling | aws.lambda.unreserved.concurrent.executions | The shared account pool is full |
Spillover above zero at peak | aws.lambda.provisioned.concurrency.spillover.invocations | Provisioned concurrency set too low |
Iterator age climbs with no errors | aws.lambda.iterator.age.ms, aws.lambda.errors | The function can't keep up with the stream |
Failed events go missing | aws.lambda.dead.letter.errors | A missing or misconfigured dead-letter queue |
Gateway latency rises, integration latency holds | aws.rest.api.gateway.latency.ms, aws.rest.api.gateway.integration.latency.ms | Authorizer, mapping or cache delays in the gateway |
Queue age climbs while in-flight messages drop | aws.sqs.oldest.message.age.seconds, aws.sqs.hidden.messages | Consumer functions throttled or failing |
Queued requests grow on Azure | azure.function.request.queued.requests, azure.function.executions | The function app can't scale out fast enough |
Monitor Serverless Functions With Motadata ObserveOps
Given that there is no host system on which to monitor your serverless, serverless monitoring relies on the metrics exposed to you.
Invocation count, errors, throttles and duration form the minimum, with additional data points such as concurrent executions, iterator age and DLQ entries allowing you to identify emerging trends. Naturally, with cold-start time now visible on the bill, this should also be factored in.
More broadly, as highlighted, it's important to monitor the whole journey of a request to surface potential faults elsewhere.
We developed ObserveOps as part of our unified observability and ITSM platform, and so it allows you to consolidate information from Lambda, Azure Functions, API Gateway, SQS and DynamoDB with the remainder of your estate.
You should be able to pinpoint the origin of any performance degradation ahead of your end-customers.
FAQs
Can you monitor Google Cloud Functions the same way?
Yes, similar metrics can be gathered from the equivalent GCP functions, now known as Cloud Run functions. These would be accessible via the Google Cloud Monitoring API. At present, ObserveOps doesn't offer coverage of these, so you would use Google's own tools.
What is the default AWS Lambda concurrency limit?
By default, an AWS account will be allocated 1,000 concurrent executions per AWS Region. This will be distributed across all deployed functions. You can request an increase through the Service Quotas console. New accounts may be granted a reduced value pending growth of their workload.
Do monitoring tools slow down Lambda functions?
Standard CloudWatch metrics add no overhead, as Lambda natively emits them. The inclusion of an Extension and/or a tracing layer may incur a small init and memory penalty. We recommend comparing your functions' Init Duration before and after adding one.
How long does CloudWatch keep Lambda metrics?
Data is available at 1-minute granularity for 15 days, 5-minute for 63 days and 1-hour for 455 days. You should consider exporting the data that you expect to require in the longer term.
Can ObserveOps alert on Lambda throttles?
Yes. ObserveOps gathers the relevant data from AWS, including throttles, errors and concurrent executions (as well as spillover from Provisioned Concurrency). You can define alert conditions against each of these.
Author
Ramya Shah
Technical Writer
Ramya Shah is a technical content writer with a computer engineering background and roots in automotive journalism. He covers IT Service Management, observability, IT operations, and AI-driven automation. An early adopter of AI-assisted writing workflows, he turns complex IT processes into clear, engaging content optimized for search and answer engines (AEO), lifting content output and organic visibility.