What Is LLM Observability? A Complete Guide
If you run LLM features in production, your most dangerous failures are the ones your monitoring never flags.
Your LLM feature passed every test, and the demo went great. Three weeks after launch, a support ticket lands: the chatbot quoted a refund policy that does not exist.
The dashboards are all green, and the same prompt answers correctly when you retry it.
This is the blind spot LLM observability exists to close. Your existing tools saw the request come back fast with a clean status code.
They told you nothing about whether the answer was true, safe, or worth the tokens it burned.
The stakes are real. Gartner reported in January 2026 that at least 50 percent of generative AI projects were abandoned after proof of concept by the end of 2025.
Escalating costs and unclear business value were among the named reasons. Untraceable quality problems feed both.
In this guide, you will see:
What LLM observability means, and why your current monitoring misses LLM failures.
The three pillars that structure the practice: computational, semantic, and agentic observability.
The metrics worth tracking, from time to first token to cost per session.
How tracing, evaluations, and the OpenTelemetry GenAI conventions work together.
Six implementation steps and a checklist you can run this week.
By the end, you will know what to instrument first and how to catch a bad answer before your users do.
What Is LLM Observability?
LLM observability is the practice of collecting telemetry from large language model applications so you can understand, debug, and improve how they behave in production.
That telemetry includes prompts, responses, token counts, latencies, tool calls, and quality scores.
The core idea comes from observability. Here, you explain a system's internal state from its outputs. LLM observability does the same for systems whose outputs are dynamic, and change from one run to the next.
The scope covers the whole application, end to end. A production-grade LLM app covers prompt templates, retrieval steps, model calls, and tool invocations. Any link in that chain can produce a bad answer.
That expands what counts as telemetry. You still record how long a request took, what was asked, what came back, what it cost, and whether the answer was any good.
Why Do LLM Applications Need Observability?
LLM applications need observability because they fail silently. A conventional service that breaks throws an exception, fails a health check, or fills an error log.
An LLM app that breaks will still answer. It just answers badly, and it usually does so in a polite, confident tone. The exposure is no longer niche either.
According to McKinsey's 2025 State of AI survey, 88% of organizations are using regular AI in at least one business function. These silent failures now sit in customer-facing products, not lab demos.
Here are the five failure modes that come up again and again in production LLM apps:
Hallucinations: The model states false information with complete confidence, and the response still looks well-formed to every traditional check you have.
Cost overruns: Token spend grows with every retry, oversized context window, and chatty agent loop. The bill then arrives weeks after the habit forms.
Prompt injection: A user crafts input that overrides your system prompt and steers the model into doing something you never intended.
Data leakage: A response exposes personal or internal data. That data slipped in through the prompt, the retrieved context, or the model's output.
Quality drift: A model version update or a small prompt edit quietly degrades answers, and nobody notices until users start leaving.
None of these show up on a CPU graph. To catch them, your telemetry has to look at what the app said, not only how fast it said it.
The Three Pillars of LLM Observability
Most teams organize LLM observability into three pillars: computational, semantic, and agentic. Together they cover what the app spends, what it says, and how it got there.
Pillar 1: Computational Observability (Latency, Tokens, and Cost)
Computational observability tracks the running costs of your LLM app. It watches request latency, token use, API cost, throughput, and error rates like rate limits or model downtime.
These numbers decide whether the feature is affordable and usable. Latency needs a closer look here than in a normal web service. A chatbot that streams its first token in 400 milliseconds feels instant.
One that stays silent for 3 seconds feels broken, even if both finish at the same time. That is why time to first token gets tracked on its own, apart from total response time.
Pillar 2: Semantic Observability (Output Quality and Evaluations)
Semantic observability measures the quality of the text itself. It scores hallucination rate, groundedness (whether the retrieved context supports the answer), relevance to the question, and safety signals like toxicity or bias.
Traditional tooling has no equivalent for these. That gap is what makes LLM observability its own category.
Teams score quality three ways in practice. A second model can grade outputs against a rubric, the method known as LLM-as-a-judge. Users can rate the LLM answers with a thumbs up or down.
And people can review a sample of responses by hand. Honestly, the judge scores are probabilistic too, so mature teams calibrate them against human-labeled examples instead of trusting them blind.
Pillar 3: Agentic and RAG Observability (Multi-Step Workflow Tracing)
Agentic and RAG observability traces workflows where the model call is only one step among many. For retrieval-augmented generation, that means tracking retrieval quality.
An answer often fails one step before the model, when the vector database returns the wrong documents.
For autonomous agents, the trace captures the trajectory. That is the exact sequence of steps, tool calls, and branching decisions the agent took.
Say an agent loops four times through the same tool before giving up. The trajectory is the only place that shows it.
9 Key LLM Observability Metrics to Track
Here are the core metrics most LLM observability setups track, grouped by the pillar each one serves.
Metric | What It Tells You | Pillar |
Time to first token | How long the user stares at a blank screen before the answer starts. | Computational |
Total response latency | End-to-end time for the full answer, including retrieval and tool calls. | Computational |
Tokens per request | Input and output token counts, the raw driver of your API bill. | Computational |
Cost per session | What one user conversation actually costs, retries included. | Computational |
Error rate | Failed calls from rate limits, timeouts, or provider outages. | Computational |
Groundedness score | Whether the answer is supported by the retrieved context or invented. | Semantic |
Relevance score | Whether the answer addresses what the user actually asked. | Semantic |
Retrieval relevance | Whether the vector search returned the right documents at all. | Agentic and RAG |
Tool-call success rate | How often agent tool invocations complete and return usable results. | Agentic and RAG |
Nine metrics is the full menu, not the starting order. For your first app, begin with four: total latency, cost per session, error rate, and one quality score. Add the rest once those dashboards get daily use.
What Are the Benefits of LLM Observability?
The primary benefit of LLM observability is control. Once you can see what your app said, spent, and retrieved, you can improve all three on purpose. Here are the four key benefits of LLM observability:
Faster debugging: A full trace shows the prompt, the retrieved context, and the model output together. Finding out why an answer went bad becomes a five-minute read instead of a guessing game.
Cost control: You can see which prompts, sessions, and agent loops burn the most tokens. That lets you trim spend on purpose, not after the invoice lands.
Confident iteration: A golden dataset lets you change prompts and swap models with regression results behind the call. You see the impact of a change before rollout.
Safer releases: Live signals flag prompt injection and data leakage as they happen. You catch them before a user does, not after the incident report.
How Does LLM Observability Work?
LLM observability works in three moves: you instrument the application to emit traces, you standardize that telemetry so it stays portable, and you feed it into dashboards, alerts, and feedback loops. Each move answers a different question.
1. Instrumentation and Tracing
Instrumentation means wrapping your model and framework calls with an SDK or proxy that records every request.
Each user interaction becomes a trace made of spans, one for each step: rendering the prompt, querying the vector store, calling the model, invoking a tool. The pattern borrows directly from distributed tracing in microservices.
What goes inside each span matters more than the span itself. Capture the prompt, the response, the model name and parameters, and the token counts. That payload turns a slow request from a mystery into a five-minute fix.
2. Telemetry Standards: OpenTelemetry GenAI Semantic Conventions
OpenTelemetry is the open standard behind most modern instrumentation. It now defines GenAI semantic conventions: agreed attribute names for model calls.
They cover the model used, the input and output token counts, and the operation type. The conventions were still maturing as of 2026.
Even so, they already do the main job of a standard, which is to keep your instrumentation portable instead of locked to one vendor's SDK.
If you are new to the standard itself, our guide to OpenTelemetry covers how its traces, metrics, and logs fit together.
3. Dashboards, Alerts, and Feedback Loops
The collected data earns its keep when it changes behavior. Dashboards track the metric set above.
Alerts fire on behavior, not only on errors: a cost-per-session spike, a groundedness score that dropped after a prompt edit, or a surge of inputs that match injection patterns.
Fixed thresholds catch some of this. But LLM workloads swing with usage, so anomaly detection against learned baselines beats static rules here.
The feedback loop closes when someone reviews the flagged traces and feeds them back into prompt fixes and test sets.
LLM Observability vs. Traditional Observability: 5 Key Differences
The short version: monitoring watches known signals for known failures. Observability explains failures you did not predict, a difference we cover in our comparison of observability vs. monitoring.
LLM systems stretch that difference to its limit. With a probabilistic model, almost every failure is one you did not predict.
Here is how the two practices differ dimension by dimension.
Dimension | Traditional Observability | LLM Observability |
Failure signal | Errors, exceptions, failed health checks | Plausible answers that are wrong, unsafe, or off-topic |
System behavior | Deterministic: same input, same output | Probabilistic: same input can produce different outputs |
Core telemetry unit | Request timings and resource metrics | Prompt-response pairs with tokens, cost, and context |
Quality measure | Uptime, latency, error rate | Groundedness, relevance, safety, user feedback |
Debugging artifact | Stack trace and logs | Full trace of prompts, retrievals, and tool calls |
One practice does not replace the other. Your LLM app still runs on services, databases, and networks that need classic observability underneath. The fastest debugging happens when both views sit side by side.
What Runs Underneath Your LLM Application on AWS?
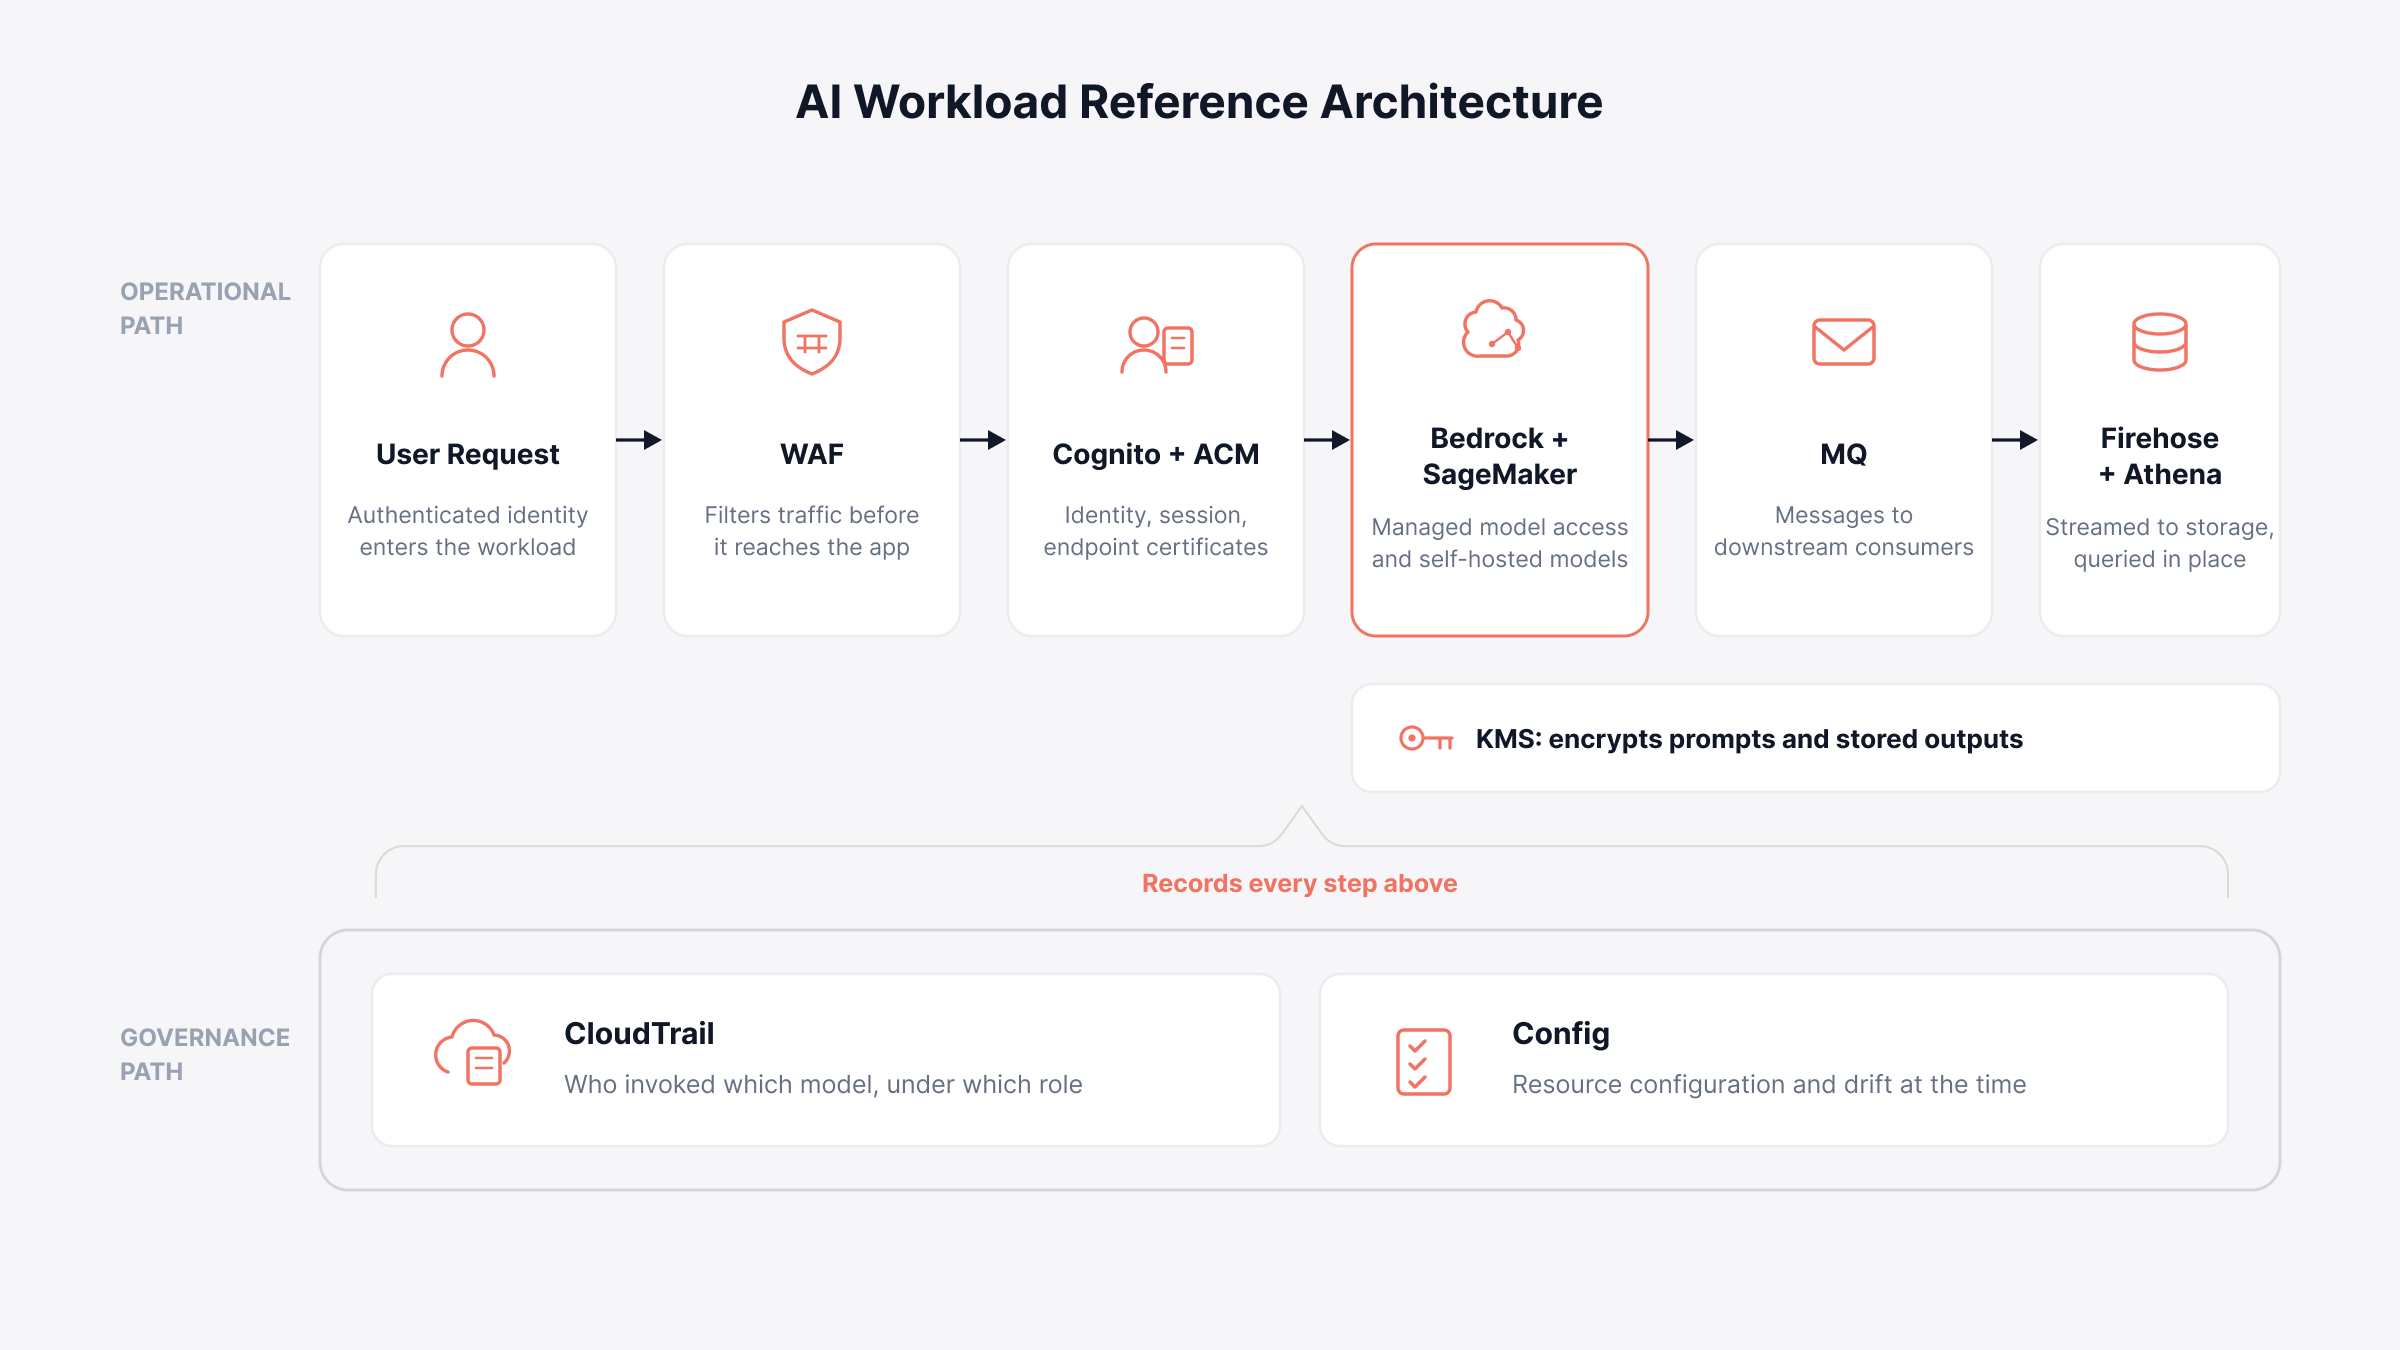
An AI workload on AWS is a chain of managed services, and the model call is only one link in it. Inference, data movement, identity, encryption, and audit all produce their own signals.
Two paths run through that chain at once:
The operational path: a user is authenticated, a model is invoked, output moves downstream, results get queried later
The governance path: what happened, which permissions allowed it, and what the configuration looked like at that moment
Most instrumentation covers the first path and leaves the second one to the security review. That gap is the argument for treating AWS monitoring as one system instead of a per-service dashboard habit.
Layer | Services | Path |
AI and ML workload | Bedrock, SageMaker | Operational |
Data movement and analysis | Firehose, Athena | Operational |
Identity, certificates, encryption | Cognito, ACM, KMS | Both |
Audit and configuration state | CloudTrail, Config | Governance |
Threat control and messaging | WAF, MQ | Both |
The AI and ML Workload Layer
Bedrock and SageMaker carry the inference itself. Bedrock provides managed access to foundation models, while SageMaker covers models you train, tune, and host yourself.
Signals worth pulling from this layer:
Invocation volume: calls per model, per endpoint, and per calling role
Throttling: quota rejections, which reach your application as retries and quietly double token spend
Endpoint latency: the server-side number behind what your traces log as a slow model call
Error responses: provider-side failures separated from application-side ones
Agent workloads multiply every one of these, because a single user request can trigger several model calls in sequence. Our guide to agent observability covers tracing those trajectories.
Data Movement and Analysis
Firehose and Athena handle telemetry after capture. Firehose streams prompt and response records, evaluation scores, and access logs into storage without a custom pipeline behind it.
Athena then queries that history in place, which is how you answer cost and quality questions spanning months instead of hours.
What to watch:
Delivery failures: a backed-up stream means the traces you needed for an incident review were never written
Buffer backlog: growing lag between capture time and queryable time
Query duration and cost: scans that grow faster than the data behind them
Identity, Certificates, and Encryption
Cognito, ACM, and KMS decide who reaches the model and whether the data around it stays protected.
Cognito: authenticates the end user and carries the identity that later appears in your audit records
ACM: manages certificates on the endpoints in front of your application
KMS: holds the keys encrypting prompts and stored outputs at rest
Expiry is the failure mode to watch here. A lapsed certificate or a rotated key takes an AI feature down as completely as a model outage, with none of the same warning signs.
Audit and Configuration State
CloudTrail and Config answer the two questions that follow every AI incident: what was called, and what was the setup at the time.
CloudTrail: records API activity across the workload, model invocations and permission changes included
Config: tracks resource configuration and drift, so the state during an incident can be compared against the state you believed you had
Threat Control and Messaging Dependencies
WAF and MQ guard the edges of the workload.
WAF: filters malicious traffic before it reaches your application, and its block patterns often surface prompt injection attempts earlier than an evaluation layer will
MQ: moves messages between the application and downstream consumers, where queue depth and consumer lag show up as unexplained latency in the answer
Coverage across the wider AWS account, beyond the AI services listed here, is set out in our AWS monitoring best practices guide.
Why CloudTrail Monitoring Matters for AI Workloads
CloudTrail monitoring gives you the only record of who invoked a model, under which role, and with what parameters. Your LLM traces show the prompt and the answer, while AWS CloudTrail shows the identity and the permission path behind that call.
The distinction gets tested during incidents. A leaked response is a quality problem in your trace data and an access problem in your audit trail, and the two views reconcile only if both were being collected all along.
Four patterns are worth alerting on:
Model invocation calls: roles reaching Bedrock or SageMaker with no business reason to
Permission and policy changes: IAM edits landing shortly before a shift in application behavior
Key usage: KMS operations that do not match your stated encryption policy
Failed call clusters: repeated denials concentrating around a single identity
Pair those with configuration drift from Config and an AI incident can be reconstructed end to end.
What Types of LLM Observability Tools Exist?
LLM observability tools fall into two camps: dedicated LLM platforms and general observability suites that added LLM features. Here is what each camp does best.
1. Dedicated LLM Observability Platforms
Dedicated platforms focus on prompt-level tracing, evaluation pipelines, and prompt management for engineering teams building GenAI products.
Open-source options like Langfuse and Arize Phoenix sit in this camp, alongside commercial platforms built around evaluation workflows.
2. Full-Stack Observability Suites With LLM Features
The suites approach the problem from the other side, extending full-stack observability so LLM telemetry lands next to the infrastructure and application data they already collect.
Plenty of teams end up running one of each, a dedicated tool for evals and a suite for everything underneath.
Expect both camps to keep growing. The Business Research Company put the LLM observability market at 2.69 billion dollars in 2026 and projects 9.26 billion dollars by 2030.
How Do You Implement LLM Observability?
You implement LLM observability by instrumenting early, tracing everything, and adding evaluation on top, in that order. The six steps below are the sequence that works.
1. Instrument Your Application First
Add the SDK or proxy before you build a single dashboard, because traces cannot be backfilled. Every week you run uninstrumented is production behavior you will never get back.
2. Capture Full Traces, Not Just Metrics
Averages hide the answers that hurt you. A dashboard can show healthy mean latency and a fine error rate while one customer in twenty gets a hallucinated refund policy.
So keep the full prompt and response payloads, with PII redacted at capture time, and make individual traces searchable.
3. Set Cost and Latency Baselines
Work out what a normal session costs and how long a normal answer takes. Do this per feature, not per app.
You cannot alert on abnormal until you have written down normal. The per-feature split matters because a summarizer and an agent have very different baselines.
4. Run Quality Evaluations on Production Traffic
Score a sample of live responses with an LLM-as-a-judge rubric for groundedness and relevance. A 5 to 10 percent sample is a common starting point.
Calibrate the judge against human-labeled examples first. Then track the scores over time, the same way you track latency.
5. Build a Golden Dataset From Real Traces
Collect your most useful production traces (the failures, the edge cases, the perfect answers) into a versioned test set with expected behavior.
Every prompt change and model upgrade then runs against that set before rollout. That turns gut-feel releases into regression-tested ones.
6. Alert on Behavior, Not Just Errors
Wire alerts to the signals that precede user pain: cost per session jumping, groundedness sliding after a deploy, tool-call success dropping, injection-shaped inputs clustering. Error-based alerting alone will sleep through all four.
LLM Observability Checklist for AI Engineering Teams
Run this list against your current setup and count the gaps.
Every model call is wrapped by an instrumentation SDK or proxy.
Each request produces a full trace: prompt, retrieval, model call, tool calls.
Prompt and response payloads are stored with PII redacted at capture.
Token counts and cost are tracked per request and rolled up per session.
Time to first token and total latency are tracked separately.
A quality score (groundedness or relevance) runs on sampled production traffic.
The judge model is calibrated against human-labeled examples.
Retrieval relevance is measured for every RAG pipeline.
A versioned golden dataset gates prompt and model changes.
Alerts fire on cost spikes and quality drops, not only on errors.
Most teams pass the first four items and fail the last six. The first four make you aware of problems. The last six let you fix them before users notice.
Make Your LLM Apps Something You Can Explain
Some teams ship reliable LLM features. Others quietly shelve them. The difference is simple to state.
The first group can explain every answer their app gave: what it cost, where the context came from, and why it was good or bad. That explanation is what LLM observability buys.
The honest part is that it is not free. Instrumentation takes engineering time, and evaluation adds its own model costs.
The quality scores you get back are probabilistic too, so they need human spot-checks rather than blind trust.
Teams that pay that cost get something the rest do not. They can change prompts, swap models, and ship agent features with evidence instead of hope.
As LLM apps move deeper into customer-facing work, that evidence keeps a GenAI project off next year's abandoned list.
FAQs
What is observability for LLM agents?
Agent observability tracks an autonomous agent's trajectory: the sequence of reasoning steps, tool calls, and branching decisions behind a result.
It matters because agents fail in ways single model calls cannot, like looping on a tool or picking the wrong one. The trajectory is often the only record of why.
What is the difference between LLM observability and LLM monitoring?
LLM monitoring watches known metrics like latency, error rate, and token spend, and alerts when a threshold is crossed.
LLM observability captures full traces, prompts, responses, and quality scores to explain failures you never predicted. Monitoring tells you something is wrong; observability tells you why.
What is LLM-as-a-judge?
LLM-as-a-judge is an evaluation method where a second model scores your app's outputs against a rubric, checking groundedness, relevance, or tone.
It scales quality measurement beyond what human review can cover. The judge is probabilistic too, so teams calibrate it against human-labeled examples first.
Is OpenTelemetry enough for LLM observability?
OpenTelemetry gives you the transport and naming standard: its GenAI semantic conventions record model calls, token counts, and operations in a portable way.
It does not evaluate output quality, so you still need an evaluation layer on top. It is the plumbing, not the quality test.
What is the difference between LLM observability and LLM evaluation?
LLM evaluation tests outputs before deployment, usually against fixed datasets, to decide whether a model or prompt is good enough to ship.
LLM observability watches the same qualities live in production, on real user traffic. Evaluation gates the release; observability catches what slips through afterward.
Author
Ramya Shah
Technical Writer
Ramya Shah is a technical content writer with a computer engineering background and roots in automotive journalism. He covers IT Service Management, observability, IT operations, and AI-driven automation. An early adopter of AI-assisted writing workflows, he turns complex IT processes into clear, engaging content optimized for search and answer engines (AEO), lifting content output and organic visibility.