8 Best Sumo Logic Alternatives for Log Management in 2026
If Sumo Logic no longer fits your log management and monitoring needs, it may be worth looking at other options.
The main reason for switching usually comes down to cost, deployment, or the type of monitoring you need.
As your log volume grows, Sumo Logic can become harder to budget for. An on-premises solution may be necessary if your logs cannot be sent to a cloud service.
A broader monitoring setup may also require one platform for logs, servers, applications, and network devices. In that case, moving to another cloud-based log management tool may not solve the problem.
In this guide, we compare eight Sumo Logic alternatives based on their features, use cases, limitations, and pricing.
A Quick Comparison of Sumo Logic Alternatives in 2026
Let’s have a quick glance at each tool from this table.
Tool | Best for | Setup choices | Free option | Starting price |
Motadata ObserveOps | Logs, apps, servers, and networks in one place | On-premises, private cloud, or hosted | Free trial | Custom quote |
Splunk | Large companies and security teams | Cloud or self-managed | 60-day Splunk Enterprise trial | Custom quote |
Datadog | Cloud apps and containers | Cloud | 14-day trial | Log intake starts at $0.10 per GB |
Elastic Cloud | Detailed log searches and storage control | Cloud or self-managed | Free self-managed Basic plan | Elastic Cloud starts at $99 per month |
Grafana Cloud | Grafana and Loki users | Cloud, with open-source self-hosted tools | 50 GB of logs per month | Pro has a $19 monthly platform fee, then usage charges |
New Relic | Small teams with many hosts | Cloud | 100 GB of data per month | $0.40 per GB above the free limit for Original Data |
Dynatrace | Large apps that need logs linked with app and server data | SaaS or managed deployment | 15-day trial | Log intake starts at $0.20 per GiB |
SigNoz | OpenTelemetry and self-hosting | Cloud or self-managed | Free Community edition | Cloud starts at $49 per month |
Why Do Teams Look for a Sumo Logic Alternative?
Teams often leave Sumo Logic for one of the following reasons.
Challenge 1: Estimating the total cost
Sumo Logic uses credits instead of one simple monthly rate. The number of credits you use depends on the type of data and what you do with it. Some teams are happy with this model. Others want a price for every GB of logs or a fixed plan with a set data limit.
Before you switch, use your real daily log volume in every price check. Include busy days, storage time, and the number of logs that people search often. A low intake price may not include search, indexing, or storage.
Challenge 2: Finding an on-premises deployment option
Some banks, public bodies, factories, and health companies have strict rules about where data can be stored. Sumo Logic runs as a cloud service. If your full log system must stay in your own data center, consider Motadata ObserveOps, Splunk Enterprise, Elastic, or SigNoz.
Challenge 3: Monitoring more than logs
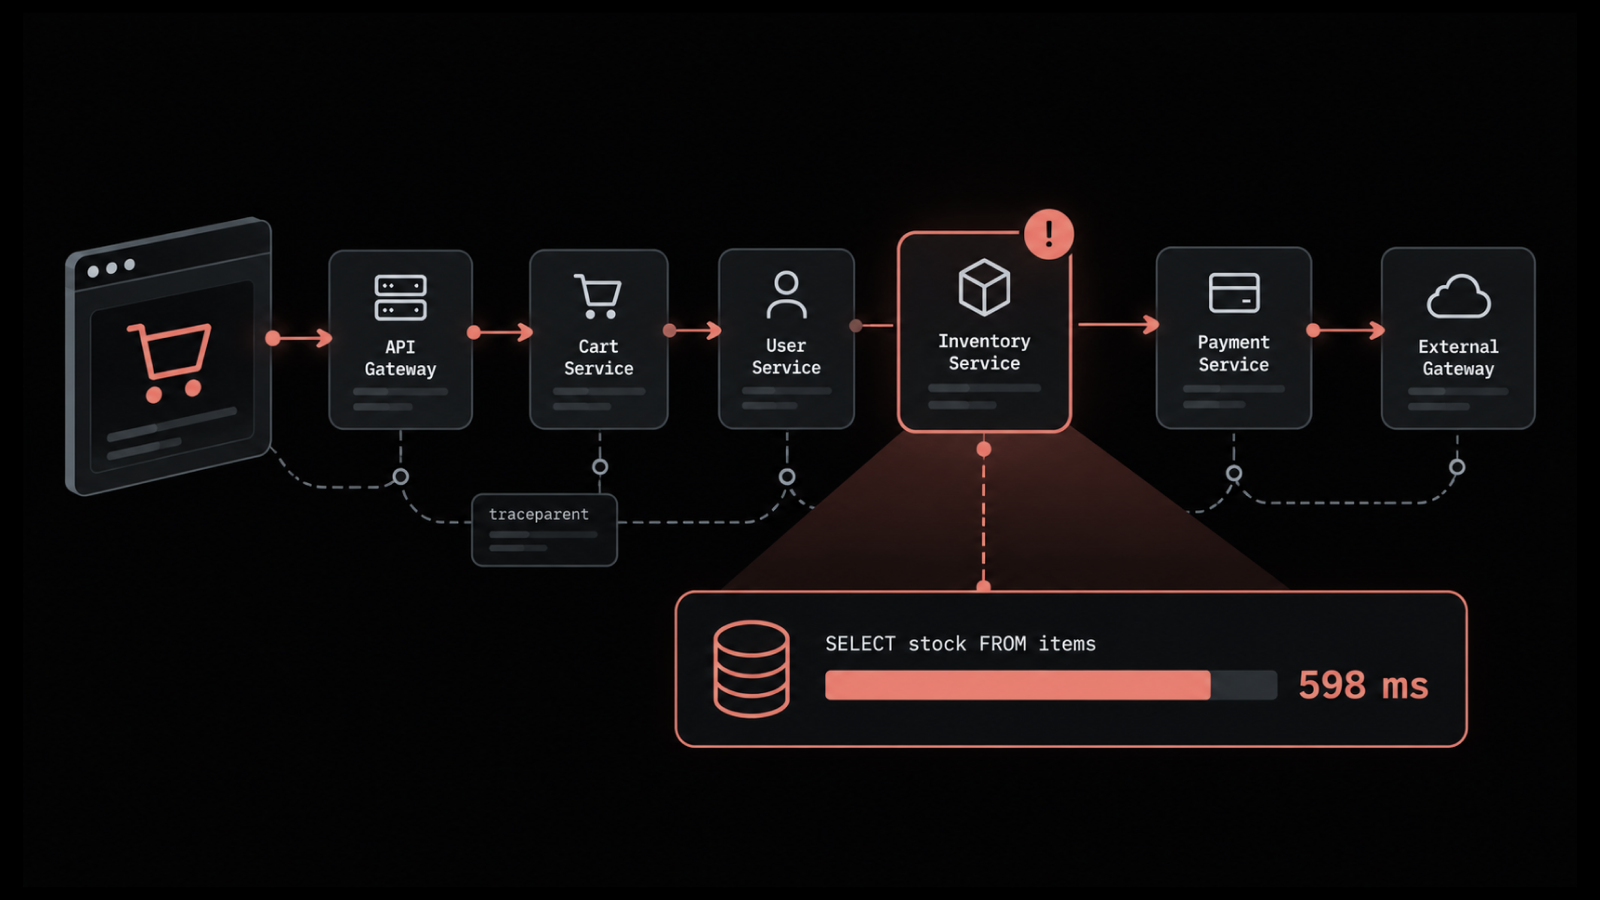
A log alert may show that an app has failed, but it may not show why. The cause could be a slow database, a full server disk, a bad network link, or a failed cloud service.
Teams often want to view logs alongside app, server, container, and network data. This can reduce the time spent moving between tools. Motadata, Datadog, New Relic, and Dynatrace all provide these views, but they charge in different ways.
Challenge 4: Managing day-to-day complexity
Every log tool has its own search style, setup steps, and terms. A product may have many features but still feel difficult for a small team to use. If only a few people need to check errors and receive alerts, Grafana Cloud may be simpler.
Challenge 5: Maintaining control over log data
Some teams want to choose where logs are stored and how long they are kept. Elastic and SigNoz can run on your own systems. These choices give you more control, but your team must handle more setup and maintenance.
How We Compared These Sumo Logic Alternatives
We looked at the points that usually matter when a team moves away from Sumo Logic:
Log collection and search: The tool must collect logs from common systems and help people find errors without long delays.
Other monitoring data: We checked whether each tool also handles app, server, network, metric, and trace data.
Setup choice: We looked for cloud, self-managed, and on-premises choices.
Price: We used prices shown on official vendor sites. When a vendor does not list a public price, we say that a quote is needed.
Ease of use: We checked how much setup and product knowledge a team may need.
Limits: We explain the main problem you may face with each tool.
There is no single winner for every team. The sections below will help you see which tool suits your needs.
1. Motadata ObserveOps
Best for: Teams that want to monitor logs, apps, servers, cloud services, and network devices from one place.
Motadata ObserveOps lets you monitor logs, applications, servers, databases, cloud services, and network devices from one screen.
It combines log monitoring, application performance monitoring, and network monitoring in the same product.
For example, a log may show that a service has stopped working. Your team can then check the application, server, and network data from the same time.
This can help them find the cause without moving between several tools.
You can run Motadata ObserveOps on-premises, in a private cloud, or as a hosted service. The on-premises option is helpful for companies that must keep monitoring data on their own systems.
Pros
- It covers logs and the wider IT system in one product.
- It supports on-premises, private cloud, and hosted setups.
- It helps when network problems cause many of your incidents.
Cons
- Public prices are not listed.
Pricing
Motadata uses custom pricing. Its annual subscription includes product updates and support. A perpetual license is also available with three or five years of support. Ask for a quote based on your setup and data needs. A free trial is available.
2. Splunk
Best for: Large companies that need detailed log searches, security tools, and support for high data volumes.
Splunk lets you collect, search, and study logs from many systems. It also provides dashboards, alerts, reports, and security tools.
For example, a security alert may point to unusual activity on a server. Your team can search the related logs, check what happened, and see which users or systems were involved.
You can use Splunk Cloud Platform as a managed service. You can also run Splunk Enterprise on systems managed by your company. Splunk is mainly suited to large IT and security teams that work with a lot of data.
Splunk can take time to set up and learn. It also does not list a fixed public price for its main platform. The price can depend on the amount of data you send or the amount of work the platform does.
You can also read our Splunk alternatives guide to compare it with other log and security tools.
Pros
- It can handle large amounts of data from many sources.
- It offers detailed search and security tools.
- It offers cloud and self-managed options.
Cons
- Splunk does not publish a starting price for its main platform.
- Learning how to search and set up Splunk can take time.
- Costs can rise as data volume and search activity grow.
Pricing
Splunk asks customers to contact its sales team for platform pricing. Its workload model charges for the work done by the platform. Its ingest model charges for the amount of data you send. Splunk Enterprise has a 60-day free trial.
See our Splunk pricing guide for a closer look at its pricing models.
3. Datadog
Best for: Cloud teams that want to see logs beside app, container, server, and cloud data.
Datadog puts logs, application data, server data, container data, and cloud data in one platform. It is mainly used by teams that run applications in AWS, Azure, Google Cloud, or Kubernetes.
If an application becomes slow, your team can check its logs and the related server or container data from the same screen. They can then see whether the problem started in the application, server, or container.
If your team already uses Datadog for application or server monitoring, you can add log management to the same account. Datadog also connects with many common cloud services and software tools.
Log pricing has two main charges. You pay for each GB of logs sent to Datadog. You also pay for the events that are indexed and kept for search. Application monitoring, server monitoring, and other Datadog products cost extra.
You can also read our Datadog alternatives guide to compare it with other cloud monitoring tools.
Pros
- It monitors cloud applications and containers.
- It connects logs with app and system data.
- It connects with many common tools and cloud services.
Cons
- Log intake and log indexing are charged separately.
- Adding several Datadog products can raise the bill.
- The full platform cannot run on-premises.
Pricing
Log intake costs $0.10 per GB. With yearly billing, indexed logs start at $1.06 per one million events for three-day storage. The price rises to $1.70 for 15 days and $2.50 for 30 days. Datadog offers a 14-day free trial. Check the official price list because other monitoring products are charged separately.
See our Datadog pricing guide for a closer look at its separate product and usage charges.
4. Elastic Cloud
Best for: Teams that need detailed log searches, storage options, and a choice between cloud and self-managed use.
Elastic lets you store and search logs with Elasticsearch. Your team can use Kibana to search data, create dashboards, and set alerts. Elastic Observability also monitors applications and servers.
For example, a log may show that an application has failed. Your team can search the related logs in Kibana and check the application and server data from the same time. Recent logs can stay ready for quick searches, while older logs can move to lower-cost storage.
You can use Elastic Cloud Hosted, which is managed by Elastic. You can also install the free Basic version on your own systems. The self-managed option gives you more control over where your logs are stored.
Elastic needs more setup than many cloud log tools. Your team must decide how logs will be organized, searched, and stored. If you run it yourself, your team must also handle updates and backups.
You can also read our Elasticsearch alternatives guide to compare other log search and storage tools.
Pros
- It gives teams more control over log search and storage.
- A free self-managed Basic version is available.
- It can store and search log and security data.
Cons
- Running it yourself requires more setup and maintenance.
- Cloud costs depend on the size and type of resources you choose.
- Teams may need Elasticsearch skills.
Pricing
The self-managed Basic version is free. Contact Elastic for the price of paid support. Elastic Cloud Hosted Standard starts at $99 per month. Gold starts at $114, Platinum starts at $131, and Enterprise starts at $184 per month. Cloud costs depend on your provider, region, storage, and system size. A free cloud trial is available.
See our Elasticsearch pricing guide for more details about its cloud and self-managed costs.
5. Grafana Cloud
Best for: Teams that already use Grafana dashboards, Prometheus metrics, or Loki logs.
Grafana Cloud lets your team view logs, metrics, and traces in Grafana dashboards. It uses Loki to store and search logs. Loki sorts logs by labels, such as the application name, server name, or service name.
For example, a dashboard may show that a service has become slow. Your team can open the related logs and traces in Grafana to check what happened at the same time.
Grafana Cloud suits teams that already use Grafana, Loki, or Prometheus. They can keep many of their existing dashboards, while Grafana Cloud manages the tools for them.
The free plan includes 50 GB of logs each month. The Pro plan charges separately for processing, writing, and storing extra logs. Teams that have not used Loki before will also need to learn its LogQL search language.
You can also read our Grafana alternatives guide to compare other dashboard and monitoring tools.
Pros
- Existing Grafana users will know many of the screens.
- The free plan includes 50 GB of logs per month.
- It supports many open tools and data sources.
Cons
- The Pro plan charges separately for log processing, writing, and storage.
- Teams new to Loki need to learn labels and LogQL.
- Poor label choices can make log search less useful.
Pricing
The Free plan costs $0 and includes up to 50 GB of logs per month with 14-day storage. Pro has a $19 monthly platform fee, includes 50 GB, and keeps logs for 30 days. Extra log use starts at $0.050 per GB for processing, $0.400 per GB for writing, and $0.100 per GB for storage. Enterprise pricing is custom and requires a yearly order of at least $25,000.
See our Grafana Cloud pricing guide for a closer look at its usage charges.
6. New Relic
Best for: Software teams that want logs and app monitoring with a large free data limit.
New Relic collects logs along with application, server, browser, and mobile app data. Developers can use it to see an error and then check the application request linked to that error.
New Relic connects related data by using details such as the application name, host name, or trace number. This helps your team move from a log message to the affected service without starting a new search.
The platform also includes dashboards, alerts, error views, and service maps. Software teams can use it for log management and application monitoring.
Each account includes 100 GB of data per month at no charge. You pay for extra data after that. Compute use and some user access can add more charges, so the data price may not be your total cost.
You can also read our New Relic alternatives guide to compare other application and log monitoring tools.
Pros
- The free plan includes 100 GB of data each month.
- It helps developers find app errors and the related logs.
- It supports many kinds of software monitoring data.
Cons
- The bill can include data, compute, and user costs.
- The full platform cannot run on-premises.
- Some price and access terms depend on the chosen edition.
Pricing
New Relic includes 100 GB of data per month at no charge. Original Data costs $0.40 per GB above that limit. Data Plus costs $0.60 per GB above the free limit. Compute and user charges can also apply, so check the estimate for your chosen edition.
See our New Relic pricing guide for more details about its data, compute, and user charges.
7. Dynatrace
Best for: Large app systems where teams need logs tied closely to app and system health.
Dynatrace monitors applications, servers, containers, cloud services, user activity, logs, and security data. It also shows how the parts of an application connect with each other.
If an application becomes slow, your team can check which service, server, or database may be causing the problem. They can then open the logs from the same service and time period.
Dynatrace is mainly suited to large applications with many services. It may offer more than a small team needs if that team only wants to collect and search logs.
Pricing is split across the products and data types you use. Log intake and storage have separate rates. Application and server monitoring also cost extra. Check the full list of products you need before comparing its price with Sumo Logic.
You can also read our Dynatrace alternatives guide to compare other application and infrastructure monitoring tools.
Pros
- It shows the app and system data around a problem.
- It links logs with a live map of the system.
- It covers many monitoring needs in one service.
Cons
- Dynatrace charges separately for several products and types of usage.
- Small teams may not need all its features.
- Choosing and setting up the right products can take time.
Pricing
Log intake starts at $0.20 per GiB. Log storage starts at $0.02 per GiB per day. Dynatrace lists no extra query charge for logs kept for up to 35 days. Infrastructure Monitoring starts at $0.04 per host hour, shown as about $29 per host per month. Full-Stack Monitoring starts at $0.08 per hour for an 8 GiB host, shown as about $58 per month. A 15-day trial is available.
See our Dynatrace pricing guide for a closer look at its product and usage charges.
8. SigNoz
Best for: Teams that want an OpenTelemetry tool with cloud and self-managed choices.
SigNoz puts logs, metrics, and application traces in one tool. It uses OpenTelemetry to collect this data. OpenTelemetry is an open standard, so the same data collector can work with other supported tools.
For example, SigNoz may show that an application request is slow. Your team can open the trace, find the affected service, and check the logs linked to that request.
The Community edition can run on your own systems and has no license fee. SigNoz Cloud is managed by the vendor and charges for the amount of data you send.
SigNoz does not include all the security tools found in Sumo Logic. The self-managed version also needs servers, storage, updates, and backups. Include these costs when you compare it with SigNoz Cloud.
You can also read our SigNoz alternatives guide to compare other open monitoring tools.
Pros
- It supports an open data collection standard.
- You can use the cloud service or run it yourself.
- Cloud pricing does not add host or user fees.
Cons
- The self-managed version requires ongoing maintenance.
- It offers fewer security features than a full SIEM tool.
- Teams new to OpenTelemetry may need setup time.
Pricing
The self-managed Community edition is free. SigNoz Cloud starts at $49 per month and includes $49 of usage. The company lists extra logs and traces at $0.30 per GB. Metrics cost $0.10 per one million samples. The cloud plan includes unlimited teammates and hosts.
See our SigNoz pricing guide for more details about its cloud and self-managed costs.
How to Choose the Right Sumo Logic Alternative
The longest feature list is not always the best choice. Start with the problem that made your team look for another tool.
Choose based on the main problem
Choose Motadata ObserveOps if you need logs beside network, server, app, and cloud health, or if you need an on-premises option.
Choose Splunk if large-scale log search and security work are the main needs.
Choose Datadog if you already use Datadog and want logs tied to cloud app data.
Choose Elastic if search control, storage choice, or self-management matters most.
Choose Grafana Cloud if your team already works with Grafana, Loki, or Prometheus.
Choose New Relic if you want a large free data limit and strong app context.
Choose Dynatrace if you have a large app setup and need to see how its services connect.
Choose SigNoz if you want OpenTelemetry and a free self-managed edition.
Compare the full monthly cost
Ask each vendor to calculate a price using the same data volume and storage period. Use your busiest normal month, not a quiet test week. Include these details:
The amount of logs you create each day, measured in GB.
The number of log events you need to index.
How long you need to keep recent and old logs.
The number of hosts, containers, apps, and users.
Any app, network, security, or on-call tools you also need.
Support, training, and data transfer costs.
A tool with a low intake rate can cost more after indexing and storage. A fixed bundle can also become costly when you pass its limit. Ask for one estimate for normal use and another for a busy month.
Test the tools with your own logs
Send a safe set of your own logs to the two or three tools you like most. Ask the people who will use the product to complete the same tasks in each one:
Find one known app error.
Follow the error to the right app, server, or network device.
Build an alert that does not send the same warning again and again.
Limit access to a test group.
Check how much data the test used and estimate the amount for a full month.
Choose the tool that helps your team find answers without extra work. You should also be able to understand how the bill is worked out.
Which Sumo Logic Alternative Should You Choose?
The right choice depends on what you need to fix with your current log management setup.
Motadata ObserveOps is worth considering if you want logs, applications, servers, cloud services, and network devices in one platform. It also supports on-premises and private cloud deployment, which can be useful when your data needs to stay within your own infrastructure.
Before making the switch, test the platform with your own logs and a real service. Check how well it handles your monitoring requirements, how easy it is for your team to use, and what the total cost will be at your expected log volume.
If you want a single platform for logs and infrastructure monitoring, request a Motadata ObserveOps demo and test it with one real service before making the final decision.
FAQs
What is the best Sumo Logic alternative?
There is no single best option for every team. Motadata ObserveOps covers IT monitoring and can run on-premises. Splunk handles detailed log searches and security work. Datadog and Dynatrace cover cloud application monitoring. Elastic and SigNoz can run on systems managed by your own team.
Is there a free alternative to Sumo Logic?
Yes. Elastic and SigNoz have free self-managed editions. Grafana Cloud includes up to 50 GB of logs per month, and New Relic includes 100 GB of data per month. Self-managed tools still need servers, storage, updates, and staff time.
Which Sumo Logic alternative can run on-premises?
Motadata ObserveOps, Splunk Enterprise, Elastic, and SigNoz can run on systems managed by your company. Check the exact license and support terms before buying. Also make sure your team can handle updates, backups, storage, and access rules.
How much does a Sumo Logic alternative cost?
The cost can range from a free plan to a large custom contract. Vendors may charge by GB, stored events, hosts, or the amount of work done by the platform. Use your normal daily log volume and storage time when asking for a price. Include support and any extra app or security products.
What should I check before moving from Sumo Logic?
Check log sources, saved searches, alerts, dashboards, storage rules, user access, and links to other tools. Export what you are allowed to keep. Run both tools for a short time so you can test the new alerts before turning off the old setup.
Author
Ramya Shah
Technical Writer
Ramya Shah is a technical content writer with a computer engineering background and roots in automotive journalism. He covers IT Service Management, observability, IT operations, and AI-driven automation. An early adopter of AI-assisted writing workflows, he turns complex IT processes into clear, engaging content optimized for search and answer engines (AEO), lifting content output and organic visibility.