Top 10 Splunk Alternatives in 2026
Splunk can answer almost any question you throw at your machine data. That is the good part.
The trouble is the meter running underneath, because its pricing has for years scaled with how much data you ingest, which turns a monitoring decision into a budgeting one.
So teams start rationing. They drop the chatty debug logs, cut retention from 90 days to 30, and quietly decide some sources are not worth indexing.
A tool bought for visibility ends up rationing it, and that is the moment people start pricing Splunk alternatives.
Two other things changed the math recently. Cisco closed its Splunk acquisition in early 2024, and a deal that size drags its packaging and pricing through every renewal for years.
Then there is SPL. Splunk's query language is powerful, and it is also a skill your team has to build and keep.
Someone owns the indexers, the search heads, the storage tiers, and the dashboards. That someone rarely gets the time back.
None of this means you rip Splunk out immediately. It means you owe yourself a look at the field before the next renewal lands.
In this blog, you will see:
Ten Splunk alternatives compared on cost, coverage, operational burden, and correlation depth.
A clear split between the observability job and the SIEM job, so you shortlist the right category instead of the loudest brand.
A comparison table plus honest reviews, with real cons listed for every tool on the list.
A decision guide for picking by situation, and an honest note on where Splunk still wins.
By the end, you will know which alternative fits your data volume, your deployment model, and whether you are really replacing observability, security analytics, or both.
What Counts as a Splunk Alternative?
Splunk is two products wearing one logo, and that mix is where most shortlists fall apart. Here are the 2 jobs that the 2 products take care of:
1. Observability and log analytics
In observability and log analysis, you pull logs, metrics, and traces off your infrastructure and apps, search them fast, and work out why something broke.
That is the lane Splunk Enterprise, Splunk Cloud, and Splunk Observability Cloud (once SignalFx) run in, and it is the lane every tool below is built for.
2. SIEM and security operations
Here you correlate security events, run detections, feed a SOC, and drive response, which is Splunk Enterprise Security and Splunk SOAR territory.
If that is your real Splunk workload, skip the observability tools and look at a purpose-built SIEM, such as Microsoft Sentinel, Elastic Security, or Palo Alto Cortex XSIAM.
An observability platform is not a SIEM. Treat one as your security stack and you will feel the gap fast. The ten reviews below stay on the observability and log-analytics job, where the field is widest.
Why Do Teams Look for a Splunk Alternative?
Teams rarely leave Splunk because it broke. They leave for three reasons, and cost is usually the loudest.
1. The Bill Scales With Ingest, Not Value
Splunk's classic model charged on the data you send it each day. That sounds fair, until your volume outruns your budget, which it always does.
A new microservice here, a chattier app there, a compliance rule that says keep everything for a year, and the renewal turns into a negotiation. The real damage is behavioral.
Teams start dropping sources and trimming retention to stay under the cap, which is the exact thing an observability platform is supposed to prevent.
Newer workload tiers soften the edges. The instinct to ration data, once learned, is hard to shake.
2. SPL and Cluster Ops Are a Full-Time Job
SPL is one of the sharpest query languages in the category, and that sharpness costs you.
It has a learning curve, and before long a couple of people are the only ones who write the searches everyone else depends on.
Under the language sits the machinery: indexers, search heads, forwarders, hot and cold storage tiers, and the constant tuning that keeps queries quick at scale.
Self-managed Splunk runs like a full-time job. Splunk Cloud lifts some of it, but the data modeling and dashboard work stay on your plate.
3. The Cisco Era Adds Pricing and Packaging Uncertainty
Cisco closed the Splunk deal in early 2024, and acquisitions that big reshuffle roadmaps, bundles, and price lists. Some teams like the tighter networking and security story.
Others just hate betting a multi-year data platform on packaging that has not settled. Either way, renewal uncertainty sends people browsing, the same way Grafana's license switch and Elastic's on-again off-again licensing pushed their own users to shop around.
Splunk is not the villain here. It is still one of the best search-and-analytics engines ever pointed at machine data, and a big SOC with deep SPL muscle will struggle to replace it outright.
But if the bill, the upkeep, or the uncertainty has you looking, the ten below are worth real evaluation.
How We Evaluated These 10 Tools
We leaned on vendor docs, G2 and Gartner Peer Insights reviews, and the honest chatter on Reddit and Hacker News, then scored each tool on five things that matter when Splunk is the thing you are leaving:
Cost predictability. Does the price scale sanely as data grows, or does it bite harder every time you log more? Ingest-tax models lose points here.
Coverage across logs, metrics, and traces. Splunk reaches wide. A logs-only replacement leaves holes you will plug with another tool and another invoice.
Operational burden and migration. How much work is it to stand up, run, and move off SPL and Splunk's data model?
AI and correlation depth. Past search, does it link signals and name a cause, or just hand you more dashboards?
How far the loop closes. Spotting the problem is half of it. Does the tool route, ticket, and resolve, or quit at the alert?
Those last two are where most log tools tap out and where a full platform earns its keep. Hold onto them as you read.
The 10 Best Splunk Alternatives Compared
Tool | Best For | Type | Deployment | Pricing Model | Free Trial |
Motadata ObserveOps | Hybrid, regulated, ITSM-tied estates | Full ITOps platform | On-prem, private/public cloud | Quote-based | Yes, 30 days |
Datadog | Cloud-native, multi-signal SaaS observability | SaaS observability platform | SaaS | Per-host + per-feature | Yes, 14 days |
Elastic Stack | Search-heavy log analytics and security | Search & log analytics | Self-hosted or cloud | Resource-based / free tier | Yes |
Dynatrace | Enterprise automation and AI-assisted ops | SaaS observability + AIOps | SaaS, managed | Consumption-based | Yes, 15 days |
New Relic | Full-stack observability with a generous free tier | SaaS observability platform | SaaS | Usage + per-user | Free tier |
Sumo Logic | Cloud log management with a SIEM option | Cloud log analytics + SIEM | SaaS | Ingest / credits-based | Yes |
Grafana + Loki | Open-source, cost-efficient log + metrics stack | Open-source observability | Self-hosted or cloud | OSS + paid cloud | Free tier |
Graylog | Centralized log management | Log management (+ security tier) | Self-hosted or cloud | OSS + paid tiers | Yes |
OpenObserve | Budget-conscious teams cutting storage cost | Log/observability backend | Self-hosted or cloud | OSS + usage-based cloud | Free tier |
SigNoz | OpenTelemetry-first open-source observability | Open-source observability | Self-hosted or cloud | OSS + usage-based cloud | Free tier |
Detailed Overview of the 10 Best Splunk Alternatives
Here is the closer look at each one, Motadata ObserveOps first.
1. Motadata ObserveOps
Best for: Hybrid, regulated, or ITSM-tied estates that want metrics, logs, flows, and traces in one product, with the correlation and ticketing to act on them, rather than a stack of separate tools.
Rating: 4.6/5 on G2, 4.3/5 on Gartner Peer Insights.
Motadata ObserveOps flips the Splunk reflex of ingest first, count the cost later. It puts metrics, logs, network flows, and traces in one backend, with the topology that connects them, so you are not correlating across four consoles.
Pricing is quote-based and scoped to your deployment and modules, not metered per gigabyte, which pulls the ration-your-logs instinct out of the equation.
The engine underneath is DFIT, and it works on causation, not lookalike patterns. It needs no training window to earn its keep, so you see correlated root-cause signals in week one instead of week twelve.
Flows come in natively (NetFlow, sFlow, jFlow, IPFIX), the kind of thing most observability tools bolt on late, so a saturated uplink shows up beside the app errors it is causing.
And since Motadata builds ServiceOps too, an ObserveOps alert can raise and route a service desk ticket on its own. The loop closes instead of pinging someone and stopping.
This G2 review from a Motadata customer captures the common theme: teams consolidating several point tools into one platform and getting correlation they did not have before.
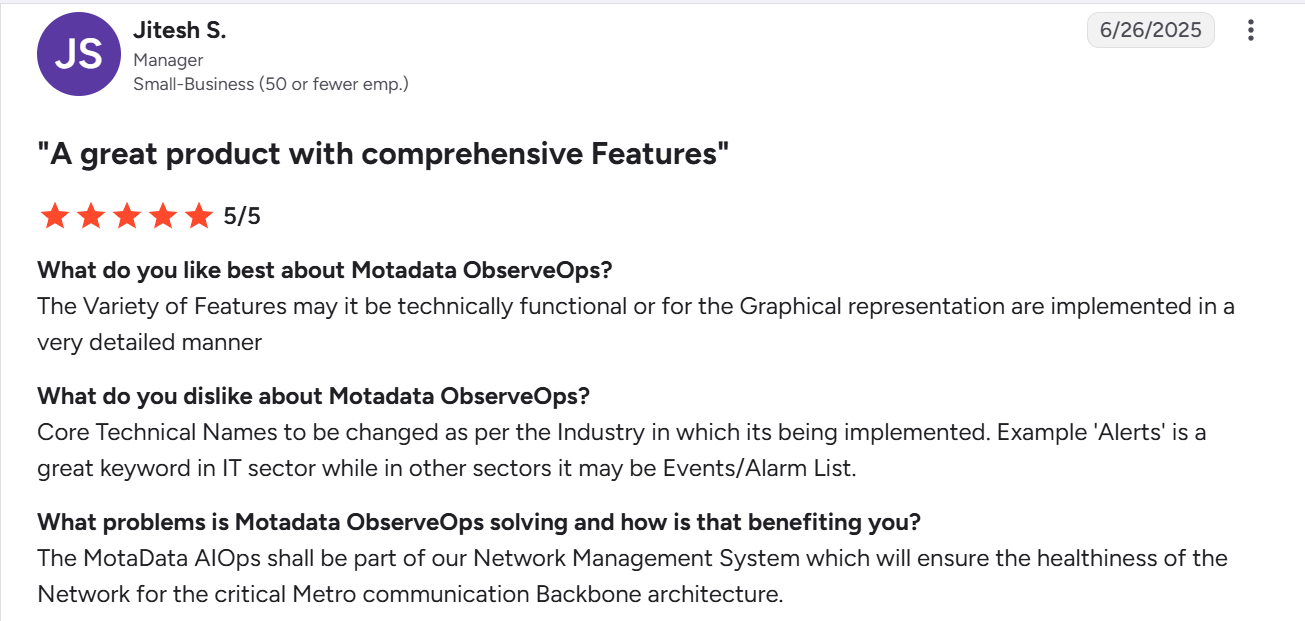
Check out more of our G2 reviews.
Pros
- One platform replaces several point tools, so signals correlate instead of scattering
- Correlation works from day one, without a baseline-learning period
- On-prem and hybrid deployment for regulated and air-gapped estates
- Native ITSM ticketing closes the detect-to-resolve loop
Cons
- Pricing is quote-based rather than published, so you talk to sales before you see a number, unlike the open source options here
- Review volume on G2 and Gartner Peer Insights is thinner than the decade-old category giants
- It is a full ITOps platform, so a team that only wants a lightweight log store is buying more than a Splunk swap
Pricing: Quote-based, scoped to your deployment mode and the modules you need, with a 30-day free trial.
2. Datadog
Best for: Cloud-native teams that want logs, metrics, traces, and security in one polished SaaS.
Rating: 4.4/5 on G2.
Datadog bundles infrastructure monitoring, APM, log management, RUM, synthetics, and a security suite under one SaaS roof, with dashboards people actually like.
If you live in AWS, Azure, GCP, and Kubernetes, it clicks into place quickly. Then the invoice lands.
However, Datadog charges per host and then per feature, and the add-ons pile up fast at scale.
That way, the cost problem that chased you off Splunk can move right in. It is SaaS-only as well, which is a hard stop for on-prem or air-gapped shops.
Pros
- Broad multi-signal coverage in one SaaS
- Polished dashboards and granular alerting
- Huge integration catalog
Cons
- Per-host, per-feature pricing gets expensive at scale
- SaaS-only, no on-prem option
- Costs are hard to predict as usage grows
Pricing: Per-host plus per-feature, with a 14-day free trial. Our Motadata vs Datadog comparison digs into the pricing difference.
3. Elastic Stack (ELK)
Best for: Search-heavy teams that want fast log analytics with the option to add security.
Rating: 4.5/5 on G2, 4.5/5 on Gartner Peer Insights.
The Elastic Stack (Elasticsearch, Logstash, Kibana, Beats) is the nearest thing to a straight search-engine swap for Splunk.
Full-text search over huge log volumes is quick, the ecosystem is enormous, and you can self-host or run Elastic Cloud. Elastic Security layers a real SIEM on the same data, which is why it lands on both this list and the SIEM side of the split.
The bill you pay is operational. At scale you are minding shards, JVM heap, and cluster health, and the ramp is steep.
The 2021 license change, then the 2024 AGPLv3 addition, left a few teams uneasy about where the licensing goes next.
Hence, many people also consider checking out Elasticsearch alternatives for their businesses. It is powerful, but nobody calls it low-maintenance.
Pros
- Excellent search performance and flexibility
- Large ecosystem and community
- Doubles as a SIEM via Elastic Security
Cons
- Cluster operations (shards, JVM, scaling) are a real burden
- Steep learning curve
- Licensing history makes some teams cautious
Pricing: Free self-managed tier, with resource-based pricing on Elastic Cloud. Our Elasticsearch alternatives guide has the full breakdown.
4. Dynatrace
Best for: Large enterprises that want automation and AI-assisted root cause over manual dashboarding.
Rating: 4.5/5 on G2.
Dynatrace is the enterprise AIOps heavyweight. OneAgent finds your services and their dependencies on its own, and the Davis AI engine runs root-cause analysis across the topology it maps.
In a sprawling estate where hand-wiring every dashboard is hopeless, that automation is the whole point, and Dynatrace is genuinely good at it.
The price is premium, and the consumption model rewards teams that scope carefully.
It is built for the enterprise end, so smaller shops often find it is more platform, and more money, than the job needs.
Pros
- Strong automation and AI-driven root cause
- Automatic service and dependency mapping
- Deep enterprise-grade APM
Cons
- Premium pricing
- Consumption model needs careful management
- Heavier than smaller teams require
Pricing: Consumption-based, with a 15-day free trial.
5. New Relic
Best for: Teams that want full-stack observability with a genuinely useful free tier.
Rating: 4.4/5 on G2, 4.6/5 on Gartner Peer Insights.
New Relic rebuilt its pricing around data ingested plus per-user seats, and its free tier is one of the roomier ones, so getting started is easy. APM, infrastructure, logs, and browser data all land in one platform, and developers tend to like living in it.
Watch the scale, though. Ingest plus seats can climb as you add both data and people, so give that free tier a hard look before production leans on it. Like the rest of the SaaS suites here, it is hosted, with no on-prem door.
Pros
- Full-stack observability in one place
- Free tier lowers the barrier to entry
- Strong APM without heavy manual setup
Cons
- Costs grow with data and user count
- Per-user pricing can surprise larger teams
- SaaS-hosted only
Pricing: Free tier, then usage plus per-user pricing.
6. Sumo Logic
Best for: Cloud teams that want log management and a SIEM option from one managed service.
Rating: 4.3/5 on G2, 4.3/5 on Gartner Peer Insights.
Sumo Logic is a cloud-native log and observability platform with a real security half, which makes it an easy Splunk swap for teams that live in ops and security at once.
It is fully managed, so there is no cluster to babysit, and it sets log analytics next to a Cloud SIEM.
It bends less than a self-hosted Elastic stack, and the credits pricing takes a spreadsheet to predict.
Still, if you want SIEM and observability without running the plumbing yourself, it sits in a strong middle.
Pros
- Combines observability and SIEM in one managed service
- No infrastructure to operate
- Good prebuilt content
Cons
- Credits-based pricing is hard to predict
- Less customizable than self-hosted options
- Deep customization can require expertise
Pricing: Ingest and credits-based, with a free trial.
7. Grafana + Loki (LGTM Stack)
Best for: Open-source-first teams that want a cost-efficient log and metrics stack they control.
Rating: 4.5/5 on G2 (Grafana Labs).
The Grafana stack (Loki for logs, Prometheus or Mimir for metrics, Tempo for traces, Grafana for dashboards) is the open-source reflex when Splunk's price stings.
Loki keeps log storage cheap by indexing lightly, and the whole thing is modular and free to license. If your engineers are happy running their own tooling, nothing here beats it on cost. The cost shows up as overhead.
That is four moving parts, more than one query language, and the correlation a unified platform hands you left for your team to build by hand. You trade the license fee for engineer hours.
Pros
- Very cost-efficient at scale
- Flexible, modular, and open-source
- Excellent visualization layer
Cons
- Four tools and multiple query languages to run
- Correlation is largely DIY
- Operational overhead falls on your team
Pricing: Open-source, with paid Grafana Cloud tiers and a free plan. Our Grafana alternatives guide has the full picture.
8. Graylog
Best for: Teams that mainly need centralized log management, with a path to security.
Rating: 4.4/5 on G2, 4.5/5 on Gartner Peer Insights.
Graylog is the log platform teams grab when they want ELK-style central logging without babysitting raw Elasticsearch.
It covers collection, parsing, search, and alerting behind an approachable UI, with a security tier for light SIEM work.
It sits closer to log management than full observability, since metrics and tracing are not its focus, so multi-signal coverage means pairing it with other tools.
For central logging done properly, though, it is a solid and cheaper pick.
Pros
- Straightforward centralized log management
- Easier to run than raw Elasticsearch
- Enterprise and security tiers available
Cons
- Log-focused, not full observability
- Metrics and tracing need other tools
- Advanced features sit behind paid tiers
Pricing: Open-source core, with paid Operations and Security tiers and a trial.
9. OpenObserve
Best for: Budget-conscious teams whose main goal is to cut storage and ingest cost.
Rating: Newer entrant with limited G2 presence, so trust runs mostly through fast-growing GitHub adoption (a small Gartner Peer Insights sample scores it around 4.7/5).
OpenObserve is one of the fastest climbers on this list, and its whole pitch is cost. Instead of heavy indexing it leans on object storage (S3-class), which drops the storage line sharply against indexed platforms, and it is OpenTelemetry-native with quick queries and a small footprint.
If the bill is your only reason to leave Splunk, few answers are this direct. Youth is the catch.
It has a smaller community, fewer integrations, and less mileage than the decade-old names. For cost-driven teams comfortable on newer tooling, that trade usually pays.
Pros
- Dramatically lower storage cost
- OTel-native and fast
- Lightweight to deploy
Cons
- Younger ecosystem and smaller community
- Fewer integrations than incumbents
- Less battle-tested at very large scale
Pricing: Open-source, with usage-based cloud and a free tier.
10. SigNoz
Best for: Teams that want an OpenTelemetry-native, open-source observability app in one place.
Rating: Newer entrant, so trust runs through strong GitHub adoption rather than G2 stars.
SigNoz turns up on nearly every 2026 open-source shortlist, and the reason is simple. It is OpenTelemetry-native and keeps logs, metrics, and traces in one app rather than a stack you glue together.
A columnar store (ClickHouse) underneath handles high-cardinality data well, and you get APM, dashboards, and alerting out of the box, self-hosted or cloud.
Like OpenObserve, it is younger than the giants, so the ecosystem and the enterprise features are still filling in.
But if your team has standardized on OpenTelemetry and wants one open-source app instead of four, it is a strong bet.
Pros
- One open-source app for all three signals
- OTel-native, no vendor lock-in
- Good performance on high-cardinality data
Cons
- Younger ecosystem than incumbents
- Enterprise features still maturing
- Self-hosting requires operational effort
Pricing: Open-source, with usage-based cloud and a free tier.
How to Choose the Right Splunk Alternative?
Which one wins comes down less to the highest score and more to what you are actually swapping out. Start with your situation.
Your Situation | Start With | Why |
Hybrid or regulated estate with a service desk to feed | Motadata ObserveOps | Replaces the full stack, correlates from day one, and turns alerts into tickets |
Cloud-native, want one polished SaaS for everything | Datadog | Broadest multi-signal SaaS coverage, if you can manage the cost |
Search is the priority and you may add SIEM later | Elastic Stack | Fastest search, and Elastic Security on the same data |
Very large enterprise wanting AI-driven root cause | Dynatrace | Automatic discovery and Davis AI at enterprise scale |
Want a generous free tier to start full-stack | New Relic | Low barrier to entry, unified telemetry |
Need managed log analytics plus a SIEM option | Sumo Logic | Observability and Cloud SIEM without running the platform |
Open-source-first and cost is everything | Grafana + Loki | Cheapest at scale if you have the engineering time |
Mainly need centralized log management | Graylog | Focused log platform, easier than raw Elasticsearch |
Leaving purely because of storage cost | OpenObserve | Object-storage backend slashes storage spend |
Standardized on OpenTelemetry, want it open-source | SigNoz | OTel-native logs, metrics, and traces in one app |
Do one gut check first. Monitoring watches the failure modes you already know about.
Observability lets you ask about the ones you have not met yet, so the thing that matters is how tightly the signals correlate and how fast that points at a cause. Dashboard count is not the thing.
If your Splunk pain is cost on a job you understand cold, an open-source log store may be plenty. If the pain is that no single view explains a hybrid outage, put the correlation layer first.
Replace Splunk With Motadata ObserveOps
Splunk earned its place. For a big SOC with years of SPL investment, deep detection content, and people who know the platform cold, it is still one of the most capable engines going. Nothing above dents that.
But if you are reading this because the ingest bill decides what you are allowed to log, the platform eats a full-time role, or you want one view of a hybrid estate instead of five tools each seeing a sliver, that is the gap Motadata ObserveOps fills.
It unifies metrics, logs, flows, and traces in one backend, correlates them with DFIT from week one with no training period, and, through native ServiceOps integration, turns an alert into a ticket and closes the loop from detect to resolve.
It runs on-prem, in private or public cloud, and across the six deployment modes regulated and air-gapped teams need.
Motadata reports more than 500 enterprises across 30-plus countries on the platform, plenty of them consolidating exactly this way. If cost, upkeep, or fragmentation is what has you eyeing the exit, it is worth a conversation.
Talk to the ObserveOps team, or run a 30-day trial against your own data, and see what a single correlated view of your estate actually looks like.
FAQs
What is the best alternative to Splunk?
It depends on what you are replacing, but for most teams leaving Splunk over cost or sprawl, Motadata ObserveOps is the strongest all-around pick. It puts metrics, logs, flows, and traces in one backend, correlates them from day one, and prices without a per-GB ingest tax. If your Splunk use is really security analytics rather than observability, that is a different job, and a dedicated SIEM is the better direction there.
Why is Splunk so expensive?
Splunk has long priced on the volume of data you ingest each day, so the bill climbs every time you add a source or keep logs longer. That is what pushes teams to ration what they log. Motadata ObserveOps takes a different route, with quote-based pricing scoped to your deployment and modules instead of a per-gigabyte ingest charge, so growing your data does not automatically grow the invoice.
How hard is it to move off Splunk and SPL?
The two big lifts are SPL and the cluster itself. Your team has years of searches and dashboards built in SPL, and someone runs the indexers and storage tiers day to day, so any move has to account for both. Motadata ObserveOps eases that by putting every signal in one backend and handling the correlation for you, so you are not rebuilding a query library or babysitting shards just to get root-cause answers.
Can one tool replace Splunk for both SIEM and observability?
Rarely as cleanly as Splunk did, because those are two different jobs. Observability platforms cover the ops side well, but they are not full SIEMs, and a dedicated SIEM is not a full observability tool. For the observability and log-analytics side, Motadata ObserveOps replaces the whole stack and closes the loop into ITSM ticketing. For heavy security operations, pair it with a purpose-built SIEM.
Is Motadata ObserveOps a good Splunk alternative?
For teams fighting cost, upkeep, or a fragmented view of a hybrid estate, yes. ObserveOps puts metrics, logs, flows, and traces in one backend, correlates them with DFIT from day one, skips the per-GB ingest tax, and closes the loop to ticketing through ServiceOps. It is not a drop-in SIEM, so security-first teams should weigh it against dedicated security tools. For observability and ITOps consolidation, it fits well.
Author
Ramya Shah
Technical Writer
Ramya Shah is a technical content writer with a computer engineering background and roots in automotive journalism. He covers IT Service Management, observability, IT operations, and AI-driven automation. An early adopter of AI-assisted writing workflows, he turns complex IT processes into clear, engaging content optimized for search and answer engines (AEO), lifting content output and organic visibility.